Markets
Inflation Eases Slightly, but Risks and Rates Remain Elevated
Inflation came in slightly below expectations, but remains above the Fed’s 2% target. Core rates are higher due to falling energy prices. Rate cuts in 2025 look unlikely. Interest rates are rising again, with long-term trends shifting. Economic risks persist amid weak consumer sentiment, trade tensions with China, and growing fears of inflation and recession.
It was the week of the inflation numbers. Well, all but one: PCE (Personal Consumption Expenditures) prices are out on May 30. Maybe it wasn’t a surprise that the inflation numbers were actually kind of tame. No surprises to the upside. The CPI (Consumer Price Index) came in at 2.3% year over year (y-o-y) vs. an expected 2.4% and March’s 2.4%. The PPI (Producer Price Index) kept things going coming in at 2.4% y-o-y vs. March’s 3.4% and the expected 2.5%.
The following chart also adds the PCE Price Index, which is the Fed’s preferred measure of inflation. March’s PCE Price Index y-o-y came in at 2.3%. All these numbers are just above the Fed’s targets of 2%. Core inflation (not shown) was 2.8%, unchanged from March. The core PPI inflation rate was 3.1% vs. March’s 4.0%.
The trajectory for inflation is right, but it does hang up above the Fed’s desired rate. The big reason for the core rate being higher than the inflation rate is that energy prices have dropped enough that, once removed from the measurement (food is also removed to create the core rate), the core rate was higher.
So where does this leave the Fed? The odds of them cutting much in 2025 are low. The market is expecting only two interest rate cuts in 2025. As long as the inflation rate remains elevated and the threat of inflation from tariffs remains, the Fed will hold the line, much to the chagrin of President Trump. Our expectation is that conflict will most likely deepen as the year progresses. Not a confidence builder. Real interest rates are now present, given an inflation rate of 2.3% and the Fed rate at 4.50%, a spread of 2.2%. The last time the spread
was relatively flat was back in 2016. At the height of the pandemic the interest rate spread was negative. That in turn contributed substantially to the bubble in stocks, housing, and more. It’s highly unlikely the Fed wants to return to those days.
Interest Rates
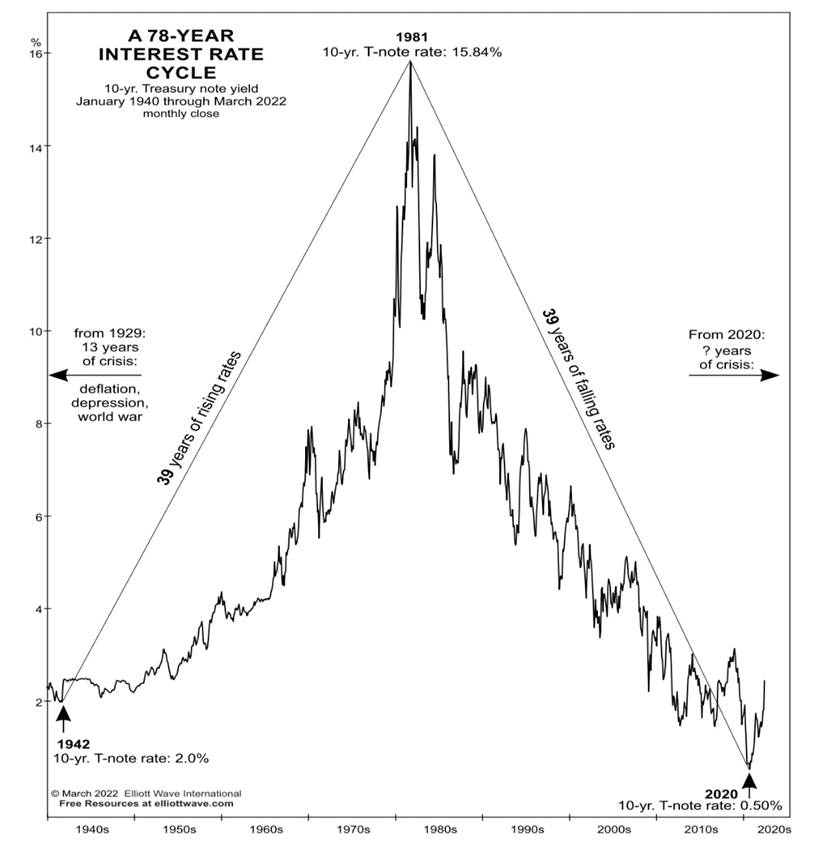
We found the chart from Elliott Wave International rather interesting. It appears to show some perfect symmetry for interest rates in that, after bottoming in 1942, they rose for the next 39 years to a peak in 1981. Then they fell for 39 years to that bottom at the height of the pandemic in 2020. Arguably, one could say it is cherry-picked as we found no evidence that the pattern was followed before 1942. In any case, it is interesting to note.
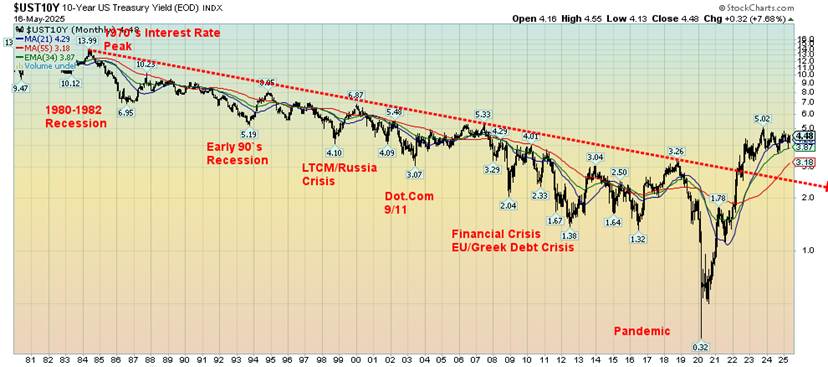
Now, the long-term fall in interest rates is over. Our long-term chart of the U.S. 10-year treasury note shows that the long downtrend is now over. Does that mean 39 years of steadily rising interest rates? Probably not. Again, we emphasize that the Elliott Wave chart, while interesting, is not necessarily a blueprint for the future. Or could it be? Only time will tell.
However, one truism we can’t help but notice is that, while the S&P 500 is relatively flat on the year, bond yields are actually rising instead of falling. Following the wild swings after “Liberation Day” on April 2, we discover that, while the S&P 500 is up 5.8%, the U.S. 10-year Treasury note yield is up 7.4%. As the crisis eased, gold was taken back down and is now up only 2.8% from April 2.
There are risks to the economy. Many are expecting a recession. Q1 GDP growth was negative 0.3%. However, that is a preliminary number with revisions to come. An official recession is two consecutive quarters of negative growth. Bonds, possibly quite correctly, are not enamoured by the move to economic populism, trade wars, and tariffs. Ultimately, the bond market sees it as inflationary. Given the unknowns, bond investors want higher, not lower, rates. Add in the potential for a huge tax cut (rumoured now to be paid by removing millions from Medicaid—that will not go over well), nervousness from foreign bond buyers, and rumours that the U.S. could be headed for a credit rating downgrade (see bond commentary) and you have the recipe for higher rates, not lower ones.
All this will weigh on stock markets eventually and the current big rebound rally in stocks could face a cold wash of reality.
Consumer Confidence
Consumer confidence keeps on sliding. Once again, the University of Michigan Consumer Sentiment came in lower than the previous month and also below expectations. The index was at 50.8 vs. the previous 52.2 and the expected 53.4. Consumer expectations also fell to 46.5 vs. 47.3 previously. Consumer sentiment is now down around where it was during the pandemic and we currently have nothing as dire as the pandemic event. Maybe the poor retail sales helped.
The April retail sales were up 0.1% month over month (m-o-m) after a gangbuster revised 1.7% jump in March. Still, a gain of 0.1% was better than the expected flat. Year over year, it was still up a robust 5.2%, unchanged from March. That y-o-y gain is above the long-term average of 4.7% since 1993. So, despite retail sales hanging in, consumer sentiment continues to deteriorate along with Trump’s approval rating. The biggest fear remains the trade war and its potential impact on inflation. There is also growing concern over the Republican attack on entitlements such as Medicare/Medicaid and Social Security.
Chart of the Week
China—the “Middle Kingdom,” the “Red Dragon,” and the biggest threat to the global supremacy of the U.S. China is a critical trading partner of the U.S. with some $583 billion of goods traded back and forth. The U.S. exports mostly mineral fuels, distillation products, machinery, nuclear reactors, oil seeds, grains, fruits seeds, and electrical equipment to China.
There is much more. China is a manufacturing giant, the world’s biggest, exporting electrical and electronic equipment, machinery, nuclear reactors, furniture, toys, games, sports equipment, plastics, apparel, vehicles, and critical minerals. China has a huge trade surplus with the U.S., largely because the U.S. wants to buy what China makes. The quid pro quo is that China, at least in the past, bought U.S. treasuries to fill the space from the huge Chinese trade surplus.
It’s strange we now discover that China has fallen to third place behind the U.K. and Japan as a holder of U.S. treasuries. They used to be number one. Buying U.S. treasuries? Not so much anymore. The trade deficit with China stands at about $306 billion, but it used to be higher. That represents roughly 23% of the total U.S. trade deficit with the world. Simply the U.S. buys products it needs or wants from the rest of the world.
According to the U.S., China is “ripping them off” because of the huge deficit. China is also accused of unfair economic practices, trade in illicit goods, use of forced labour, and theft of sensitive technologies that are a threat to the U.S. economic and security interests. China in turn sees threats from the U.S. because of the U.S.’s use of the U.S. dollar as a trade weapon, placing sanctions on countries they don’t agree with, and seizing assets of foreign countries.
In turn, China is seeking to lessen the use of the U.S. dollar in trade and other dealings with other countries by building counters to the U.S.-dominated IMF, World Bank, and SWIFT, the global payment system. In turn, China has sold off or matured U.S. treasuries and increased its gold holdings sharply to help back the Chinese yuan as a global currency.
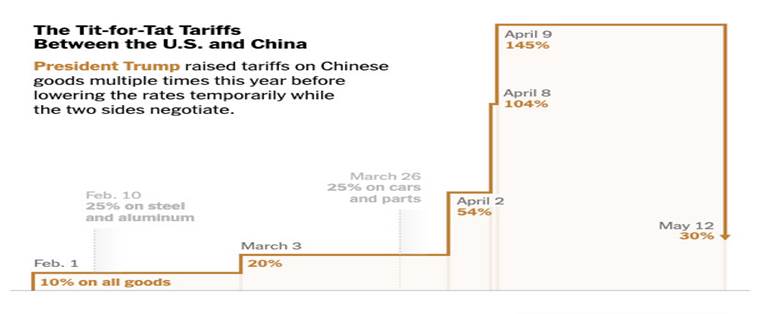
It’s not surprising that the U.S. is also militarily in conflict with China over the South China Sea and Taiwan. Chinese and U.S. warships prowl the region and, not surprisingly, there have been incidents of locking on each other. But the most recent story has been the yo-yo tariffs that the U.S. has imposed on China. What started at 10% after the inauguration of President Donald Trump escalated quickly to 20%, 54%, 104%, and 145% shortly after the U.S.’s so-called Liberation Day on April 2.
In turn, as the U.S. hiked tariffs to 145%, China increased theirs to 124% on U.S. goods. Chinese tariffs remain on goods, particularly agriculture products. Critical minerals, of which China is the world’s largest producer and holds the world’s largest reserves, have effectively been shut off. Yes, the U.S. and China called a bit of a trade truce, but at the end of the day tariffs remain that are higher today than they were at the time of the inauguration on January 20. Some truce. It’s for 90 days, but anything can happen in that period. Instead of a bludgeon, it’s just deep stab wounds that miss vital organs.
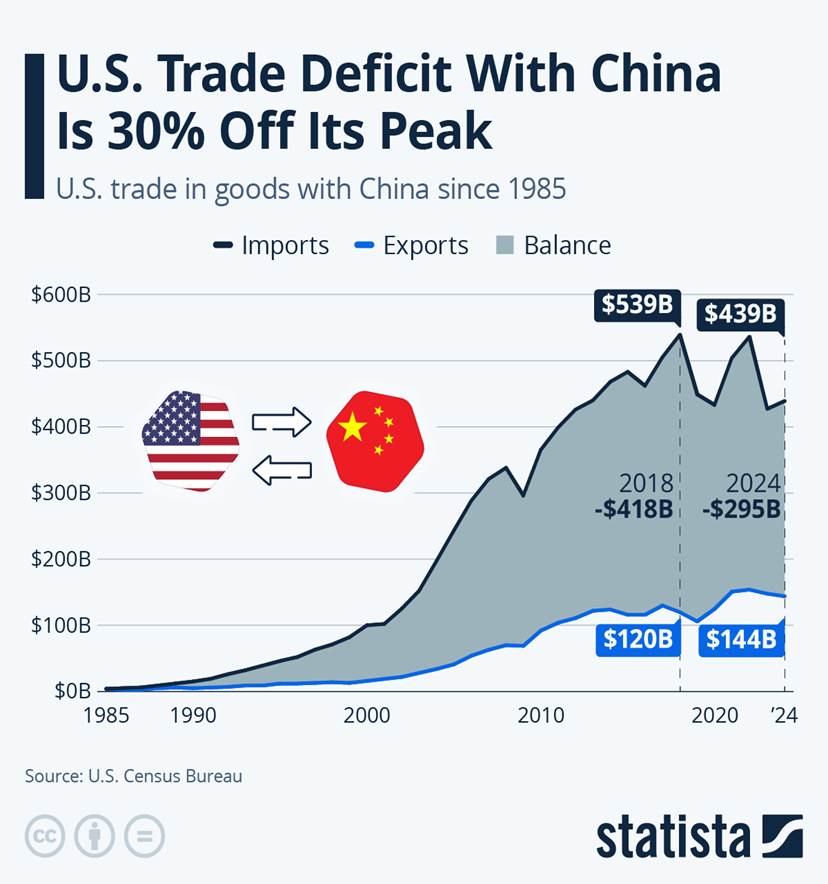
Source: www.statista.com, www.census.gov
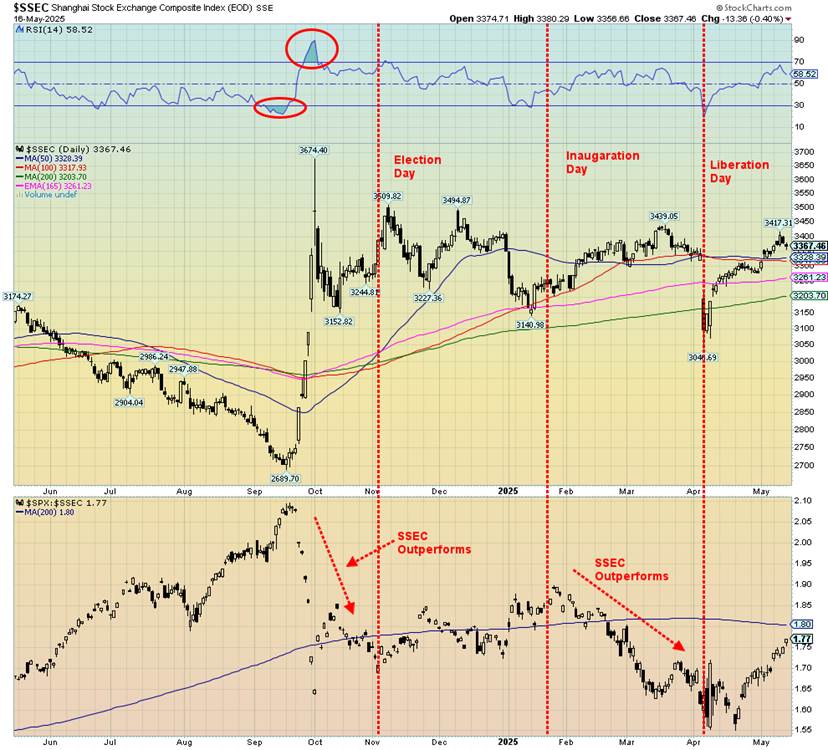
What is interesting is the response from U.S. and Chinese stock markets after Inauguration Day, Liberation Day, and the announcement of a truce of sorts between the two over tariffs. Looking at the chart of the Shanghai Stock Exchange (SSEC), we note that since Inauguration Day the SSEC is up 3.9%, while the S&P 500 is down 0.6%. Going back to Election Day on November 5, 2024, performance of the two is more mixed with the S&P 500 up 4.3% while the SSEC is up 1.7%. Edge S&P 500. Both have had their ups and downs, but both are relatively where they were when they started out on Election Day.
Performance SSEC, SPX since Election Day November 5, 2024
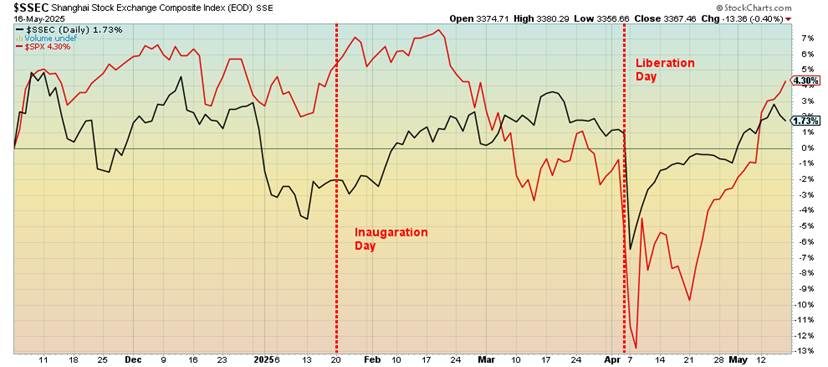
The so-called trade truce between the U.S. and China is less than the sum of its parts. It is not as great as it sounded when it was announced. Ninety days is not that long and anything can happen in the interim, particularly from a volatile U.S. Tariffs are still a lot higher today than when we started out. The military tensions remain. The two stock indices are doing well to be effectively standing still, despite small gains.
Markets & Trends
| % Gains (Losses) Trends | ||||||||
| Close Dec 31/24 | Close May 16/25 | Week | YTD | Daily (Short Term) | Weekly (Intermediate) | Monthly (Long Term) | ||
| ne | ||||||||
| S&P 500 | 5,881.63 | 5,659.91 | 5.3% | 1.3% | up | up (weak) | up | |
| Dow Jones Industrials | 42,544.22 | 42,654.724 | 3.4% | 0.3% | up | neutral | up | |
| Dow Jones Transport | 16,030.66 | 15,159.32 | 8.0% | (4.6)% | up | down | down | |
| NASDAQ | 19,310.79 | 19,211.10 | 7.2% | (0.5)% | up | up (weak) | up (weak) | |
| S&P/TSX Composite | 24,796.40 | 25,971.93 (new highs) * | 1.7% | 5.0% | up | up | up | |
| S&P/TSX Venture (CDNX) | 597.87 | 672.84 | (1.6)% | 12.6% | up | up | up | |
| S&P 600 (small) | 1,408.17 | 1,322.39 | 4.6% | (6.1)% | up | down | neutral | |
| MSCI World | 2,304.50 | 2,586.25 | 1.5% | 12.2% | up | up | up | |
| Bitcoin | 93,467.13 | 103,668.66 | 0.2% | 10.9% | up | up | up | |
| Gold Mining Stock Indices | ||||||||
| Gold Bugs Index (HUI) | 275.58 | 365.85 | (8.6)% | 32.8% | down (weak) | up | up | |
| TSX Gold Index (TGD) | 336.87 | 450.23 | (7.9)% | 33.7% | down | up | up | |
| % | ||||||||
| U.S. 10-Year Treasury Bond yield | 4.58% | 4.47% | 1.8% | (2.4)% | ||||
| Cdn. 10-Year Bond CGB yield | 3.25% | 3.20.% | 0.6% | (1.5)% | ||||
| Recession Watch Spreads | ||||||||
| U.S. 2-year 10-year Treasury spread | 0.33% | 0.46% | (6.1)% | 39.4% | ||||
| Cdn 2-year 10-year CGB spread | 0.30% | 0.65% | 1.6% | 116.7% | ||||
| Currencies | ||||||||
| US$ Index | 108.44 | 101.09 | 0.7% | (6.8)% | neutral | down | down | |
| Canadian $ | 69.49 | 0.7160 | (0.3)% | 3.0% | neutral | neutral | down | |
| Euro | 103.54 | 111.50 | (1.0)% | 7.7% | neutral | up | up | |
| Swiss Franc | 110.16 | 119.18 | (0.9)% | 8.2% | neutral | up | up | |
| British Pound | 125.11 | 132.79 | (0.2)% | 6.1% | up (weak) | up | up | |
| Japanese Yen | 63.57 | 68.55 | (0.4)% | 7.8% | neutral | up | neutral | |
| Precious Metals | ||||||||
| Gold | 2,641.00 | 3,197.11 | (4.0)% | 21.1% | neutral | up | up | |
| Silver | 29.24 | 32.25 | (1.6)% | 10.3% | down (weak) | up | up | |
| Platinum | 910.50 | 985.00 | (1.0)% | 8.2% | up | neutral | neutral | |
| Base Metals | ||||||||
| Palladium | 909.80 | 961.00 | (1.5)% | 5.6% | up | neutral | down | |
| Copper | 4.03 | 4.55 | (1.3)% | 12.9% | down (weak) | up | up | |
| Energy | ||||||||
| WTI Oil | 71.72 | 62.35 | 2.2% | (13.1)% | neutral | down | down | |
| Nat Gas | 3.63 | 3.32 | (12.4)% | (8.5)% | down | neutral | neutral | |
“Party on, Dudes!” – from Bill and Ted’s Excellent Adventure (1989)
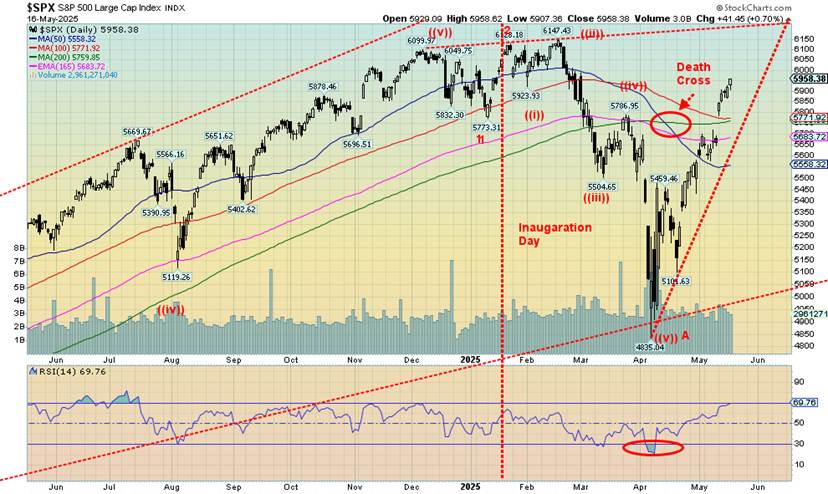
Given the rather spectacular 23%+ rise from the Liberation Day sell-off, people would not be blamed thinking this could go on and on. We are now past the point where new highs could occur. That point was at 5,850. We closed the week at 5,958. Why the sudden turnaround? It’s simple: easing of the trade wars (even if they are temporary), easing of some geopolitical tensions (i.e. Russia/Ukraine talking, sort of, U.S./Syria making up, Pakistan/India making up? Nuclear deal with Iran?) Add in an economy that is not exactly collapsing, yet despite the tariffs and thoughts of a huge tax cut (bullish for stocks) keeps the finger on the buy button. Risk on, safe havens off (gold falls). The MAG7 have led the way. Happy days are here again. Maybe.
On the week, the S&P 500 rose 5.3% and is now up 1.3% on the year, the Dow Jones Industrials (DJI) was up 3.4% and it too is now up 0.3% in 2025. The Dow Jones Transportations (DJT) was up 8.0% and the NASDAQ rose 7.2%. Both remain down on the year, but the NASDAQ only slightly. The S&P 400 (Mid) was up 4.8% and the S&P 600 (Small) gained 4.6%. Both remain down on the year. The S&P 500 Equal Weight Index rose 4.3% while the NY FANG Index was up 7.6%. Bitcoin gained a small 0.2%.
In Canada, the TSX Composite rose to new all-time highs, up 2.4%, but the TSX Venture Exchange (CDNX) fell 1.6%. In the EU, the London FTSE was up 1.5%, the EuroNext rose 2.6%, the Paris CAC 40 was up 1.9%, and the
German DAX once again rose to new all-time highs, up 1.1%. In Asia, China’s Shanghai Index (SSEC) rose 0.8%, the Tokyo Nikkei Dow (TKN) gained 0.7%, and Hong Kong’s Hang Seng (HSI) was up 2.1%. Ring the bell.
Naturally, we see some rising risks. The S&P 500 RSI is nearly at 70, indicating overbought, pauses in tariff wars could end, peace talks could fail, bond yields are rising, not falling, the Fed is on hold as data does not support a rate cut. So, we watch points below to give us clues as to whether this spectacular rally may be over. Sharp rises like this are usually not sustainable. They are more characteristic of a bear market rally that sucks everyone back in but ends badly. There is a little bit of gap there to fill between roughly 5,680 and 5,770. Filling that gap spells trouble. A breakdown under 5,550 could signal the end of the bull run. Under 5,400 and it’s confirmed over. But right now, it suggests new all-time highs lie ahead. We don’t deny it. The bullish feeling is that strong. Party on.
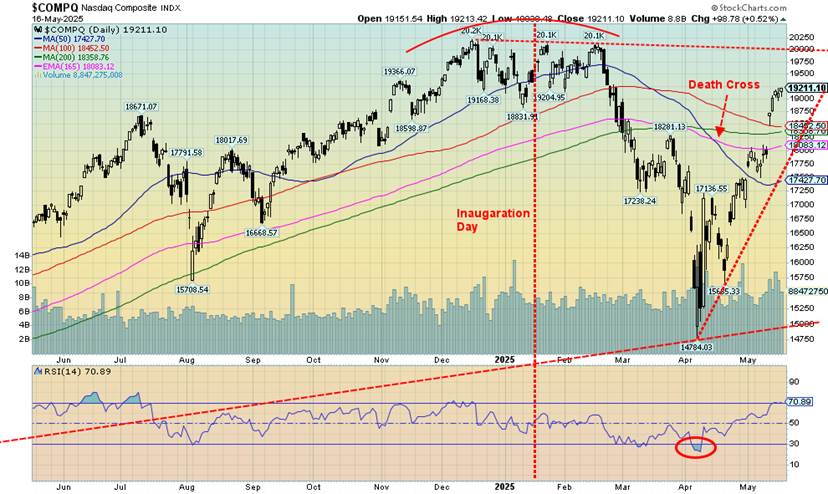
The NASDAQ enjoyed a 7.2% gain this past week. It was helped once again by the MAG7. MAGS, that represents the MAG7 was up 9.5% while the NY FANG Index gained 7.6%. But no, the NASDAQ remains well short of its all-time high seen in November 2024. Netflix was the only stock to make all-time highs, up 4.5%. Guess people are watching a lot of movies. Of the MAG7, Tesla gained 17.3% as everyone got excited about Musk returning from DOGE. Nvidia gained 16.0%. Not a MAG7 stock but Advanced Micro (AMD) was up 13.9%.
Gains were common all around and the only FANG stock we saw down was Alibaba (BABA), off 1.5%. But BABA is the best performer of the FANGs in 2025, up 45.6%. Netflix is up 33.6%. The NASDAQ has broken out above the 200-day MA. However, we note the death cross (50-day MA below the 200-day MA) remains in place. There is a nice gap to fill between roughly 18,100 and 18,500. It is enticing on any pullback. We still have a way to go get over that trendline joining the three tops (yes, a triple top—a rarity). That’s up at 20,000 while the all-time high is around 20,200. With the close at 19,211 we are now past the point that suggests new all-time highs ahead. The RSI has now gone slightly over 70 into overbought territory—a warning.
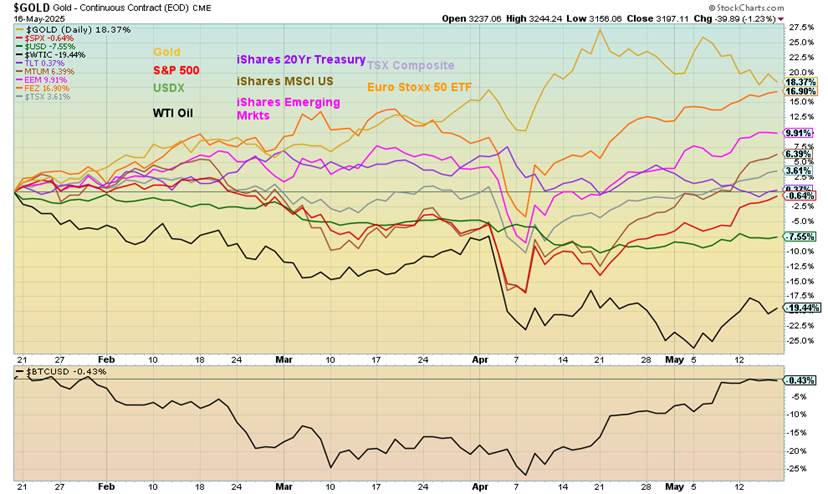
Gold is still in the lead, despite its setback this past week. Gold is up 18.4%. Steaming ahead, however, is the Euro Stoxx 50, now not that far behind gold, up 16.9%. Others that were previously underwater have now turned positive. Momentum stocks iShares MSCI US (MTUM) are up 6.4%, emerging market stocks (EEM) are up 9.9%, and the TSX Composite is up 3.6%. The 20-year treasury (TLT) has slipped positive, up 0.4% before coupons. Still underwater are oil, down 19.4% and the US$ Index, off 7.6%. Bitcoin has struggled back to break even, off 0.4%. What will next week bring?
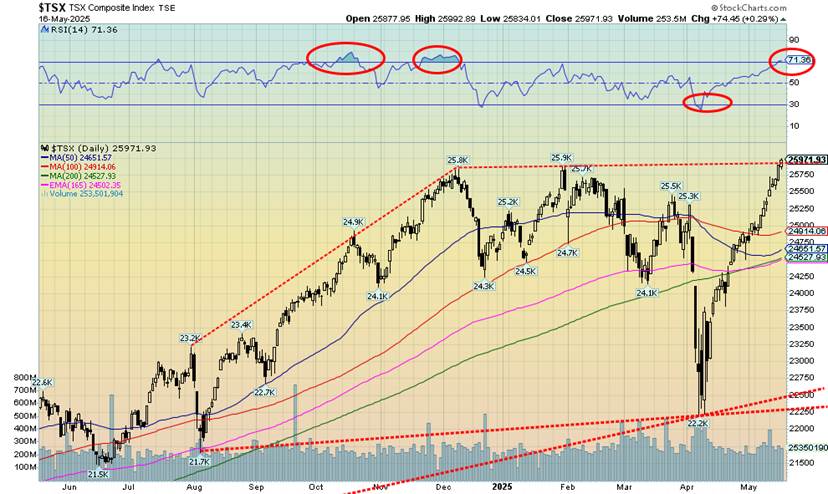
Hallelujah, the TSX Composite just made all-time highs once again. Ok barely. This past week the TSX gained only 2.4% but it was enough to push them over the top. The push was helped by the largest component Financials (TFS) that gained 3.5%. The sector that has performed the best is Golds (TGD), Metals (TGM), and Materials (TMT); however, all suffered losses this week. Despite that, Golds (TGD) remains the best performer, up 33.7% in 2025. The TSX Venture Exchange (CDNX) suffered a bit of a setback, off 1.6%. New all-time highs were recorded by others. Naturally the TSX 60 made new highs. Joining the all-time high parade besides Financials (TFS) was Industrials (TIN).
Five of the 14 sub-indices were down this past week, led by Golds (TGD), off 7.9%. Materials (TMT) fell 5.6%. Leading the gainers was Information Technology (TTK), up 8.3%. Industrials (TIN) was up 6.1% and Health Care (THC) gained 4.5%. Health Care (THC) remains the worst performer, down 23.4% in 2025. Before we get too excited about the new all-time highs for the TSX, we note the RSI has climbed into overbought territory at 71.36. No, that doesn’t mean we are about to fall back but it is a warning to be cautious from here. Given the huge pattern that has formed since November, the odds favour this being a potentially false breakout.
Given this has been a straight-up move, we know from experience these types of moves are unsustainable. The first sign of trouble is under 25,500. But we are not really over until under 24,525. The TSX could soon be begging for a correction to shake off some of this excess.
U.S. 10-year Treasury Note, Canada 10-year Bond CGB
Up is not the direction President Trump wants long-term interest rates to go. But he’s not helping them with his trade wars that ulimately could prove inflationary and put pressure on long-term rates. The trade wars could also impact the desire of U.S. treasury buyers to actually buy U.S. treasuries. The last holdout for an AAA rating on the U.S. fell this past week when Moody’s dropped their Aaa rating to Aa1, joining S&P and others with lower credit ratings below the coveted AAA rating. Fewer and fewer now have an AAA rating. However, Canada still has theirs. With the final rating agency downgrading the U.S., U.S. treasuries once considered risk free are no longer risk free.
As we have noted, China has now fallen to third place as holders of U.S. treasuries, behind both Japan and the U.K. With Moody’s dropping their rating, the cost for the U.S. to raise funds to finance their $36.9 trillion mountain of federal debt and their now seemingly annual $2.0 trillion budget deficit will go up. That’s 6.7% of GDP for the budget deficit and a debt/GDP ratio of 122.8%. It’s unsustainable. Thoughts of another tax cut are just going to make things worse. Attempts at cutting Medicare/Medicaid and Social Security are most likely a
non-starters. But given what is currently happening, they appear poised to try to cut them. Will it work? No word on cutting the $900 billion defense budget (in reality it is likely a lot higher) and one can’t cut the $1.0 trillion in interest payments without defaulting. The debt ceiling has become a joke.
This past week the 10-year U.S. Treasury note rose to 4.48% from 4.39%. It broke out over our 4.40% resistance. The Canadian 10-year Government of Canada bond (CGB) was up slightly to 3.20% from 3.18%. The 2–10 spreads were pretty steady with the U.S. at +47 bp and Canada at +65 bp.
With the drop to Aa1 from Moody’s, U.S. treasuries now carry risk. No longer risk-free.
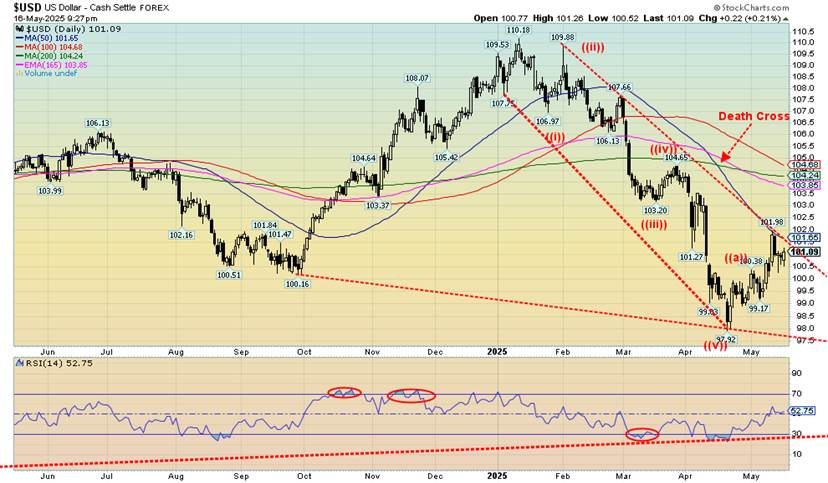
As we noted previously, the US$ Index appears to have made a temporary bottom and we are now rising. A rising US$ Index is not positive for gold prices as gold tends to move opposite to the US$ Index. We may have hit resistance of the 50-day MA, but a firm break above 102 could see us rise towards 104. Right now we need to break back under 100 and then under 99 to suggest new lows. This past week the US$ Index rose 0.7%.
The currencies were hit as the euro was down 1.0%, the Swiss franc was off 0.9%, the pound sterling was down 0.2%, and the Japanese yen down 0.4%. The Cdn$ fell about 0.3%. The RSI is neutral for the US$ Index, so in theory we have room to rise further. We appear to have fallen in five waves from that high in January 2025. If correct, this is merely a correction to that drop and not the start of a new bull. Still, a correction could take us up to major resistance near 104 before we are finished.
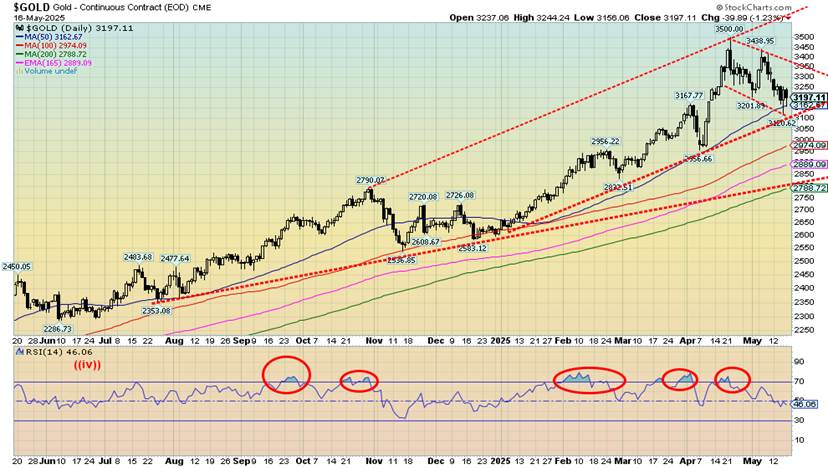
It was not a happy week for the gold bugs. Gold fell 4.0%. In a bit of a divergence silver fell only 1.6%. Platinum dropped 1.0%. The near precious metals saw palladium off 1.5% and copper down 1.3%. The gold stocks were dumped as the Gold Bugs Index (HUI) fell 8.6% and the TSX Gold Index (TGD) fell 7.9%. Despite the declines, everyone remains up in 2025.
Gold is up 21.1% and silver, which is lagging, is up 10.3%. We can’t help but note we came down from overbought levels in April when we hit the $3,500 high. If there is anything encouraging about this drop, it’s that we could be forming a bull flag. It breaks out above $3,350 and projects up to $3,730. But if we break under $3,100, we could go the other way. Below that support is around $2,950/$2,975. Long-term support is seen near $2,780.
Gold is struggling because of the pause in the trade wars (note we say “pause,” not the end of them), some still okay economic numbers, few signs yet of rising unemployment, elevated interest rates, and no signs the Fed is ready to cut interest rates any time soon. All somewhat dampening for gold prices as safe haven demand eases. Add in possible eases in tensions with an Iranian nuclear deal, Russia/Ukraine supposedly talking, and U.S./Syria making up. Still, there are military tensions between China/U.S. and now even Russia/EU.
We remain long-term bullish on gold but are currently short-term cautious. We are in a seasonally weaker period for gold. We could see a bottom this month, but more likely into June and even July before we make our bottom. After that another rise could get underway. Our preference is we hold levels near $3,100 but can’t rule out a drop to $2,950. We try to remain cool about forecasts of gold to $5,000.
Silver took a hit this past week but if we want to feel encouraged, we note that silver prices did not fall as much as gold prices. A divergence? Silver fell 1.6% vs. a 4% drop for gold. Silver stocks did poorly as Wheaton Precious Metals (WPM), the largest silver company by market cap, fell 8.2%. Nonetheless, the divergence with gold was welcomed. Arguably, we could say silver is forming a bull flag. However, we remain below that elusive $35 breakout.
We now believe we need to break above $36 to convince us we are breaking out. We still look like we could be making a rising, ascending triangle that once firmly over $36 projects up to $44. We try to ignore the crazy projections that silver will rise to $300 or even $500. Maybe they are right, but right now a breakout over $36 would be most welcome. We would like to stay above $31.25, but below that under $30.80 spells some trouble. We could fall further. That $29 support line is a way off.
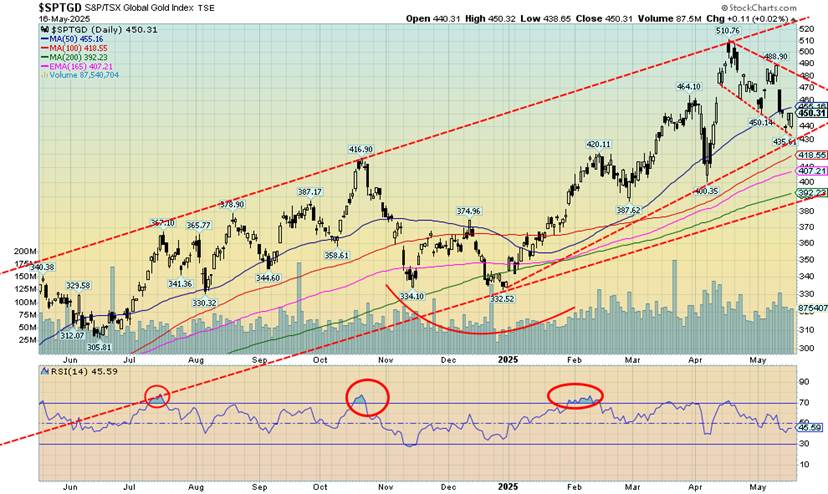
It was an ouch week for the gold stocks. Okay, they had been falling from overbought levels. We’re down almost 12% from that April high. Pullbacks within the context of a bull market are normal and healthy. We are fast approaching support for the TSX Gold Index (TGD) near 430. Are we also forming a flag formation? If so, that could be bullish if we break firmly above 480. That projects up to 556. On the week, the TGD fell 7.9% while the Gold Bugs Index (HUI) was down 8.6%. Both remain a healthy up in 2025 with the TGD still up 33.7% and the HUI up 32.8%.
We can’t help notice we are not as yet oversold so a fall to that support near 430 remains very possible. We’d prefer not to see that break as the next stop could be down to 390 and the 200-day MA. We just can’t rule it out. A move above 455 would give some hope of higher prices. We need to get above 493 to suggest new highs. We also note that March low near 400 as a possible support.
We remain longer term bullish on the gold stocks, but a pause now doesn’t hurt. Only below 380 would we have to reconsider the bull market.
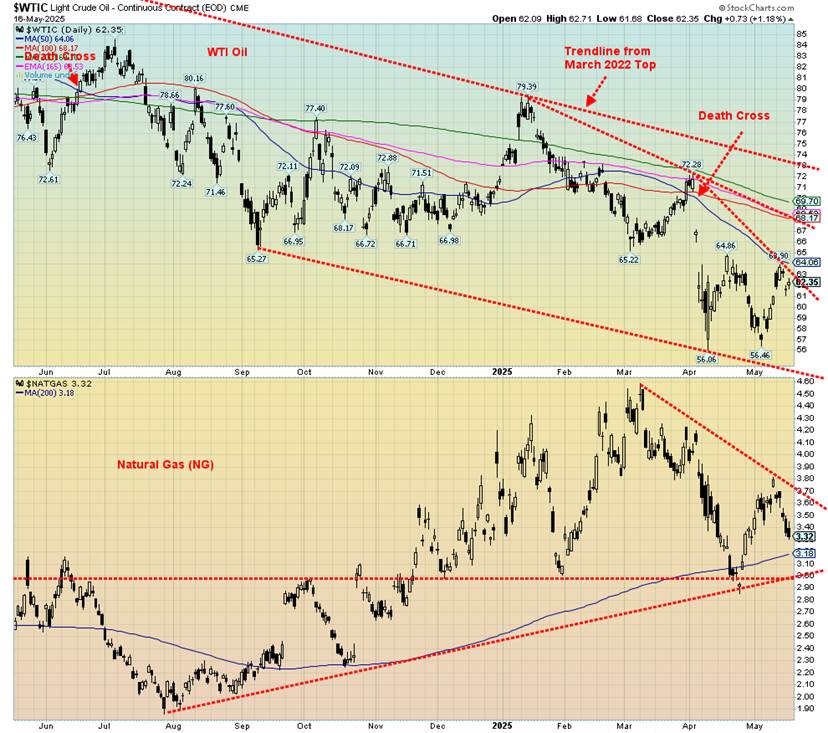
As the U.S. claims it’s inching its way towards a nuclear deal with Iran and tariffs have been eased against China (although not eliminated), oil prices managed to climb again this past week. WTI oil rose 2.2% as did Brent crude. Happy days are here again? Well, not quite. We stalled out at the falling 50-day MA. We could be forming a double bottom at $56.06 and again at $56.46, but it’s not confirmed until we firmly break above the neckline at $64. If successful, it could project up to $72.80 and just below that breakout of the downtrend line from the high of 2022. Right now, we are not holding our breath it will happen.
Besides a potential Iranian deal, the tariffs against China may be eased and there are also the talks to end the Russia/Ukraine war. Solutions to all could help spark higher oil prices. OPEC is the fly in the ointment as they are trying to bring former production cuts back on. We can’t help but notice that stocks in the U.S. for both oil and gasoline are trending near their low of the 5-year range. To bring them back near the top it would help push oil prices up. Oddly, Trump wants low oil prices and “drill, baby, drill.” You can’t have both as lower oil prices discourage investment, especially as any new oil is expensive, given all the easy oil is already found.
Natural gas (NG) is like two different stories. NG at the Henry Hub fell as demand projections fell. Seasonal maintenance at LNG export facilities also helped lower demand. No worries; hurricane season is coming. In the EU, NG at the Dutch Hub rose 1.5% because of demand increases due to cooler weather and geopolitical tensions with Russia. One up, the other down. As to the stocks, they pay more attention to oil than to NG so the ARCA Oil & Gas Index (XOI) rose 4.5% while the TSX Energy Index (TEN) was up 3.1%. Neither are out of the woods yet after earlier drops.
Oil still appears to be basing while NG is falling. Seasonally, we are coming to the end of the bullish part. It was pretty mixed to bearish. The next six months are supposedly the weak part of the cycle. Do we hear hurricanes or war to heighten things up a bit?
Copyright David Chapman 2025
__
(Featured image by Markus Winkler via Pexels)
DISCLAIMER: This article was written by a third party contributor and does not reflect the opinion of Born2Invest, its management, staff or its associates. Please review our disclaimer for more information.
This article may include forward-looking statements. These forward-looking statements generally are identified by the words “believe,” “project,” “estimate,” “become,” “plan,” “will,” and similar expressions. These forward-looking statements involve known and unknown risks as well as uncertainties, including those discussed in the following cautionary statements and elsewhere in this article and on this site. Although the Company may believe that its expectations are based on reasonable assumptions, the actual results that the Company may achieve may differ materially from any forward-looking statements, which reflect the opinions of the management of the Company only as of the date hereof. Additionally, please make sure to read these important disclosures.
David Chapman is not a registered advisory service and is not an exempt market dealer (EMD) nor a licensed financial advisor. He does not and cannot give individualised market advice. David Chapman has worked in the financial industry for over 40 years including large financial corporations, banks, and investment dealers. The information in this newsletter is intended only for informational and educational purposes. It should not be construed as an offer, a solicitation of an offer or sale of any security.
Every effort is made to provide accurate and complete information. However, we cannot guarantee that there will be no errors. We make no claims, promises or guarantees about the accuracy, completeness, or adequacy of the contents of this commentary and expressly disclaim liability for errors and omissions in the contents of this commentary. David Chapman will always use his best efforts to ensure the accuracy and timeliness of all information. The reader assumes all risk when trading in securities and David Chapman advises consulting a licensed professional financial advisor or portfolio manager such as Enriched Investing Incorporated before proceeding with any trade or idea presented in this newsletter.
David Chapman may own shares in companies mentioned in this newsletter. Before making an investment, prospective investors should review each security’s offering documents which summarize the objectives, fees, expenses and associated risks. David Chapman shares his ideas and opinions for informational and educational purposes only and expects the reader to perform due diligence before considering a position in any security. That includes consulting with your own licensed professional financial advisor such as Enriched Investing Incorporated. Performance is not guaranteed, values change frequently, and past performance may not be repeated.


TopRanked.io Weekly Affiliate Digest: What’s Hot in Affiliate Marketing [Bovada Affiliate Program]
This week, we're mashing up 80s tech with 2020s private messaging apps. Why? Because Big Tech just dropped a big...


Euro Stablecoins Struggle to Compete with Dollar Dominance in Crypto Markets
Euro stablecoins remain marginal despite the euro’s global importance, with minimal trading volume compared to dollar rivals like USDT and...


Gilead Sciences Advances Growth Strategy with Focus on HIV, Oncology, and Innovation
Gilead Sciences focuses on developing treatments for HIV, cancer, and inflammatory diseases, driven by blockbuster drugs like Biktarvy. Growth relies...


Casablanca Stock Exchange Profits Surge in 2025 as Growth Momentum Strengthens
In 2025, Casablanca Stock Exchange profits rose 40% to MAD 50.9 billion. Net income grew 22.3%, driven by strong industrial...


Credibur Scales Rapidly: €2 Billion in Structured Debt Facilities in Six Months
Infrastructure fintech Credibur has added over two billion euros in structured debt facilities within six months. Its platform connects lenders,...
 |
|
 |  |
 |
|
-

 Fintech2 weeks ago
Blockchain Adoption Accelerates as SwissChain and Amundi Launch Tokenized Financial Solutions
-

 Crypto1 week ago
Tether Seeks Big Four Audit to Boost USDT Transparency
-

 Cannabis4 days ago
Lowryder: The Autoflowering Revolution in Cannabis Cultivation
-

 Biotech2 weeks ago
SPECT-CT: Advanced Imaging for Precise Cardiac Assessment