Featured
Signals Are Mixed with Several Indicators Pointing to a Recession
The PPI came out this week and was somewhat higher than expected. The Fed made hawkish statements. Markets swooned, gold dropped, USDX and bond yields rose. But by week’s end the markets were largely unchanged as was USDX. Bitcoin soared, again. But the precious metals fell, and bond yields are creeping higher. Energy continued to be volatile as oil prices fell sharply, natural gas fell to 52-week lows.

Inflation is raging. Or so it would seem. The forecasters are having a hard time. Consensus forecasts are rarely ever bang-on, but what one watches for is the degree by which they are off. Last month’s nonfarm payrolls were way above expectations, an event that surprised the market. Markets reacted negatively. Inflation, as measured by the Consumer Price Index (CPI), is their latest bugaboo. The market expected the month-over-month (m-o-m) inflation rate to be up 0.5%. It was. So far, so good. But the year-over-year (y-o-y) inflation was expected to moderate more from last month. The December y-o-y was 6.5% and they expected 6.2% for January. Oops, no, it was 6.4%. Then out came the Producer Price Index (PPI). They expected 0.4% m-o-m but got 0.7%; they expected 5.4% y-o-y but instead got 6%. Oh yes, it was all an improvement over the previous month, but mostly it came in higher than expected and that left the markets flummoxed. Gold and stocks fell, while the U.S. dollar and bond yields rose. Not the direction they wanted.
Not helping matters were retail sales for January that came in unexpectedly up 3% m-o-m when they only expected 1.8%—although that was definitely ahead of December’s miserable negative 1.1%. Y-o-y retail sales were up 6.4% above December’s 5.9% and well above the expected 4.5%. Markets should celebrate. They didn’t. Not even the NY Empire State Manufacturing Index was spot-on; they predicted it to be negative 18, but instead, it was only negative 5.8. Economic forecasting is a hard business.
CPI, PPI, Effective Fed Funds 1969–2023
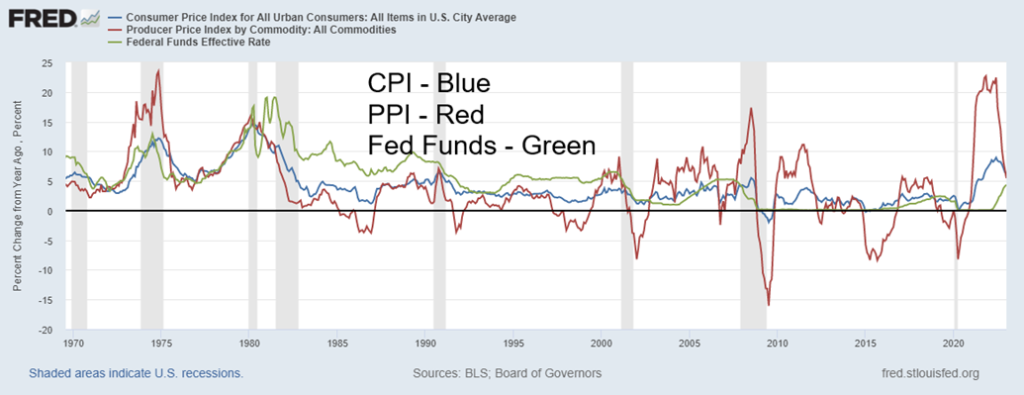
With effective Fed Funds (FF) at 4.33%, inflation last at 6.4%, and PPI at 6%, the FF remains below the inflation rates. We are reminded that in the 1970s inflation first peaked in 1974, came down sharply to a low in 1977, and then rose even higher than previously into 1980. The steep recession of 1973–1975 helped bring down the rate of inflation, but it took an even steeper recession plus Fed Chairman Paul Volcker raising FF above the rate of inflation to bring down inflation for good. Many keep wondering, will Powell do a Volcker? Given grudging evidence that inflation is coming down, will he just allow a 1974–1977 decline but pay the price later and have to raise the FF above the inflation rate? Even the Fed has a hard time forecasting.
The economy is proving to be super-resilient. Employment remains strong, there remain lots of job vacancies, retail sales in January were unexpectedly strong, and bond yields are rising, not falling (Canada reports retail sales this coming week). The U.S. has persistently high inflation, persistent labor shortages, and persistently rising debt. Since the pandemic of 2020, U.S. debt has climbed $5.9 trillion or 23%. Pandemics are not cheap. They could have done little to nothing, but then unemployment soared to over 14% in the U.S. and nearly 14% in Canada, depression levels.
And now they are bumped up against the debt ceiling which could reach crisis proportions by July if the level is not raised. The Fed is speaking more hawkishly and that has spooked the markets. But then they left rates far too low for too long before that. While there are signs of an impending recession such as the sinking leading economic indicators, a steeply negative yield curve, falling house prices, and stumbling industrial production, so far, none of this is pushing the U.S. economy into a recession. Thoughts of a mild recession at worst are dancing in the thoughts of many, including Tiff Macklem, the Governor of the BofC. It’s the Goldilocks economy—not too hot, not too cold. But inflation could remain stubbornly high. Stagflation?
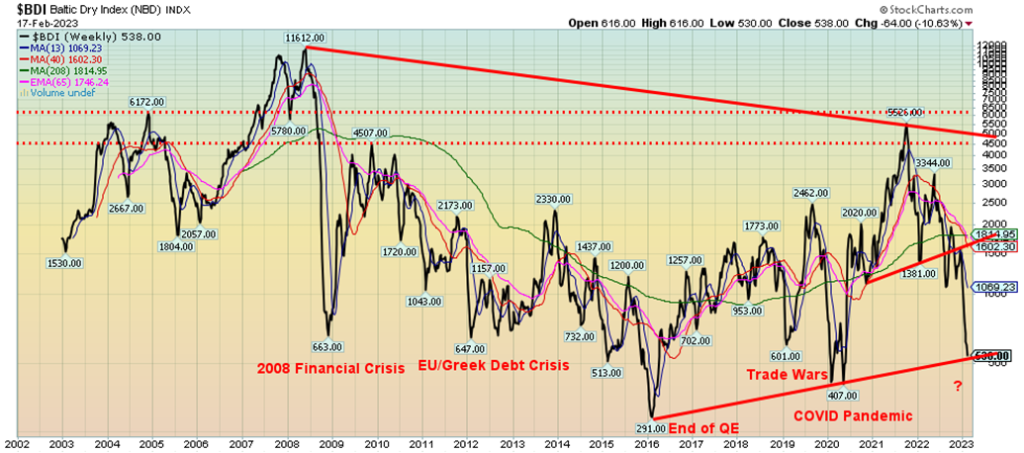
Here’s another sign of an impending recession or at least a slowdown of some significance. We’ve shown this before but since we last showed, the Baltic Dry Index (BDI) has fallen further and now threatens to break longer-term support. The BDI is a sea freight index, which measures the cost of shipping goods worldwide. We view the BDI as a measurement of globalization. If it’s rising, trade is doing well. But if it’s falling, trade may be lagging. It has been falling now for several weeks.
Baltic Dry Index 2002-2023
What is concerning with all of these numbers is that the current state of world affairs remains highly disruptive. Trying to predict where we are going economically is bad enough, but we are doing this against the background of not only highly disruptive economics but also highly disruptive geopolitics and highly disruptive
domestic politics. There is considerable debate and confusion as to whether we are headed for a global recession, a soft landing, or something in-between. The world is teetering on the edge of a potential new cold war that some believe could become a hot war. Globalization is taking a beating but not collapsing, just slowing, as the world retreats behind sanctions, embargoes, and tariffs. 1930s redux?
Domestically, we have been witnessing the rise of a vitriolic form of populism that in some instances is looking like another rise of fascism. Culture wars dominate, particularly in the U.S. where a hodgepodge of rules and polarization vary from state to state on such issues as abortion, homosexuality, transgender rights, pornography, racism, multiculturism, banning of books, and other values of morality and lifestyle. This has created a minefield for corporations, particularly for ones that operate in multiple states as well as for schools, church, and the workplace. Corporations are being forced into the cultural, social, and political wars whether they want to be involved or not. As well, there are a host of hot button items including immigration, gun control, drug legality, sexual morality, healthcare, global warming, fossil fuels vs. green fuels, and more.
All of this has resulted in increasing hostility between the different groups. Add in economic inequality. In the U.S., there are an estimated 724 billionaires and 22.7 million millionaires—all this alongside some 42.5 million living in poverty, 46.4 million depending on food stamps, and 27.2 million with no health insurance. It is said that 49% of Americans couldn’t cover a $400 expense. In Canada, the situation is better, where it is said that at least a third of the population couldn’t cover a sudden $500 expense. Canada has listed some 64 billionaires and there is an estimated 1.7 million with a net worth of $1 million or higher. On the other hand, almost 4.0 million are living in varying degrees of poverty.
If one combines all of these things it leads to failing systems, failing institutions, failing leadership, rising economic anxiety, rising social anxiety and, ultimately, rising global anxiety. The war in Ukraine is not about to go away and could spread. Global supply chains remain fractured. Witness the difficulty in getting food stuffs out of Ukraine/Russia because of the war. “Onshoring” is the new buzzword. Information is everywhere, but how much of it is true and how much of it is false? Each accuses the other side of “fake news”.
Global warming is rising and with it a host of other problems with rising seas and more people living in fire, flood, and storm zones, resulting in insurance companies refusing to insure them and governments making it more difficult to settle in those zones. No wonder the stock markets are confused and remain down some 15% (S&P 500) from their all-time highs set a year ago in January. There is little on the horizon to suggest that we are about to return to those highs anytime soon. It took the S&P 500 six years to regain its October 2007 high, but it took 25 years for the S&P 500 to regain its September 1929 high. Thirty-three years later the Tokyo Nikkei Dow is still looking to regain its January 1990 high.
Inflation remains a huge bugaboo. Inflation may be making your eggs more expensive, but in some respects governments like it. Why? It’s actually a form of taxation that results in more revenue but lowers the value of their debt as they pay it back in depreciated dollars. Money exploded as a result of the pandemic. U.S. M1 leaped $16 trillion, 300% from February 2020 to January 2022. In Canada it was the same as M1 jumped $500 billion from January 2020 to February 2022 or 45%. They also lowered interest rates to zero percent and held it there for a long time.
All that money, or at least a big chunk of it, appears to have flowed into the stock market and housing market. Now that money is being withdrawn, with the M1 down roughly $1 trillion and Canada down about $100 billion from its peaks. Combine that with rising interest rates and it is no surprise you have the stock and housing markets falling.
The central banks, particularly the Fed, are caught between a rock and hard place. Inflation is not about to come down if unemployment remains at or near record lows and labour markets are tight. Inflation is not about to come down as long as war continues in Ukraine, or as long as sanctions, embargoes, and tariffs have created supply disruptions. Food inflation is not about to come down as global warming continues to cause severe droughts in California and other parts of Western U.S., parts of Central and South America, parts of Southern Africa and Northern Africa, Eastern Europe, Central Asia, and parts of India and China. Many of them are important bread baskets.
Yet markets have bounced back this year. But is the bloom now coming off as inflation rears its ugly head and fear of rising interest rates is front and center once again? Optimism can quickly turn to pessimism.
Chart of the Week
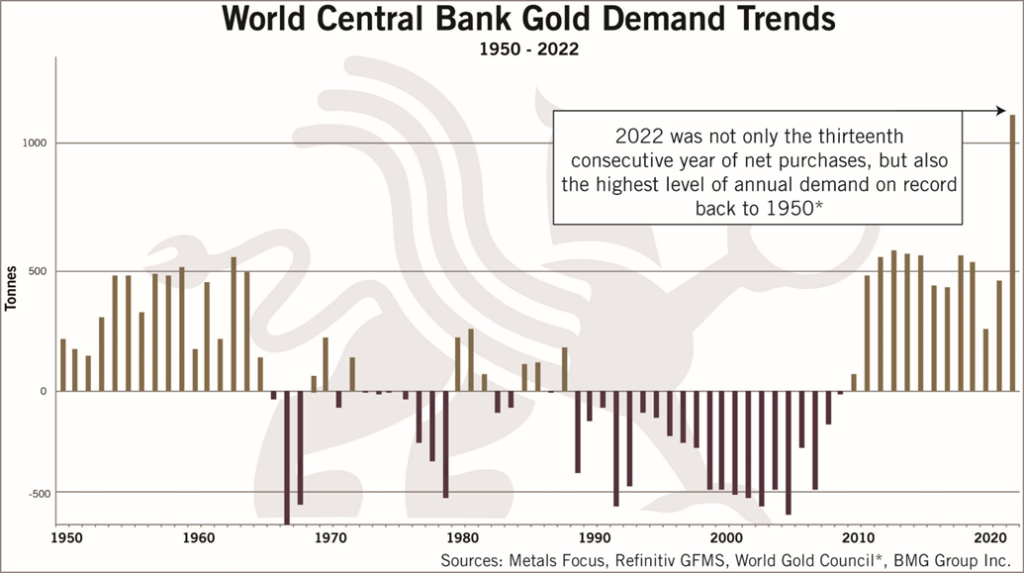
A few have published different versions of this chart recently. This one is from BMG Group (www.bmg-group.com). What this one is showing is that not only have central banks been net purchasers of gold for the past thirteen years but that purchases in 2022 were the highest on records dating back to 1950. Overall, it is the highest since 1967. So, what gives? Have central banks suddenly become gold bugs?
Hardly. Throughout the 1990s and into the 2000s, central banks were actually net sellers of gold. Grant you, they had accumulated a lot of gold during the 1950s and into the 1960s. Gold has always been a core holding of central bank reserves which, of course, are made up marketable securities, primarily treasury bills, notes, and bonds. According to the IMF (www.imf.org), central banks hold roughly $11.6 trillion of assets as of Q3 2022. Of that, 55% are held in U.S. dollars, 18% in euros, with the rest held in gold and various other currencies such as Japanese yen, Chinese yuan, pound sterling, Australian dollars, Canadian dollars, and Swiss francs.
According to the World Gold Council (www.gold.org), central banks are holding 35,494.5 metric tonnes of gold or 1,141,174,674 troy ounces, with a value at US$1,850 = US$2,111.2 billion. The number of metric tonnes held is still below the record of over 36,000+ metric tonnes held in the mid-1960s. The U.S. Federal Reserve has the world’s largest holdings of gold at 8,133.5 metric tonnes, with a value of $483.8 billion. Considering that the
value of the global stock market is over $105 trillion and the global bond market over $127 trillion, the amount of gold held by central banks is pretty low. The global gold market is only about $12.4 trillion, a global market that is pretty small by comparison. It should come as no surprise, however, that the paper gold market (futures, options, etc.) is some 200 times the size of the physical market. When we think of gold, we think of physical gold. But at the end of the day the price of gold is driven more by paper gold than by physical gold.
Many central banks were net purchasers of gold (physical, not paper) in 2022, led by Turkey. But other large purchases were seen by the central banks of China, India, Uzbekistan, Iraq, Qatar, and Egypt. A major seller was Kazakhstan. So, not everyone was buying. Some claim, we believe incorrectly, that the central banks were purchasing as they anticipated a rise in the price of gold. Some have tied it to the rise in gold price that recently soared to a high of $1,975/ounce but has since fallen precipitously to around $1,850/ounce. A more likely explanation is that central banks have been diversifying away from U.S. dollars and one of the recipients is gold. We have noted how, over the past year, foreign holdings of U.S. dollar treasury securities have fallen $458.5 billion, led by China and Japan. China has been moving away from U.S. dollar treasuries as tensions rise between the U.S. and China, but we believe Japan has been selling to support the sinking Japanese yen.
According to Basel III, gold is considered a Tier 1 asset for private banks, ranking it with banks’ common stock equity issues. The reason gold is considered a Tier 1 asset is because gold has no liability, unlike both stocks and bonds. Not that this has resulted in a surge of gold holdings by private banks, but it is noteworthy that it is considered on the same level as common stock issues.
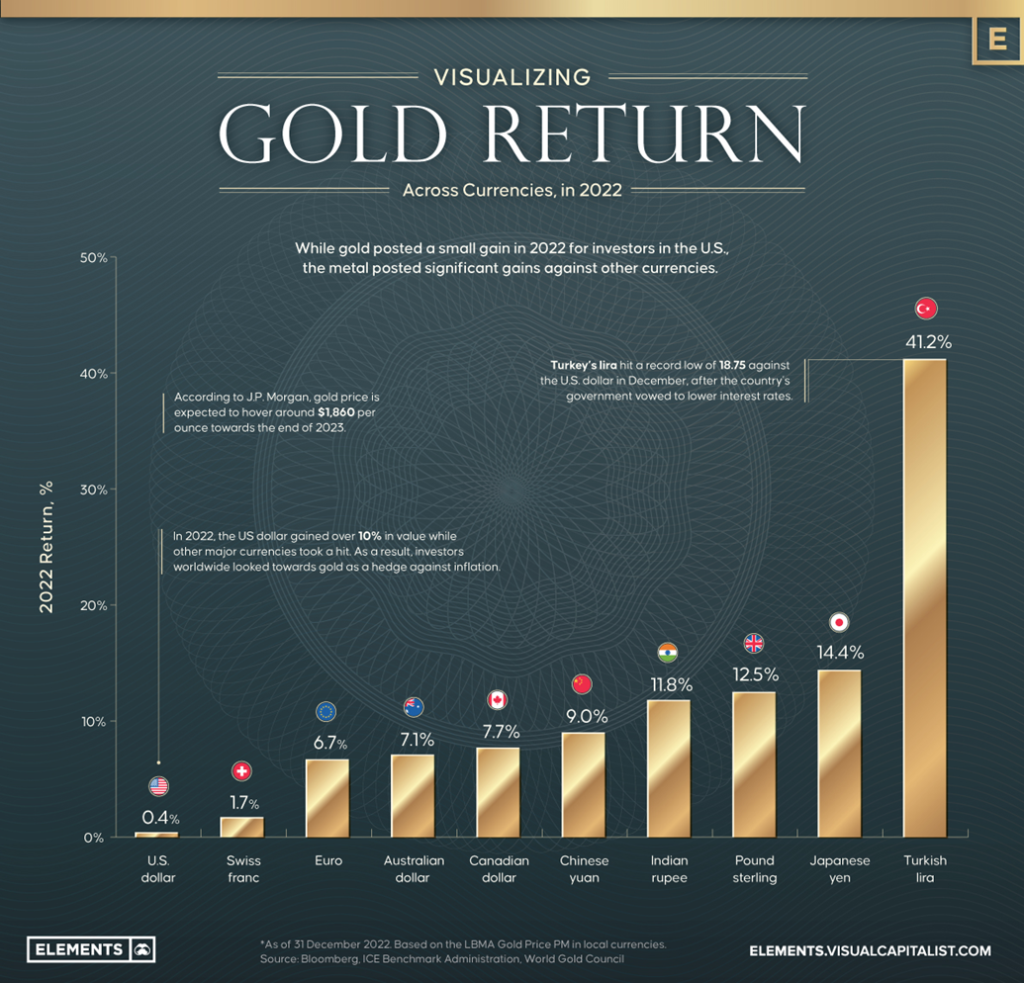
Yet despite all this, gold is considered a commodity just like any other commodity such as copper or nickel or oil. Some even call it a barbarous relic. But it remains an important component of central bank holdings and, as noted, a Tier 1 asset for private banks. Gold is also considered money and fluctuates in price, primarily in relation to the U.S. dollar, the world’s reserve currency. Over the past year, as many currencies sank in the face of a strong U.S. dollar, their currencies approached or in some cases made record highs in terms of gold. Gold, despite its deniers, remains an important asset holding, not only for central banks and private banks but for individuals as well.
Our chart on the next page shows gold in various currencies and the 2022 performance. Gold in all major currencies outperformed gold in U.S. dollars, primarily as a result of the sharp rise in the value of the U.S. dollar and the fall in numerous currencies against the U.S. dollar.
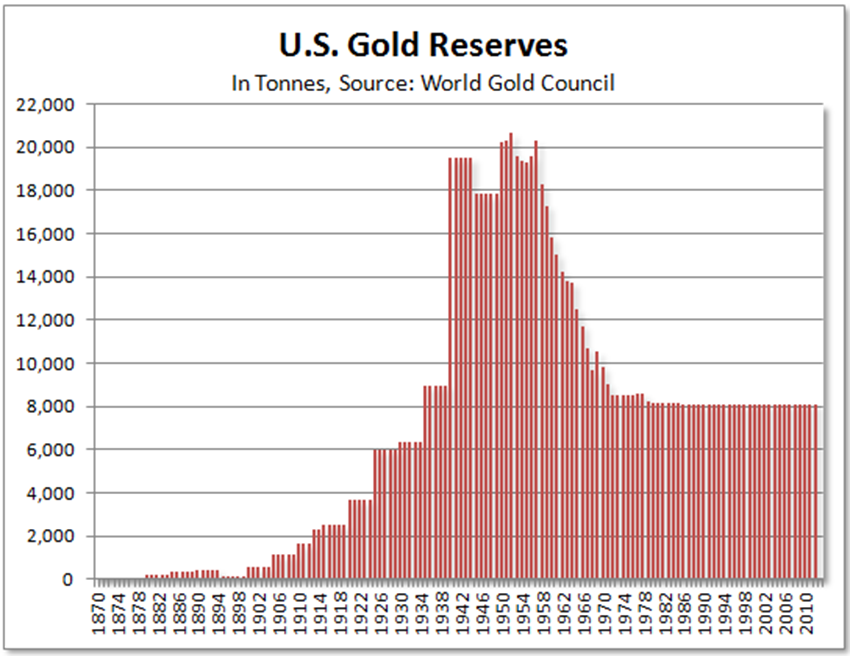
We follow that chart with another one showing the U.S. gold reserves since the mid-19th century. U.S. gold reserves peaked in the 1950s at just over 20,000 metric tonnes. After that, U.S. gold reserves fell precipitously to the current levels of 8,133.5. Why? Under Bretton Woods, the U.S. dollar was backed by gold, convertible at $35/ounce. As the U.S. was involved in the Marshall Plan to bail out Europe following World War II and the Vietnam War of the 1960s, billions of U.S. dollars were collected outside the U.S. Those countries brought the dollars back to the U.S. and demanded gold instead. The result was that U.S. gold reserves were falling rapidly and they feared they would soon be out of gold. Another large draw was coming and, in response, President Richard Nixon took the world off the gold standard in August 1971. Bretton Woods was all but dead. Charts follow.
Markets & Trends
| % Gains (Losses) Trends | ||||||||
| Close Dec 31/22 | Close Feb 17/23 | Week | YTD | Daily (Short Term) | Weekly (Intermediate) | Monthly (Long Term) | ||
| Stock Market Indices | ||||||||
| `S&P 500 | 3,839.50 | 4,079.09 | (0.3)% | 6.2% | up | up | up (weak) | |
| Dow Jones Industrials | 33,147.25 | 33,826.69 | (0.1)% | 2.1% | neutral | up | up | |
| Dow Jones Transport | 13,391.91 | 15,135.87 | 0.6% | 13.0% | up | up | up | |
| NASDAQ | 10,466.48 | 11,787.27 | 0.6% | 12.6% | up | up | neutral | |
| S&P/TSX Composite | 19,384.92 | 20,515.24 | (0.5% | 5.8% | up (weak) | up | up | |
| S&P/TSX Venture (CDNX) | 570.27 | 627.78 | 2.3% | 10.1% | up | neutral | down | |
| S&P 600 (small) | 1,157.53 | 1,282.52 | 1.3% | 10.8% | up | up | up | |
| MSCI World Index | 1,977.74 | 2,118.93 | (0.7)% | 7.1% | up | up | up (weak) | |
| Bitcoin | 16,535.23 | 24,119.78 | 11.2% | 45.9% | up | up | up | |
| Gold Mining Stock Indices | ||||||||
| Gold Bugs Index (HUI) | 229.75 | 224.36 | (4.8)% | (2.4)% | down | neutral | neutral | |
| TSX Gold Index (TGD) | 277.68 | 270.53 | (3.9)% | (2.6)% | down | up | neutral | |
| % | ||||||||
| U.S. 10-Year Treasury Bond yield | 3.88% | 3.82% | 2.1% | (1.6)% | ||||
| Cdn. 10-Year Bond CGB yield | 3.29% | 3.29% | 4.1% | flat | ||||
| Recession Watch Spreads | ||||||||
| U.S. 2-year 10-year Treasury spread | (0.55)% | (0.80)% | (1.3)% | (45.5)% | ||||
| Cdn 2-year 10-year CGB spread | (0.76)% | (0.86)% | 7.5% | (13.2)% | ||||
| Currencies | ||||||||
| US$ Index | 103.27 | 103.78 | 0.2% | 0.5% | up | down | up | |
| Canadian $ | 73.92 | 74.25 | (0.9)% | 0.5% | down (weak) | down (weak) | down | |
| Euro | 107.04 | 106.96 | 0.1% | (0.1)% | down (weak) | up | down | |
| Swiss Franc | 108.15 | 108.15 | (0.1)% | flat | neutral | up | neutral | |
| British Pound | 120.96 | 120.43 | (0.1)% | (0.4)% | down | up | down | |
| Japanese Yen | 76.27 | 74.51 | (2.1)% | (2.3)% | down | up | down | |
| Precious Metals | ||||||||
| Gold | 1,826.20 | 1850.20 | (1.3)% | 1.3% | down | up | up | |
| Silver | 24.04 | 21.72 | (1.6)% | (9.7)% | down | neutral | up (weak) | |
| Platinum | 1,082.90 | 921.40 | (3.2)% | (14.9)% | down | neutral | up | |
| Base Metals | ||||||||
| Palladium | 1,798.00 | 1,492.50 | (2.1)% | (17.0)% | down | down | down | |
| Copper | 3.81 | 4.11 | 2.3% | 7.8% | neutral | up | up (weak) | |
| Energy | ||||||||
| WTI Oil | 80.26 | 76.55 | (4.0)% | (4.6)% | down | down | up (weak) | |
| Nat Gas | 4.48 | 2.28 (new lows) | (9.2)% | (49.1)% | down | down | down (weak) | |
New highs/lows refer to new 52-week highs/lows and, in some cases, all-time highs.
The markets were mixed this past week with some up and some down. The S&P 500 lost 0.3% and the Dow Jones Industrials (DJI) was off 0.1%, but the Dow Jones Transportations (DJT) gained 0.6% as did the NASDAQ. However, the real leaders were the junior markets as the S&P 400 (Mid) gained 1.0% and the S&P 600 (Small) was up 1.3%. The small-cap leading is, we believe, a positive sign going forward. They are up 9.7% and 10.8% respectively in 2023 vs. the S&P 500 only up 6.2%. In Canada, the TSX was off 0.5% but the TSX Venture Exchange (CDNX) was up 2.3%. Again, small-cap leading is a positive development. Our only concern is the sudden revival of interest in meme stocks, which translates into a speculative market.
Overseas, the MSCI World Index was off 0.7%. In the EU, the London FTSE was up 1.7%, the EuroNext was up almost 2.0%, the Paris CAC 40 gained 3.1%, and the German DAX was up 1.1%. The EU’s strong performance was largely based on the fact that energy supplies are good, which has helped the EU weather recession storms, so far. Optimism returns despite the ongoing war in Ukraine. In Asia, China’s Shanghai Index (SSEC) lost 1.1%, the Tokyo Nikkei Dow (TKN) dropped 0.6%, and Hong Kong’s Hang Seng Index (HSI) dropped 2.2%. Europe up, Asia down, and North America mixed. Hot, cold, and just right.
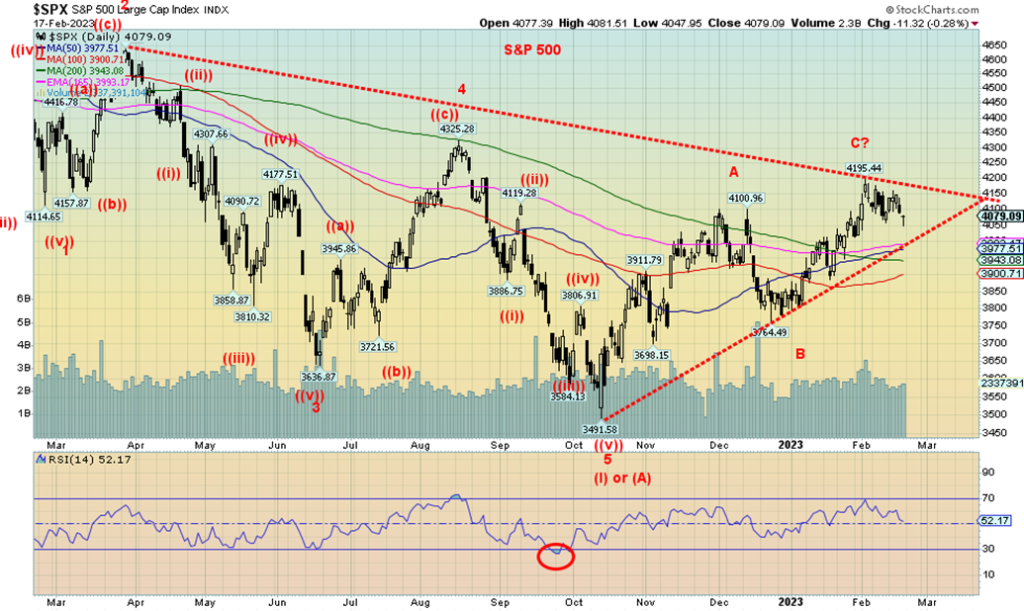
Is this correction over? Most wave counts have the S&P 500 making an ABC corrective move from the October low at 3,492 to the recent high at 4,195. If that is the case, we may have completed bigger wave 2 of a potentially larger five-wave decline. The first big wave down was low in October 2022. But are we now embarking on wave 3 down? We can’t say that yet.
We are worried about the fact that we did see divergences at the highs, particularly between the DJI and the DJT where the DJT made higher highs but the DJI did not. Secondly, we can’t believe how low yields are for corporate bonds. We have an all-time low for AAA bonds and we have the third-lowest yield ever for junk bonds (CCC). That puts the spreads between U.S. treasuries and corporate bonds at about the lowest we’ve ever seen. We are also getting a lot of speculation in the market that the Fed will soften despite last week’s hawkish concerns. Many still see the Fed at the end of rate hikes, not at the beginning. Small-cap stocks have been leading the way up, which is what we are supposed to do in a bull market. So, are we in a bull market or not?
Our trends, short, intermediate, and long remain largely up. Another positive. 2022 may have seen an important 6-year cycle low dating from the last one in 2015/2016. But bigger cycle lows are looming going forward, such as the 18-year cycle last seen in March 2009. That final low may be a few years out, but may coincide with the rarely seen 90-year cycle low last seen in 1932. Unless 2022 was it. But that would only be confirmed with new highs above 4,818. The danger is slight new highs above the previous one as we saw in 2007 when the S&P 500 made small new highs above 2002 high. The NASDAQ never did and wasn’t even close, but the DJI did go well above the 2002 high. Still, we collapsed into 2008 with the financial crisis.
The January barometer is still suggesting a positive 2023. We are in the first correction of that last up wave, but we only see real danger on a breakdown under 3,900. Confirmation would come under 3,750. New highs would end the discussion of a larger breakdown.
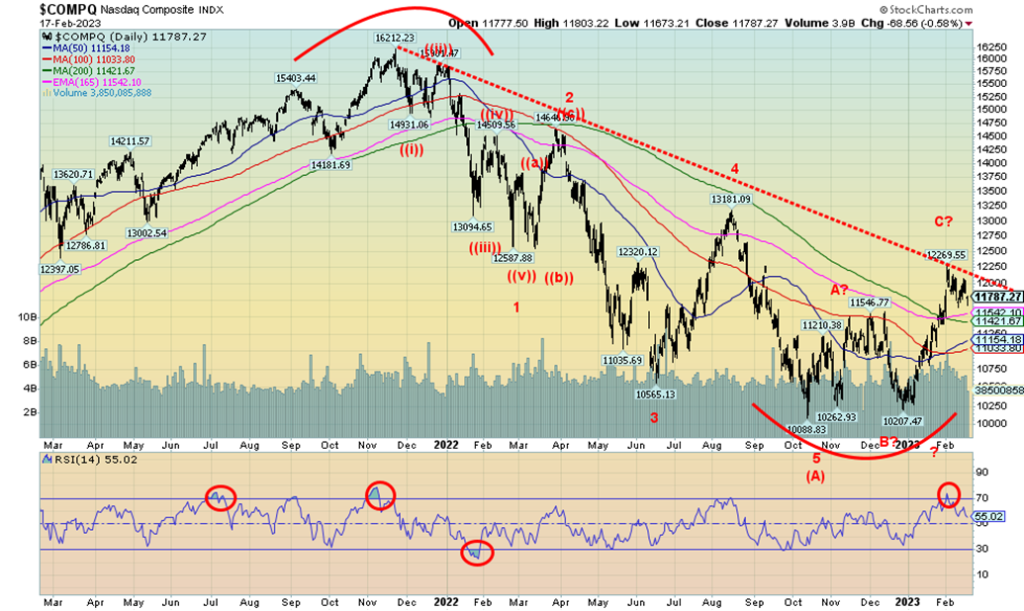
The NASDAQ surprised this past week and was actually up 0.6%. We are off 4% from the recent highs and still up 12.6% thus far in 2023, thanks to the rebound in the FAANGs. The big FAANG winner this week was Elon Musk, err, Tesla up 5.8%. The NY FANG index was actually off overall by 0.1% but remains up in 2023 by 24.5%. The big loser on the week was Microsoft, off 1.9% but still up 7.6% on the year. The NASDAQ has considerable support down to 11,400. Danger doesn’t come until we are under 11,000. So far, this looks like a normal correction after a big up move of over 20% from the December low. It has been risk on. But could an accident sideswipe the market? As we note, only under 11,000 could change this market to the downside. Under 10,750 would confirm a breakdown.
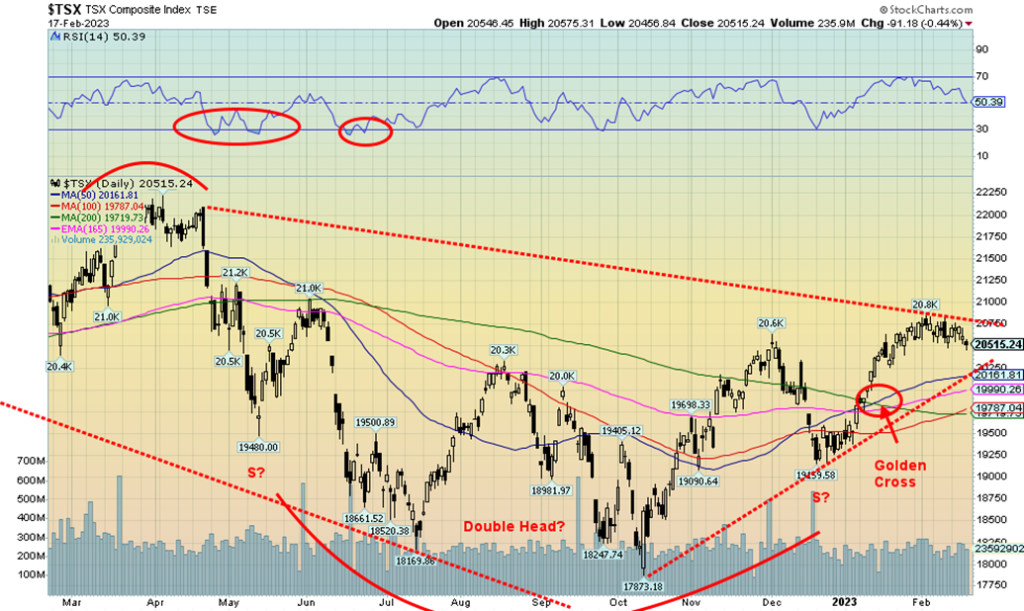
The TSX fell only a small 0.5% this past week. The TSX Venture Exchange (CDNX) continues to surprise, rising 2.3%, and is now up 10.1% on the year. Small caps leading is actually a positive sign. Of the 14 sub-indices, only five fell and nine rose. But the five falling helped bring the TSX into small negative territory. Leading the way down was Energy (TEN), down 5.7%, followed by Gold (TGD), off 3.9%. Materials (TMT) fell 2.6%. The big leader to the upside was Health Care (THC), up 11.5% and now up 18% on the year. But THC is a small component of the TSX. The really big ones like Financials (TFS) were up 0.7%. However, TFS is up 9.7% on the year. Consumer Discretionary (TCD) continues to shine, up 3.1%. Information Technology (TKK) is a big performer, up 15.4% so far this year but losing 1.6% this past week. The TSX failed just under 21,000 but, overall, the drop has not been down very much, less than 2% from the highs but still up 5.8% in 2023. We’re a long way from breaking down. That would come with a breakdown under 19,700 but would be definitive under 19,150. We’d have to get below 18,550 to suggest new lows. New highs above 21,000 would end any discussion of lower prices for the time being.
U.S. 10-year Treasury Bond/Canadian 10-year Government Bond (CGB)
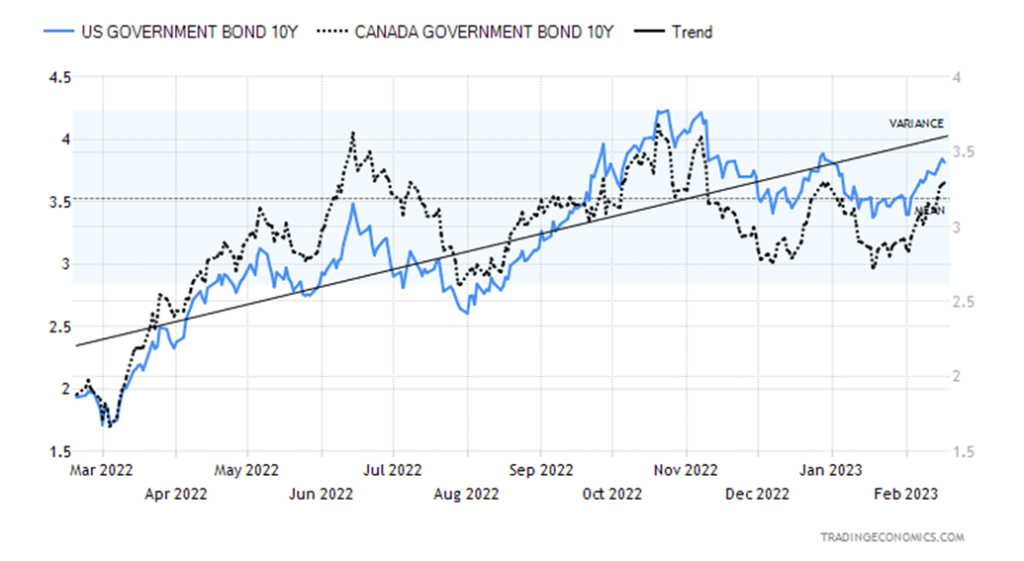
With an increasingly hawkish Fed, persistently high inflation, and a growing expectation of the Fed hiking 50 bp at its March 21–22 FOMC meeting, bond yields rose this past week. The U.S. 10-year treasury note jumped to 3.82% from 3.74% while Canada’s 10-year Government of Canada bond (CGB) was up to 3.29% from 3.16%. The negative spreads remained quite negative with the U.S.’s 2–10 spread at negative 80 bp and Canada’s 2–10 spread at negative 86 bp. Both continue to point towards a recession later this year.
This week we have the FOMC minutes of the last meeting. We’ll see if that moves any markets or just confirms the Fed’s hawkishness. The big number out is the second estimate of Q4 GDP. Expected is 2.9% vs. 3.2% with Q3. Personal Income and spending are also out, along with PCE prices and the final Michigan Consumer Sentiment expected at 66.4% vs. 64.9% last.
A move above 4% for the U.S. 10-year would be negative and we could return to the recent highs or go higher.
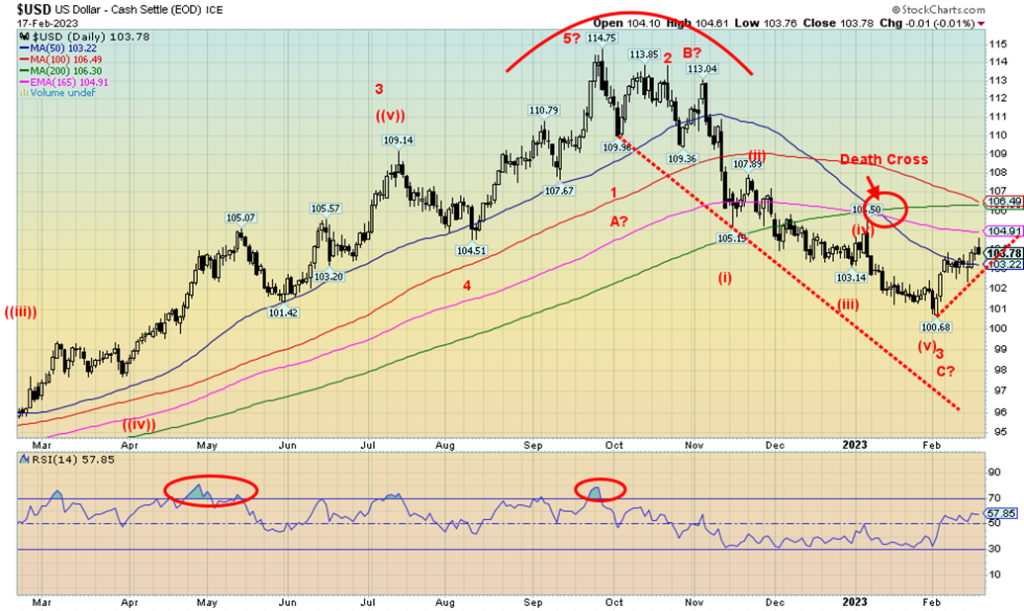
Has the US$ Index topped? Or is this merely a pause? Friday saw the US$ Index make new highs, then reverse and actually close down ever so slightly. If we continue down and break under 103 then a top might be in. We appear to have made an ABC pattern down from the September high of 114.75. But it might also be only the third wave down of a potential five-wave decline. It all depends on how one counts that decline. Elliott Wave International www.elliottwave.com is calling it a five-wave decline and now we are working on a correction to that down move.
This past week the US$ Index rose a small 0.2%. The euro gained a small 0.1%, the Swiss franc lost 0.1%, the pound sterling was off 0.1%, while the Japanese yen dropped 2.1%. The Canadian dollar lost 0.9%, thanks to the drop in oil prices.
The US$ Index does have room to move higher. With the RSI at 58, it has considerable room to move higher. The 200-day MA looms above at 106.30 and appears to be a potential target. Only a break now under 103 could suggest we’ve topped. The death cross is in play but it doesn’t mean we can’t be whipsawed.
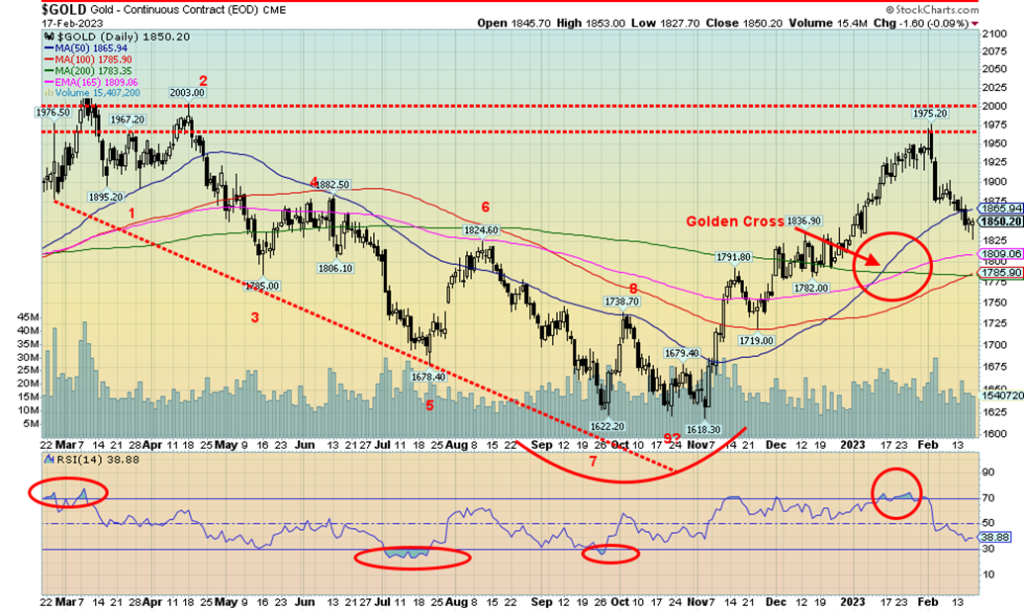
Gold continues to be pressured lower by a hawkish Fed, fears of more interest rate hikes, and a rising US$ Index. It was the third weekly decline, this time seeing gold fall 1.3%. The good news is we are still up 1.3% this year. Not so much the other precious metals and near precious metals. Silver fell 1.6%, platinum was down 3.2%, and palladium lost 2.1%. A potential bright spot and maybe a leading indicator was copper rising 2.3%. Copper is also up 7.9% on the year. The gold stocks indices suffered with the Gold Bugs Index (HUI) down 4.8% and the TSX Gold Index (TGD) off 3.9%.
One bit of bright news was that Friday saw gold open, move to new lows, and then reverse to close above the opening level of $1,845 with the close at $1,850. Meanwhile, we hit a low of $1,827. We are still above our danger points of $1,800 and especially $1,775. A breakdown under $1,775 would be negative and suggest the bull run is over. So far, with gold off only 6%+ from its highs, this looks like a normal correction. As noted, only under $1,775 would we consider this rebound over. We are a long way off from suggesting new lows as we’d have to break under $1,700 to suggest that. The RSI is only 39, not yet oversold, so we could have further downward moves. The 200-day MA is down at $1,784, hence, our concern of breaking under $1,775.
A lot hinges on how much the Fed might hike rates. The next meeting is not until March 21–22, at which time the market is now thinking that another 50 bp hike is possible. This is given sticky high inflation and a strong labor market. So far, we may have made what looks like an ABC correction, suggesting that the recent down move is corrective only. But a short rebound followed by new lows could suggest we are making a five-wave decline, which could eventually translate into new lows. Hence, a good reason to watch that $1,775 zone carefully as a break of that zone could suggest we are going lower.
The CFTC continues to experience some sort of major computer issues (hackers?), so for the third week in a row, we have no COT report.
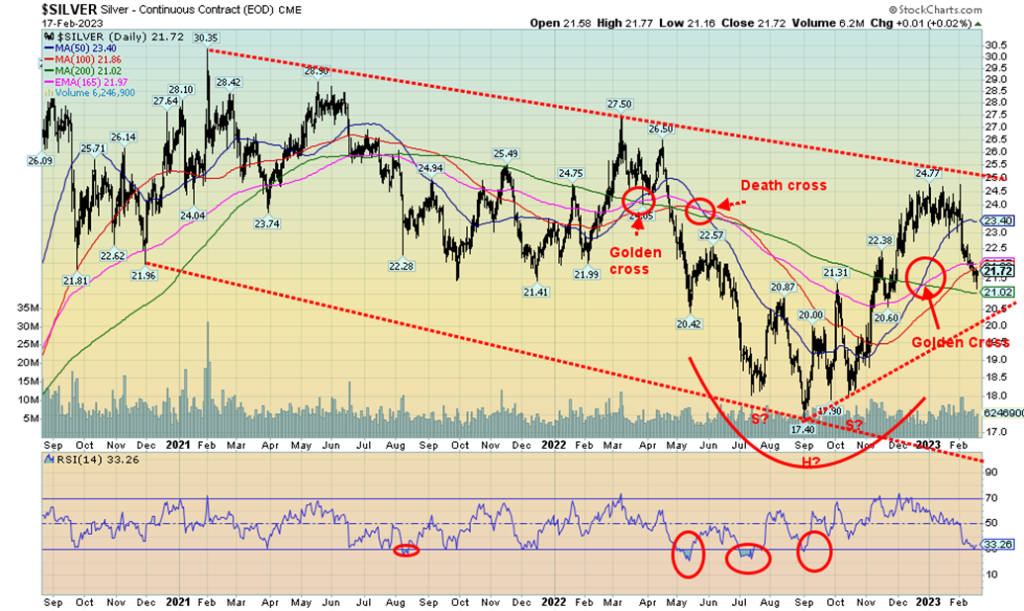
Silver prices continue their recent decline, down 1.6% this past week and now down 9.7% on the year. All this despite the golden cross seen back in December. We are now approaching oversold levels and the 200-day MA is just below at $21.02. We do have a potential target down at $20.90, so we could see some further declines first. This is despite falling to new lows for the move at Friday’s opening, then rebounding and closing up ever so slightly on the day and above the opening level. That’s a positive, but we’ll need to see follow-through this coming week to confirm the reversal. Only a move back above $22.50 could confirm that a low might be in. A firm break under $20.90 would be negative and suggest lower prices. Only below $19 are new lows possible. And only a move above $23.90 would suggest that new highs are possible. There is considerable resistance up to $23.40. Silver’s failure to make news along with gold was a warning sign that something was amiss. That happened not only on the recent up move but in the big picture as well as gold made new highs at $2,089 while silver was nowhere near its $50 high. All this against a backdrop of silver shortages and the need for silver in making clean energy and electric vehicles. That potential head and shoulders bottom hasn’t really panned out. But then, neither has it been broken. We have not achieved minimum targets of at least $25.25 according to the H&S pattern. We do see trendline support down near $20, so even if we broke under $20.90 that might contain the down move. We are approaching oversold but are not there yet, suggesting there’s room to move lower. But if Friday’s reversal was correct, then we’d expect to see some up move this coming week. As with gold, there was once again no COT report.
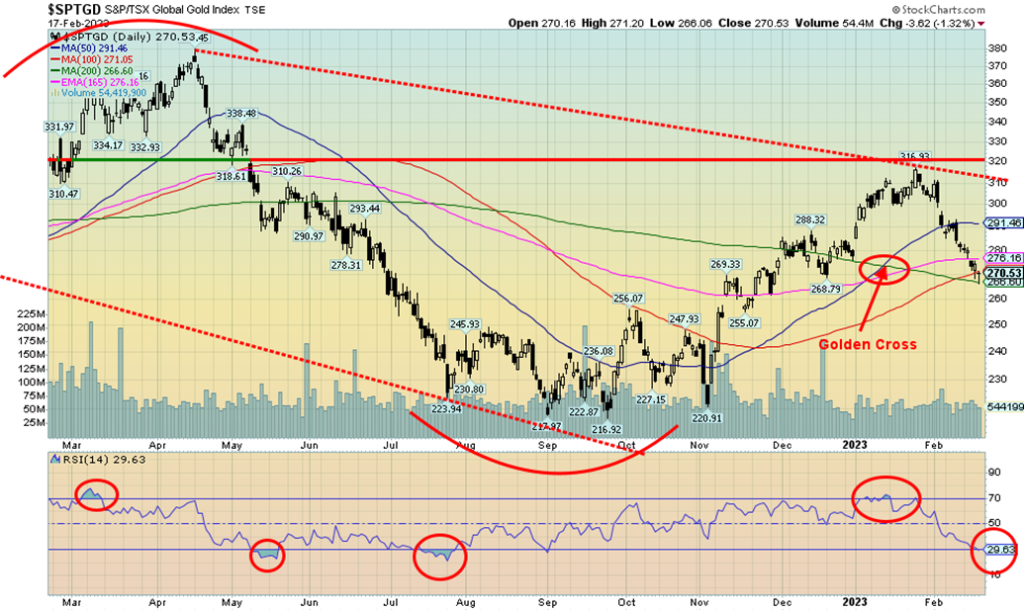
There are at least a couple of positive things we can say about the sinking gold stock market. This past week the Toronto Gold Index (TGD) fell 3.9% and the Gold Bugs Index (HUI) was down 4.8%. Another miserable week and now both are down for the year with the HUI off 2.4% and the TGD down 2.6%. One of the only positives we saw is that the TSX Venture Exchange (CDNX), with its bevy of junior gold mining and mining companies, actually rose this past week by 2.3% and is up 10.1% on the year. Junior gold miners are entrenched in the “who cares” category. Report good results and the likelihood is you’ll see your stock fall. But, overall, the CDNX is higher.
We note a few positives for the TGD. We are now in oversold territory with the RSI under 30 and we are at/near support of the 200-day MA. Also, on Friday the TGD (and HUI) opened lower, touching on the 200-day MA, and then rebounded, leaving what we call a hammer on the charts. The hammer is a Japanese candle stick pattern, only seen at lows where the market opens, falls to new lows, and then rebounds to close slightly below the open or slightly above the open. It leaves what looks like a hammer on the charts. It can be the sign of at least a temporary bottom. Naturally, we’d need to see further upside movement this coming week. The Gold Miners Bullish Percent Index (BPGDM) is at 41% and falling. It never got any higher than 55%. Not exactly at deeply overbought levels.
If the positive signs are right, we could see a rebound this coming week. But the reality is, we’d have to get over 291 to believe we’ve put in a bottom.
Energy, Oil & Gas
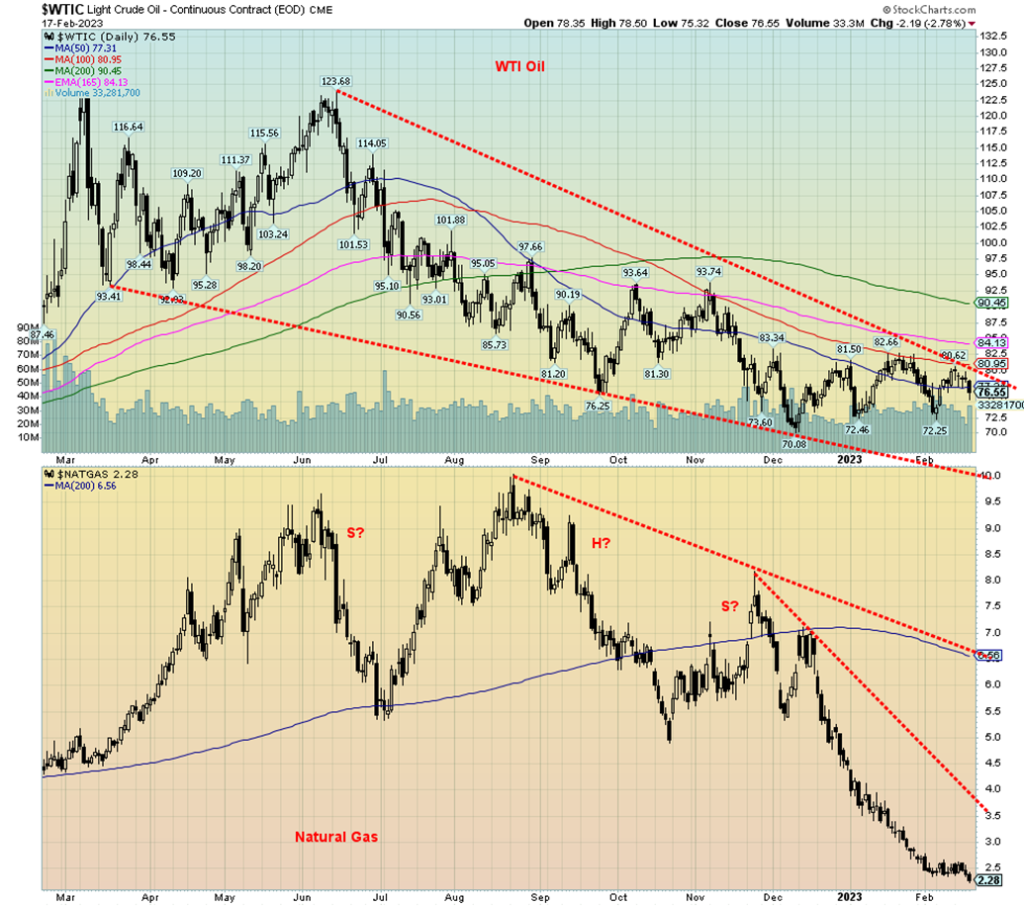
Russian production cuts? Who cares. We can only guess. Inventories in the U.S. rose sharply this past week. And the U.S. released reserves from the Special Petroleum Reserve (SPR) as well. All this helped push WTI oil down 4% this past week. And add in fear once again of rising interest rates and you had a combo that helped push WTI down. Brent crude, which the rest of the world is on, actually rose 0.9%. Natural gas (NG) fell sharply down 9.2% while NG at that Dutch Hub in the EU fell 8.6%. Both fell to new 52-week lows. Too much NG, as reserves are brimming, it’s been a mild winter, and spring is coming, if it is not already here. Result demand fell as supply rose.
The energy stocks followed WTI oil and NG south. The ARCA Oil & Gas Index (XOI) dropped 7.0% while the TSX Energy Index (TEN) was off 5.7%. They were one of the leading reasons the stock markets fell or were relatively flat this past week.
WTI oil just can’t seem to build up over $80. If we have a descending wedge on WTI oil it is getting tighter, suggesting at some point we do break out. But will we see new lows first? The bottom of that channel is down, at least to $67/$68. A firm breakout over $80 that actually holds could then see WTI rise toward $90. Once firmly over $90, higher prices would beckon. Despite having seasonal strength behind us, we are not rising. NG in particular is depressed and deeply oversold. But it can’t seem to rise as long as these gluts persist. An uptick in demand might help as China’s demand is expected to rise between 500,000–1,000,000 BPD going forward. If there is one area of shortages, it is for jet fuel and that directly impacts the cost of passenger travel.
__
(Featured image by Nicholas Capello via Unsplash)
DISCLAIMER: This article was written by a third party contributor and does not reflect the opinion of Born2Invest, its management, staff or its associates. Please review our disclaimer for more information.
This article may include forward-looking statements. These forward-looking statements generally are identified by the words “believe,” “project,” “estimate,” “become,” “plan,” “will,” and similar expressions. These forward-looking statements involve known and unknown risks as well as uncertainties, including those discussed in the following cautionary statements and elsewhere in this article and on this site. Although the Company may believe that its expectations are based on reasonable assumptions, the actual results that the Company may achieve may differ materially from any forward-looking statements, which reflect the opinions of the management of the Company only as of the date hereof. Additionally, please make sure to read these important disclosures.
Copyright David Chapman 2023
David Chapman is not a registered advisory service and is not an exempt market dealer (EMD) nor a licensed financial advisor. He does not and cannot give individualised market advice. David Chapman has worked in the financial industry for over 40 years including large financial corporations, banks, and investment dealers. The information in this newsletter is intended only for informational and educational purposes. It should not be construed as an offer, a solicitation of an offer or sale of any security. Every effort is made to provide accurate and complete information. However, we cannot guarantee that there will be no errors. We make no claims, promises or guarantees about the accuracy, completeness, or adequacy of the contents of this commentary and expressly disclaim liability for errors and omissions in the contents of this commentary. David Chapman will always use his best efforts to ensure the accuracy and timeliness of all information. The reader assumes all risk when trading in securities and David Chapman advises consulting a licensed professional financial advisor or portfolio manager such as Enriched Investing Incorporated before proceeding with any trade or idea presented in this newsletter. David Chapman may own shares in companies mentioned in this newsletter. Before making an investment, prospective investors should review each security’s offering documents which summarize the objectives, fees, expenses and associated risks. David Chapman shares his ideas and opinions for informational and educational purposes only and expects the reader to perform due diligence before considering a position in any security. That includes consulting with your own licensed professional financial advisor such as Enriched Investing Incorporated. Performance is not guaranteed, values change frequently, and past performance may not be repeated.


Morocco’s Budget Execution June 2026: Deficit Narrows to 20.2 MMDH
Morocco’s Finance Law execution at end-June 2026 shows a reduced budget deficit of 20.2 billion dirhams, down from 24.9 billion...


Tilray Brands Hits Multi-Year Lows as Cannabis Investors Await Regulatory Clarity
Tilray Brands shares have fallen 57% this year amid cannabis sector weakness and uncertainty over US regulatory reform. While potential...


Ethereum Between ETF Inflows, Price Risks and a Strong July
Ethereum faces mixed signals as ETF inflows and a strong July performance support recovery, while technical resistance and downside risks...


Mercedes-Benz Accelerates EV Decarbonization With Recycled Aluminum
Mercedes-Benz expands its partnership with Hydro to accelerate supply chain decarbonization. Future electric vehicles will use Hydro CIRCAL aluminum containing...

Evotec and BioGaia Boost Biotech, while Vitrolife Disappoints
European stocks moved on earnings and broker actions. Evotec, BioGaia, Plus500, Pharming, Inwido, Amundi and Julius Baer rallied on upgrades,...
 |
|
 |  |
 |
|
-

 Crowdfunding5 days ago
Japanese Crowdfunding Platform Ubugoe Faces Payment Crisis After Withholding Funds
-

 Impact Investing2 weeks ago
Ecobnb Turns Sustainable Tourism Into Measurable Impact
-
 Crypto2 days ago
Ethereum Between ETF Inflows, Price Risks and a Strong July
-
 Crowdfunding1 week ago
The Italian Crowdinvesting Market Faces Sharp Decline in 2026