Markets
Japan’s Economic Balancing Act: Debt, Demographics, and Inflation Pressures
Japan, the world’s fourth-largest economy, faces mounting debt with a government debt-to-GDP ratio near 260% and rising inflation. Despite strong exports, a rapidly aging population and minimal natural resources challenge growth. Interest rates lag inflation, threatening financial stability. Compared to the U.S., Japan spends more of its GDP but runs a lower—though growing—budget deficit.

Call this the U.S./Japan scorecard in six charts. We look at debt/GDP, government spending, 10-year bond/note yields, inflation, household debt to GDP, and inflation vs. the 10-year.
Japan continues to be the world’s fourth largest economy by nominal GDP. Japan also holds fourth place as measured by Purchasing Power Parity (PPP). What’s interesting about PPP (which adjusts the nominal GDP for the cost of living) is that while the U.S. is the world’s largest economy by GDP, the U.S. falls to second place behind China when measured by PPP. India rises from fifth place via nominal GDP to third under PPP while Germany, third in nominal GDP falls to fifth via PPP. It’s always worth looking at the two measurements to get a better picture.
Japan has a strong relationship between the government and its industry. In terms of technology, it is one of the most advanced countries in the world. It has a large manufacturing base and is very export-oriented. However, Japan has few natural resources and in particular when it comes to energy, they have to import almost everything. Japan also has a rapidly aging population, thanks to one of the highest life expectancy rates in the world, and coupled with a low birth rate and minimal immigration. Its median age is just shy of 50, making it the second oldest in the world, behind only Monaco. With only 16.2% of its population under the age of 20, it ranks as the third lowest in the world, ahead of only South Korea and Hong Kong.
Japan’s exports totaled $737 billion in 2023. These included cars, integrated circuits, motor vehicles and parts, semiconductor manufacturing machinery, and large construction vehicles. The primary export destinations were the United States, China, South Korea, Taiwan, and Hong Kong. Japan imported some $785 billion of goods in 2023. Japan’s imports are a mix of raw materials, fuels, and manufactured goods, largely due to its limited natural resources. Its key import partners include China, the United States, and Australia. Top import
categories include crude petroleum, petroleum gas, coal briquettes, integrated circuits, and broadcasting equipment. Japan has a small $63 billion trade surplus with the U.S. The U.S. has put a 25% tariff on Japanese goods as a part of its tariff war with the world. Trade negotiations are ongoing, assuming they are actually happening.
Government Debt to GDP Japan vs. U.S.A. 2000–2025
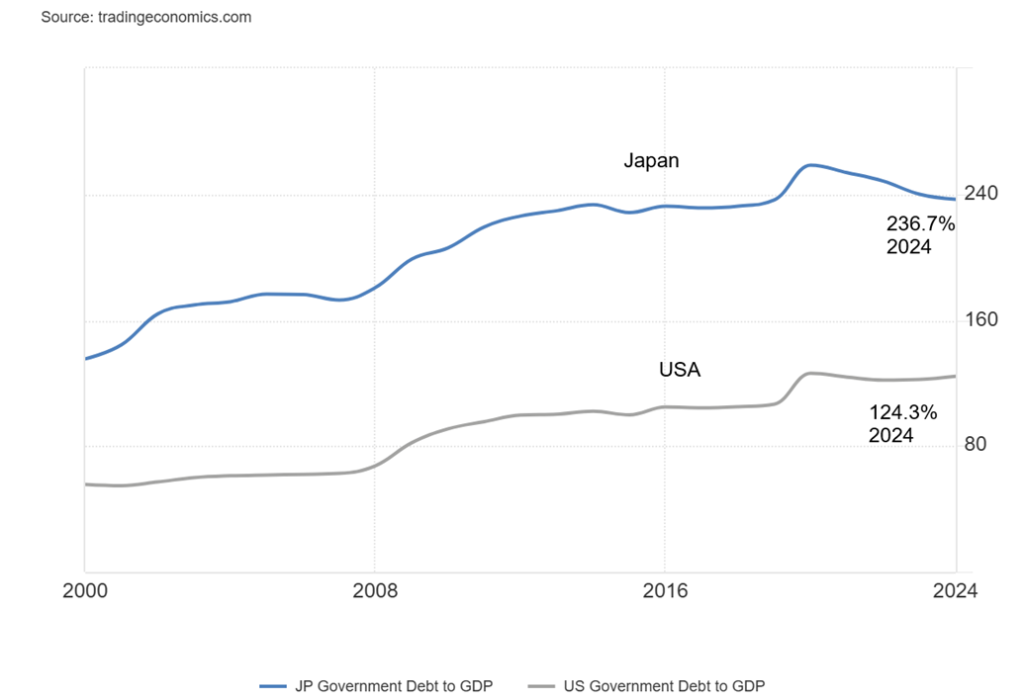
Japan has the second highest government federal debt to GDP in the world at about 237%. Only Venezuela exceeds Japan. Some have placed it around 260%. No matter how one sees it, it is astronomical. The U.S. at 124% is extremely high. In the G7, Japan ranks number one while the U.S. ranks third, with Italy in second place.
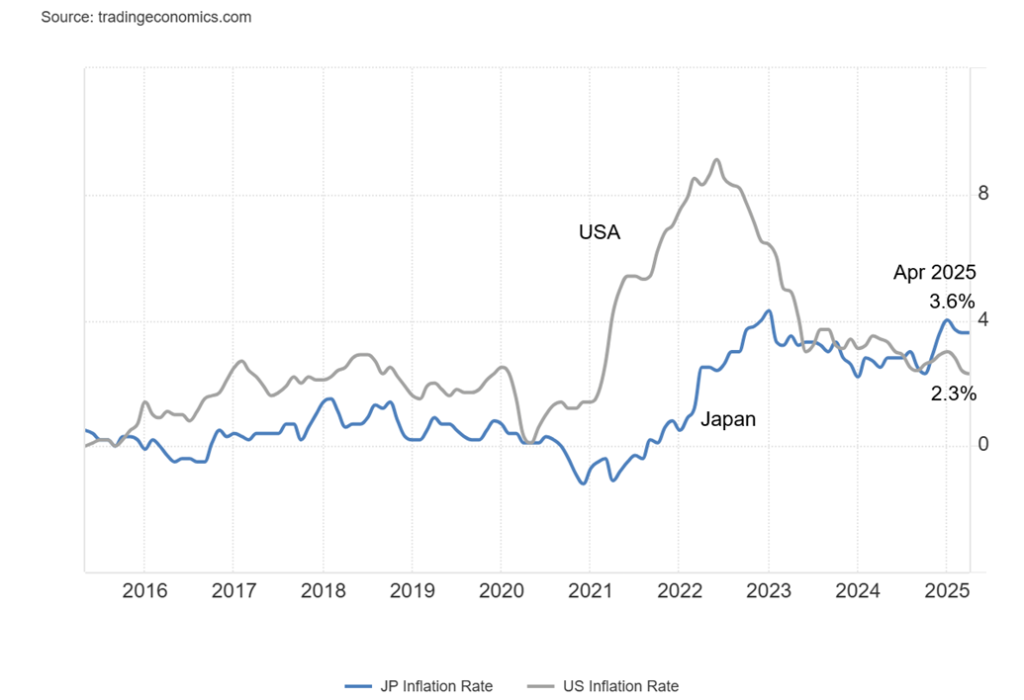
Some consider that the huge Japanese debt to GDP ratio puts the country at risk for a sovereign default especially given that its inflation is ticking up while interest rates are now well below the inflation rate, suggesting that the Bank of Japan (BOJ) will have no choice but to raise interest rates. The most recent inflation rate in Japan was 3.6% vs. the U.S. rate of 2.3%. Japan had been used to a very low inflation rate. Not anymore, it seems.
Japan’s debt problem was exacerbated by years of low inflation and ultra-low interest rates, including a period where interest rates were negative. The low interest rates allowed a massive extension of money to just about everyone, particularly during COVID.
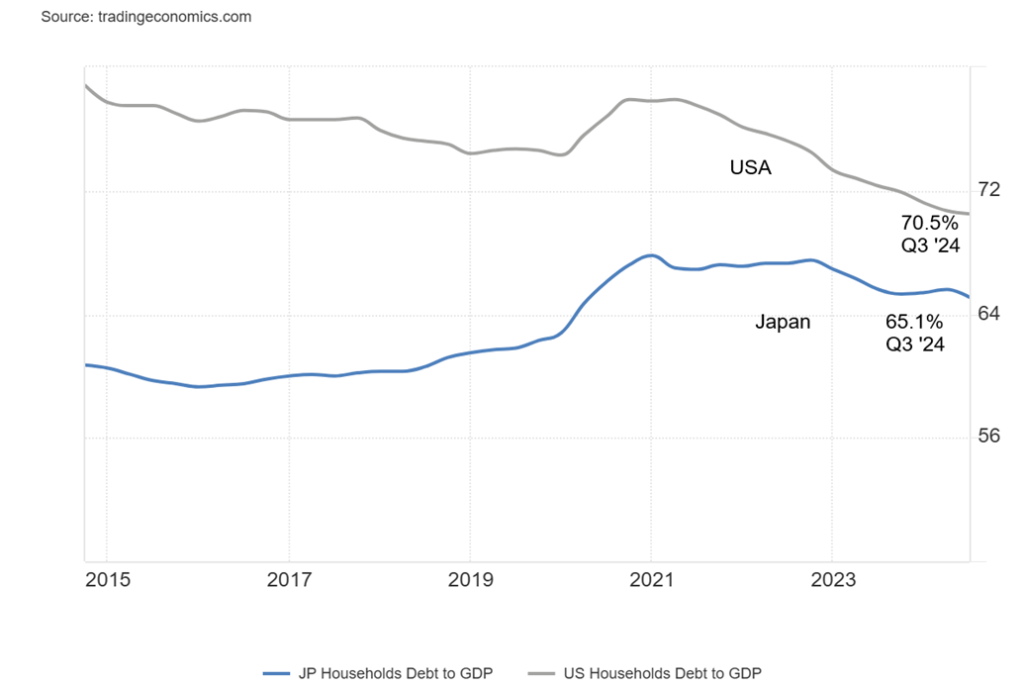
Social security for the huge senior population is a major expenditure. In total, their debt has ballooned to almost $9 trillion in a $4.2 trillion economy. And it is not just government debt as the private sector has also piled on the debt over the years, so that private debt to GDP is also astronomically high at over 250%. Consumers too are also in the game, but consumer debt to GDP at 65.1% is lower than the U.S. at 70.5%. Compared to the government and the private sector, the consumer is almost stingy.
Inflation Rate Japan vs. U.S.A. 2015–2025
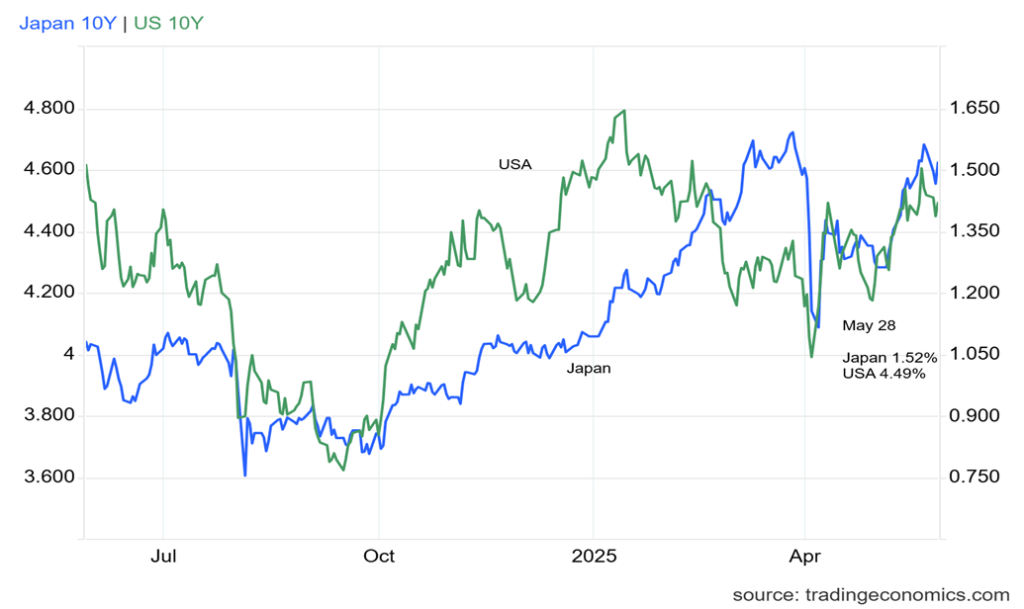
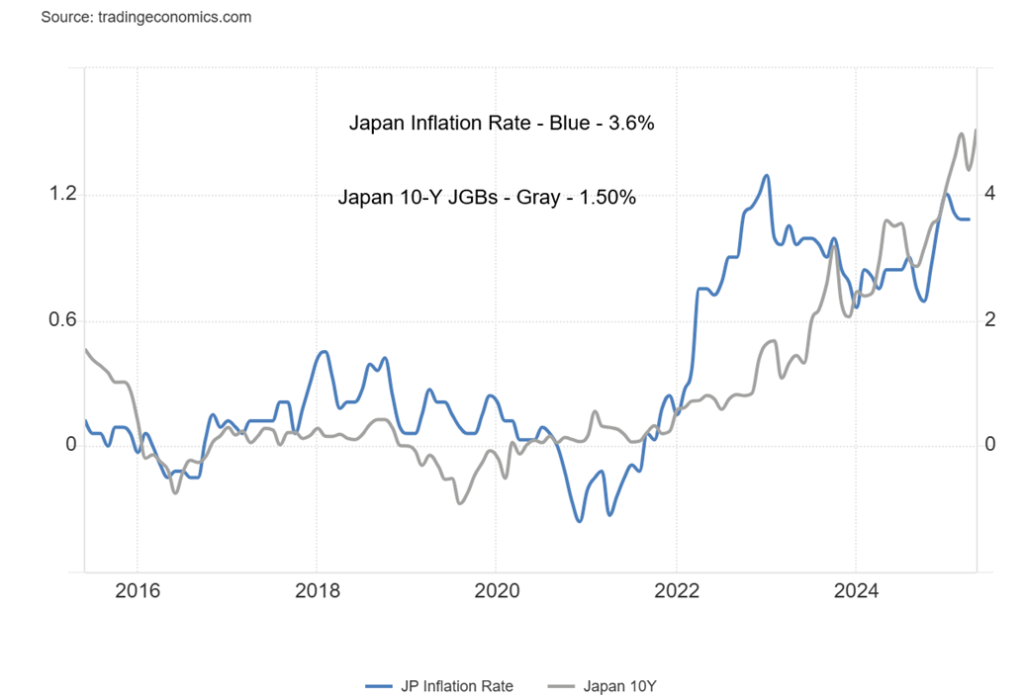
With inflation at an elevated level in Japan, it is surprising to learn that the Japanese Government Bond (JGB) 10-year is currently at 1.52%, a negative spread to inflation of 2.08%. Compare this with the U.S., where the U.S. 10-year treasury note is currently at 4.49%. With an inflation rate of 2.3%, the U.S. has a positive spread of 2.19%. Given the U.S.’s higher rate, it is more likely to attract funds than are Japanese securities.
Japan used to have an inflation rate at or near 0% and even negative for a period of time. Now inflation has soared but interest rates haven’t kept up. That is a growing problem as the high inflation rate suggests interest rates should be a lot higher. But with its astronomical debt, a hike in interest rates could bust the country.
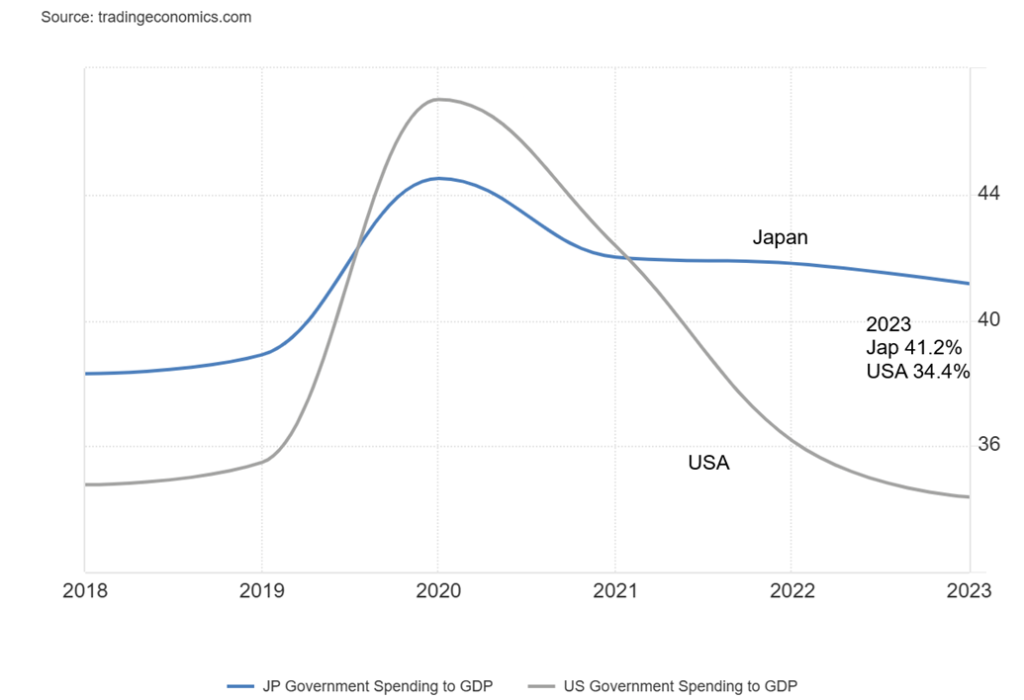
If the U.S. has a spending problem, Japan has an even bigger one. In 2023, Japan’s spending was 41.2% of GDP vs. the U.S. at 34.4%. But when it comes to the budget deficit as a percentage of GDP, the U.S. is almost in a class of its own. In 2024, the U.S. budget deficit as a percentage of GDP stood at 6.6%. Assuming the U.S.’s Big, Beautiful Bill makes it through the Senate (which is not guaranteed), that 6% plus budget deficit to GDP will persist through the rest of the decade.
On the other hand, according to The Economist, Japan’s budget deficit to GDP in 2024 was 2.3% but is expected to rise to 3.6% of GDP in 2025. However, that seemingly lower rate can be misleading as in 2022 the budget deficit to GDP was 5.5%, more on par with the U.S.
In the G7, the U.S.’s budget deficit to GDP is the highest by far. Both France and the U.K. have budget deficits to GDP around 5.5% in 2024. Spending appears to be a problem everywhere in the G7. Both Japan and Canada, with budget deficits to GDP at 2.3% in 2024, were the lowest in the G7. Nonetheless, Japan’s is rising while Canada’s is falling. Japan continues to spend more than it takes in.
U.S.A. 10-Year Treasury Note vs. Japan 10 Year JGB 2015–2025
U.S.A./Japan Government Spending as a Percentage of GDP 2018–2023
The next page is household debt to GDP. Japan’s household debt to GDP stands at 65.1% vs. the U.S. at 70.5%. The U.S.’s household debt to GDP has improved considerably since peaking way back in 2007 at just under 100%. The largest today is a surprise in that it is Switzerland at 126%. Canada stands third at 100%, but that’s down from 112% in 2020. Not only do governments have a spending problem, but it also seems that households have the same problem. Put another way, one could say they have a revenue problem.
Household Debt to GDP Japan vs. U.S.A. 2015–2025
Japan has a debt and spending problem. Interest rates that were artificially held too low for too long are overdue to rise. And that spells big trouble for the “Land of the Rising Sun.” Could Japan be at the centre of a sovereign debt crisis? Bond auctions are becoming weaker. But social security continues to grow and subsidies are almost a way of life. Protests are rising. Japan’s credit rating is A+ with a stable outlook.
Inflation is rising, interest rates are rising (10-year) but remain roughly half the inflation rate, GDP growth is sluggish at best (0.1% GDP growth in 2024), and they have a lot of debt, with the government debt to GDP the highest by far in the G7. The yen carry trade has been very popular (borrow yen, sell/buy U.S. dollars, buy U.S. treasuries) but it only works if the value of the yen stays low (it’s currently rising) and Japanese interest rates stay low (they are rising).
What could possibly go wrong? Bond markets are unforgiving. While the BOJ and the Fed control the short end of the bond market, the long end is ruled by the bond market. The U.S. has big problem with rising long-term rates, a huge debt, and massive budget deficits that need financing. Japan has a similar problem, but the bond market hasn’t yet caught up to reality. Something has to give for both.
Japan Inflation vs. JGB 10Y 2015–2025
Consumer Confidence
It seems somewhat improbable, but the most recent release of the Consumer Confidence Index from The Conference Board jumped from 85.7 in April to 98 in May. Even the Expectations Index jumped as well to 72.8, although it was below what is considered the threshold for a recession ahead at 80. The Consumer Confidence Index had fallen for five months in a row.
It seems that the yo-yo effect of tariffs on/tariffs off with China and others sparked the U.S. consumer to feel better about things. We suspect they probably shouldn’t feel so complacent. The U.S. had jacked tariffs on China as high as 145%, then abruptly lowered them to 30%. Still, that’s higher than where they were before Inauguration Day on January 20, 2025.
Shiller PE Ratio 1872–2025
By most measurements, stocks are still quite expensive. The Shiller PE Ratio sits at a lofty 36.4 when the median PE is 16.0 and the average PE is at 17.3. Even the S&P 500 PE Ratio is at 28.1 vs. a mean of 16.1 and a median of 15.1. The last time we were at levels at or below the mean and median was in 2009 during the Great Recession when it fell briefly to 14.1.
Long periods of cheap stocks were seen during the period of the 1910s and 1920s before they briefly became expensive toward the end of the 1920s. During the Great Depression and in the 1970s and 1980s a period of inflation and recessions were also periods of cheap stocks, as measured by the Shiller PE Ratio. Stocks became expensive in the 1990s, thanks to the dot.com bubble, and once again in the 2010s, thanks to the emerging AI and just-about-everything bubble. We don’t expect this situation to last for much longer. It’s overdue for a hard correction.
Tariffs On, Tariffs Off DJI 2025
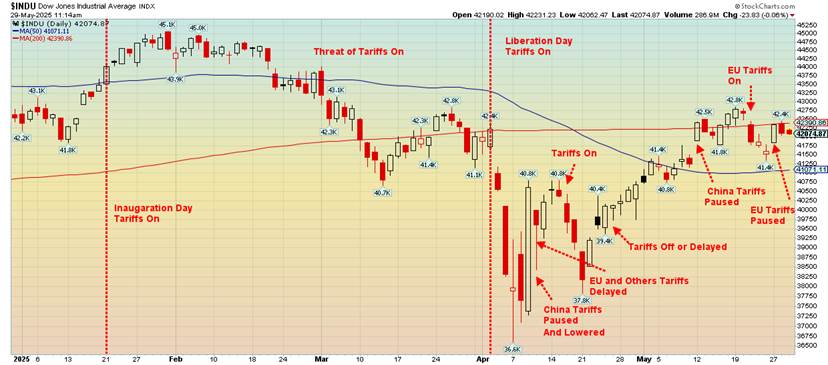
A U.S. trade court ruled that Trump exceeded his authority in ordering tariffs under the International Emergency Economic Powers Act (IEEPA). However, the ruling did not impact sector-specific tariffs for products such as steel, aluminum, and cars. At least, not until Trump hinted at hiking tariffs on steel and aluminum to 50% from 25%. That is primarily aimed at Canada. Trump has the ability to issue tariffs under other statutes. But it did give some relief, even as the Trump administration will appeal the court ruling.
Then, just like that, another court put the tariffs on hold until appeals were made. Talk about confusion. Maybe that’s why the markets yawned. They’ve seen this story before: on one day Trump puts tariffs on, then the next day they are off or paused, usually the latter. Courts rule against them, then they rule for them. Tariffs on: the market freaks and falls. Tariffs off: the market rejoices and rises. Don’t expect things to change. Inconsistency is the modus operandi. Or maybe it’s just Trump’s “Art of the Deal.”
Given how markets react to the craziness, some believe a heads-up is being given to some before any tariffs are off or pause, although there is no direct evidence for that. But the pattern of tariffs on, stocks fall/tariffs off, stocks rise is, as some would say, suspicious. Given the uncertainty these tariffs cause with the threat of a looming recession, don’t expect this to change, regardless of any court ruling. Tariffs still cause uncertainty for both business and consumers, due to the related costs, and court rulings do nothing to relieve that uncertainty. No wonder the Financial Times of London declared a new name for Trump: “TACO” or “Trump Always Chickens Out.” The late-night talk show comedians were having a good time with that one.
Update
S&P 500
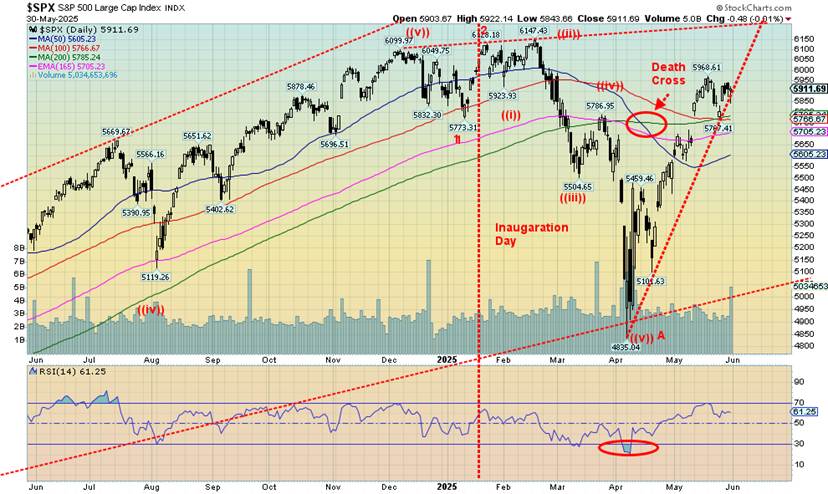
It was another chaotic week for the U.S. markets, but they did manage a gain despite everything. Not only did the week gain but May was the best-performing month since 2023 with a gain of 6.2% for the S&P 500. Nonetheless, chaos continues with the ongoing battle between the Trump administration and universities, in particular Harvard. Then, of course, there are the on-again, off-again trade wars with a court first ruling against Trump on tariffs, then another court staying the order. The wars continue and we seem no closer to solutions between Russia/Ukraine and Israel/Gaza. Sudan is regularly ignored. India and Pakistan remain at loggerheads. And tension remains between the U.S. and China in the South China Sea and the Taiwan Straits.
Elon Musk and Donald Trump are having a breakup, while Trump still rages at Fed Chair Jerome Powell to lower interest rates, and continues to threaten Canada as the 51st state. The U.S./China trade agreement is faltering. And, there’s the new nickname for Trump, TACO, which could stick around for a while.
It was a busy week for numbers, showing a weakening economy. Highlights include a House Price Index that fell 0.1% month over month (m-o-m) and was lower than expected year over year (y-o-y), up 3.7% vs. the expected 3.9%. The Consumer Confidence Index, as we’ve already noted, came in much higher than expeccted at 98 vs. the expected 87. However, the Michigan Consumer Sentiment Index was 52.2, marginally better than the expected 50.8.
Initial jobless claims were 240,000, above the expected 230,000. Is the job market starting to teeter? Next Friday brings us the May employment numbers with the nonfarm payrolls expected to be 130,000 and the unemployment rate to remain at 4.2%. Canada also reports its job numbers. Canada is looking for a gain of 7,400 jobs and for unemployment to rise to 7%. The U.S. PCE Price Index was up 2.1% y-o-y, marginally better than the expected 2.2%. That might please the Fed, but will they cut rates at their June 17-18 FOMC meeting? Probably not. The core PCE inflation (ex food and energy) was still high at 3.4%. The PCE inflation rate is the one favoured by the Fed.
Of concern was the Chicago Purchasing Managers Index (PMI) falling to a recessionary 40.5, well below last month’s 44.7 and the expected 47. Not good. The GDP growth rate for Q1 was still down 0.2% but better than the expected down 0.3%. Corporate profits fell 3.6% in Q1 (preliminary) vs. the expected gain of 5.2%. Also not good. Pending home sales fell 2.5% y-o-y, well below the expected rise of 1.9%. Jobless numbers rising, economy weak, corporate profits falling, home sales also falling.
On the week, the S&P 500 was up 1.9%, the Dow Jones Industrials (DJI) gained 1.6%, and the Dow Jones Transportations (DJT) was up 1.0%. The NASDAQ was up 2.0%. The S&P 400 (Mid) was up 0.8% while the S&P 600 (Small) was up 1.4%. In Canada, the TSX gained 1.1% once again to new all-time highs while the TSX Venture Exchange (CDNX) again made new highs up 1.1%. In the EU, the London FTSE was 0.6%, the EuroNext was up 0.6%, the Paris CAC 40 gained 0.2%, and the German DAX was up 1.6%. In Asia, China’s Shanghai Index (SSEC) was flat, the Tokyo Nikkei Dow (TKN) fell 2.2%, and Hong Kong’s Hang Seng (HSI) was down 1.3%. The MSCI World Index gained 2.0% while Bitcoin faded from that all-time high, down 3.9%.
The S&P 500 continues to cling to that uptrend line but barely. We believe it is a matter of time, when, not if it will break.
The Scorecard
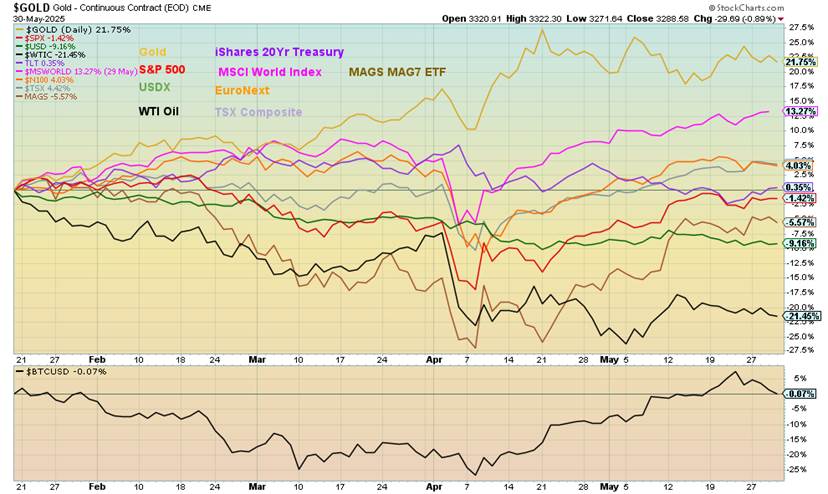
We did a few switch arounds on our Scorecard chart. The EuroNext Index replaces Stoxx Euro 50, the MSCI World Index replaces the Emerging Markets ETF (EEM), and we dropped the iShares MSCI Momentum US, replacing it with MAGS, the MAG7 ETF. All are more well known and we follow them weekly. Gold remains in the lead, up 21.8%, followed by the MSCI World Index, up 13.3%. Notably, MAGS is down 5.6% since Inauguration Day while the EuroNext is up 4.0%. Oil still drags along, the bottom down 21.5%, while Bitcoin after its big rebound is now fading, down about 0.1%.
Gold
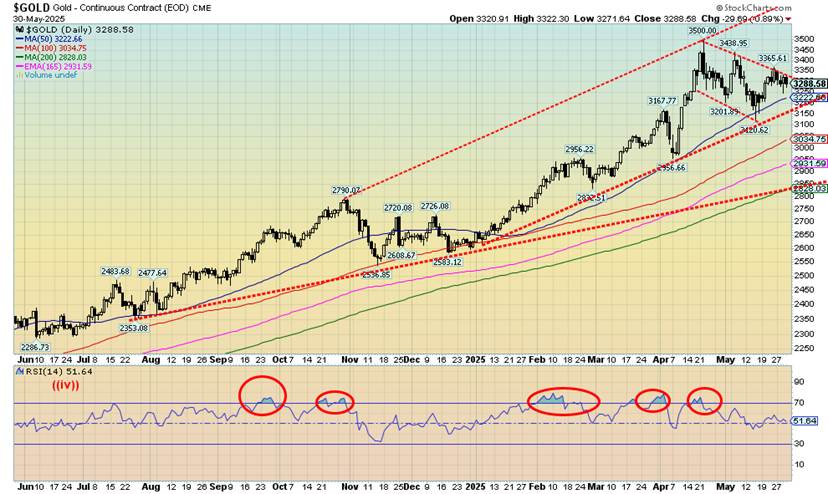
Gold continues its corrective mode. Two things are contributing to our positive thoughts that this is temporary. First, we continue to form what looks to us as a bull flag. Naturally, we await a breakout, preferably over $3,400 as that would suggest to us new highs ahead over $3,500. We need, of course, to hold the downside currently near $3,100. Second, despite the corrective period, both silver and gold stocks are holding in.
Gold dropped in total 10.8% thus far from the $3,500 top. But silver fell only 6%, while the gold stocks, as represented by the Gold Bugs Index (HUI), fell 14.9% from its recent top while the TSX Gold Index (TGD) fell 14.7%. All have since rebounded with gold up 5.3%, silver up 4.2%, the HUI up 12.4% and the TGD up 10.0% from their recent lows.
It wasn’t a stellar week for the precious metals. Gold fell 2.0%, silver was off 1.6%, while platinum fell 3.4%. The gold stocks had an off week with the Gold Bugs Index (HUI) up a small 0.1% while the TSX Gold Index (TGD) was off 0.3%. Gold stocks faring better? View that as positive. As for other metals, palladium was down 3.3% and copper down 3.3%. For the record, elsewhere oil continues to be weak with WTI oil down 1.4%, Brent off 3.3%, natural gas (NG) at the Henry Hub up 4.4% and NG at the EU Dutch Hub down 7.3%. The Arca Oil & Gas Index (XOI) was down 0.1% while the TSX Energy Index (TEN) was down 1.6%.
However, our focus continues on gold, the best-performing major asset in 2025 and the best performer since 2000. Yet gold, particularly in North America, remains under-owned and the junior gold mining stocks that dominate on the TSX Venture Exchange (CDNX) also remain grossly under-owned and ultra cheap, despite very good specs in quite a number of cases. That’s why we believe the best is yet to come in the precious metals market. A blow-off phase?
As noted, we are buoyed by what appears to us as a bull flag on gold and an ascending triangle forming on silver. Both patterns are ultimately bullish, but we await a breakout over $3,500 for gold and above $36 for silver. The gold stocks would no doubt follow, if not lead.
Given the chaos and volatility, we noted in our annual forecast gold (and silver and gold stocks) remain our number one pick for 2025. So far, we haven’t been disappointed. As we have so often said, gold is what you want in times of geopolitical uncertainty, economic uncertainty, and loss of faith in government. We have all three.
Markets & Trends
| % Gains (Losses) Trends | ||||||||
| Close Dec 31/24 | Close May 30/25 | Week | YTD | Daily (Short Term) | Weekly (Intermediate) | Monthly (Long Term) | ||
| ne | ||||||||
| S&P 500 | 5,881.63 | 5,911.69 | 1.9% | 0.5% | up | up (weak) | up | |
| Dow Jones Industrials | 42,544.22 | 42,270.07 | 1.6% | (0.6)% | up | neutral | up | |
| Dow Jones Transport | 16,030.66 | 14,686.30 | 1.0% | (7.6)% | up | down | down | |
| NASDAQ | 19,310.79 | 19,113.77 | 2.0% | (1.0)% | up | up (weak) | up (weak) | |
| S&P/TSX Composite | 24,796.40 | 26,175.05 (new highs) * | 1.1% | 5.6% | up | up | up | |
| S&P/TSX Venture (CDNX) | 597.87 | 694.40 (new highs) | 1.1% | 16.2% | up | up | up | |
| S&P 600 (small) | 1,408.17 | 1,284.30 | 1.4% | (8.8)% | up | down | neutral | |
| MSCI World | 2,304.50 | 2,639.08 (new highs) * | 2.0% | 14.5% | up | up | up | |
| Bitcoin | 93,467.13 | 104,510.30 | (3.9)% | 11.8% | up (weak) | up | up | |
| Gold Mining Stock Indices | ||||||||
| Gold Bugs Index (HUI) | 275.58 | 398.17 | 0.1% | 44.5% | up | up | up | |
| TSX Gold Index (TGD) | 336.87 | 479.39 | (0.3)% | 42.3% | up | up | up | |
| % | ||||||||
| U.S. 10-Year Treasury Bond yield | 4.58% | 4.40% | (2.7)% | (3.9)% | ||||
| Cdn. 10-Year Bond CGB yield | 3.25% | 3.20% | (4.5)% | (1.5)% | ||||
| Recession Watch Spreads | ||||||||
| U.S. 2-year 10-year Treasury spread | 0.33% | 0.49% | (10.9)% | 48.5% | ||||
| Cdn 2-year 10-year CGB spread | 0.30% | 0.61% | (6.2)% | 103.3% | ||||
| Currencies | ||||||||
| US$ Index | 108.44 | 99.38 | 0.3% | (8.4)% | down | down | down | |
| Canadian $ | 69.49 | 0.7284 | flat | 4.8% | up | up | down | |
| Euro | 103.54 | 113.53 | (0.1)% | 9.7% | up | up | up | |
| Swiss Franc | 110.16 | 121.49 | (0.3)% | 10.3% | up | up | up | |
| British Pound | 125.11 | 134.69 | (0.5)% | 7.7% | up | up | up | |
| Japanese Yen | 63.57 | 69.46 | (1.0)% | 9.3% | neutral | up | neutral | |
| Precious Metals | ||||||||
| Gold | 2,641.00 | 3,293.09 | (2.0)% | 24.7% | up | up | up | |
| Silver | 29.24 | 32.98 | (1.6)% | 12.8% | up | up | up | |
| Platinum | 910.50 | 1,048.00 | (3.4)% | 15.1% | up | up | up | |
| Base Metals | ||||||||
| Palladium | 909.80 | 962.50 | (3.3)% | 5.8% | up (weak) | up (weak) | down | |
| Copper | 4.03 | 4.67 | (3.3)% | 15.9% | neutral | up | up | |
| Energy | ||||||||
| WTI Oil | 71.72 | 60.86 | (1.4)% | (15.1)% | down (weak) | down | down | |
| Nat Gas | 3.63 | 3.46 | 4.5% | (4.7)% | neutral | neutral | neutral | |
Copyright David Chapman
__
(Featured image by Jason Lin via Unsplash)
DISCLAIMER: This article was written by a third party contributor and does not reflect the opinion of Born2Invest, its management, staff or its associates. Please review our disclaimer for more information.
This article may include forward-looking statements. These forward-looking statements generally are identified by the words “believe,” “project,” “estimate,” “become,” “plan,” “will,” and similar expressions. These forward-looking statements involve known and unknown risks as well as uncertainties, including those discussed in the following cautionary statements and elsewhere in this article and on this site. Although the Company may believe that its expectations are based on reasonable assumptions, the actual results that the Company may achieve may differ materially from any forward-looking statements, which reflect the opinions of the management of the Company only as of the date hereof. Additionally, please make sure to read these important disclosures.
David Chapman is not a registered advisory service and is not an exempt market dealer (EMD) nor a licensed financial advisor. He does not and cannot give individualised market advice. David Chapman has worked in the financial industry for over 40 years including large financial corporations, banks, and investment dealers. The information in this newsletter is intended only for informational and educational purposes. It should not be construed as an offer, a solicitation of an offer or sale of any security.
Every effort is made to provide accurate and complete information. However, we cannot guarantee that there will be no errors. We make no claims, promises or guarantees about the accuracy, completeness, or adequacy of the contents of this commentary and expressly disclaim liability for errors and omissions in the contents of this commentary. David Chapman will always use his best efforts to ensure the accuracy and timeliness of all information. The reader assumes all risk when trading in securities and David Chapman advises consulting a licensed professional financial advisor or portfolio manager such as Enriched Investing Incorporated before proceeding with any trade or idea presented in this newsletter.
David Chapman may own shares in companies mentioned in this newsletter. Before making an investment, prospective investors should review each security’s offering documents which summarize the objectives, fees, expenses and associated risks. David Chapman shares his ideas and opinions for informational and educational purposes only and expects the reader to perform due diligence before considering a position in any security. That includes consulting with your own licensed professional financial advisor such as Enriched Investing Incorporated. Performance is not guaranteed, values change frequently, and past performance may not be repeated.


Vexuvo Secures €7.4M to Boost Agrivoltaic and Storage Growth
Vexuvo and the Sella Group have reached 7.4 million euros in total funding to support renewable energy growth. A new...


CAR-T Cell Therapy Induces Remarkable Remission in Patient with Multiple Autoimmune Diseases
A 47-year-old woman with three severe autoimmune diseases received CAR-T cell therapy at a German hospital, achieving one-year remission without...


Markets Rebound Briefly as War Risks and Inflation Persist
Artemis II’s safe return contrasted with failed peace talks, ending hopes of a sustained ceasefire. Markets briefly rallied on optimism,...

Dow Jones Near Highs Amid Low Volatility but Caution Signals Emerging
The Dow Jones recently closed near record highs after only a mild 10% correction, suggesting market strength. However, a few...


The TopRanked.io Weekly Digest: What’s Hot in Affiliate Marketing [LiveChat Affiliates Review]
Quick Disclosure: We’re about to tell you how LiveChat Affiliates run a top-notch affiliate program. And we really mean it....
 |
|
 |  |
 |
|
-
 Business1 week ago
TopRanked.io Weekly Affiliate Digest: What’s Hot in Affiliate Marketing [Bovada Affiliate Program]
-

 Crowdfunding5 days ago
ECSP Crowdfunding vs. eWpG Bonds: Overcoming SME Financing Limits
-
 Fintech2 weeks ago
Crypto Lending Hits $30 Billion, Becomes Key DeFi Pillar
-
 Markets9 hours ago
Markets Rebound Briefly as War Risks and Inflation Persist