Business
Why a look at China is a prudent thing to do now
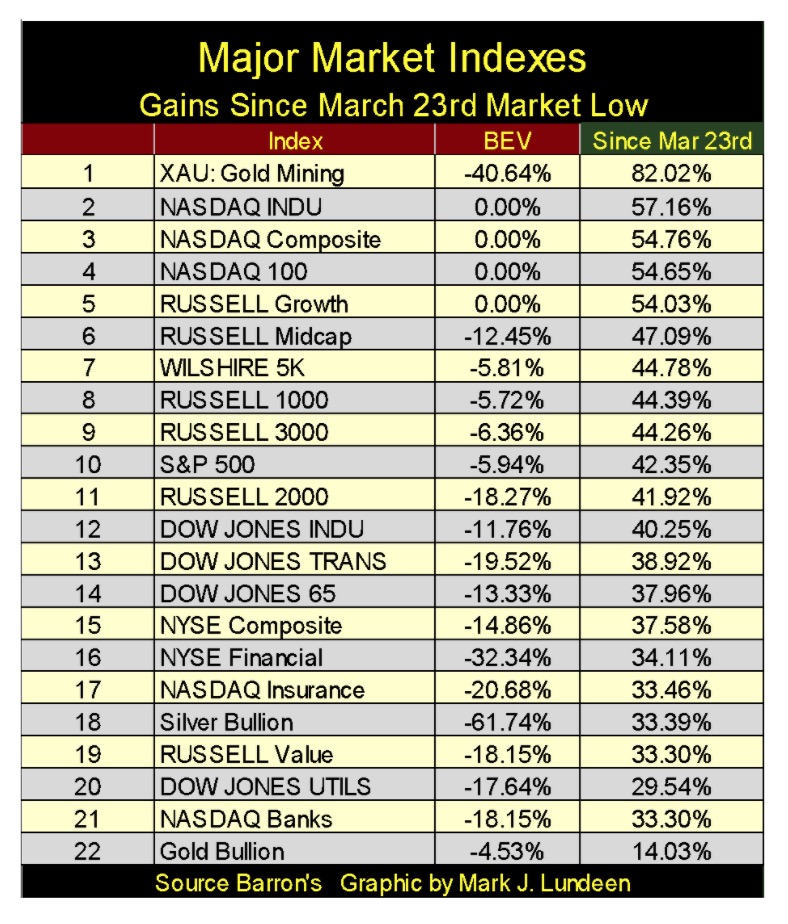
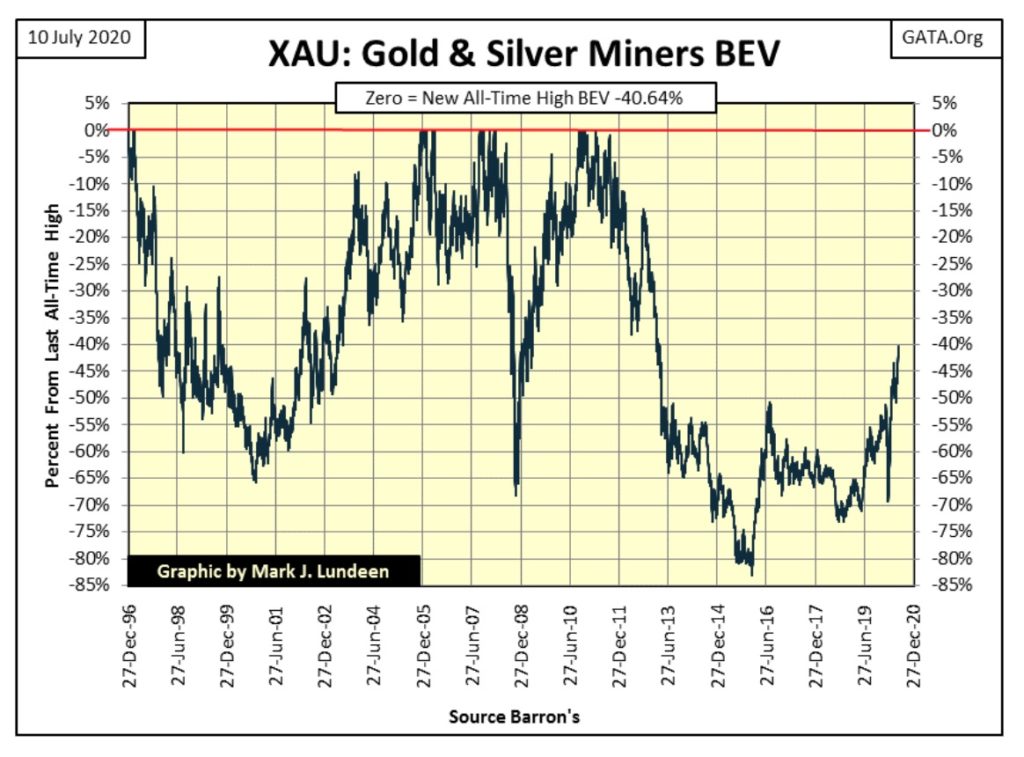
This week something changed in the stock market; something I believe will prove to be historic. On Tuesday, the XAU (gold mining shares) closed closer to its last all-time high than did the NASDAQ Banking index. Gold and silver bullion lagged behind the XAU (#18 & #22), lagging behind most of the major market indexes too. Why is that happening?

Since June 11th (the past month) the Dow Jones continues struggling with what it’s to do next; break above and stay above its BEV -10% line, or break below and stay below its BEV -15% line.
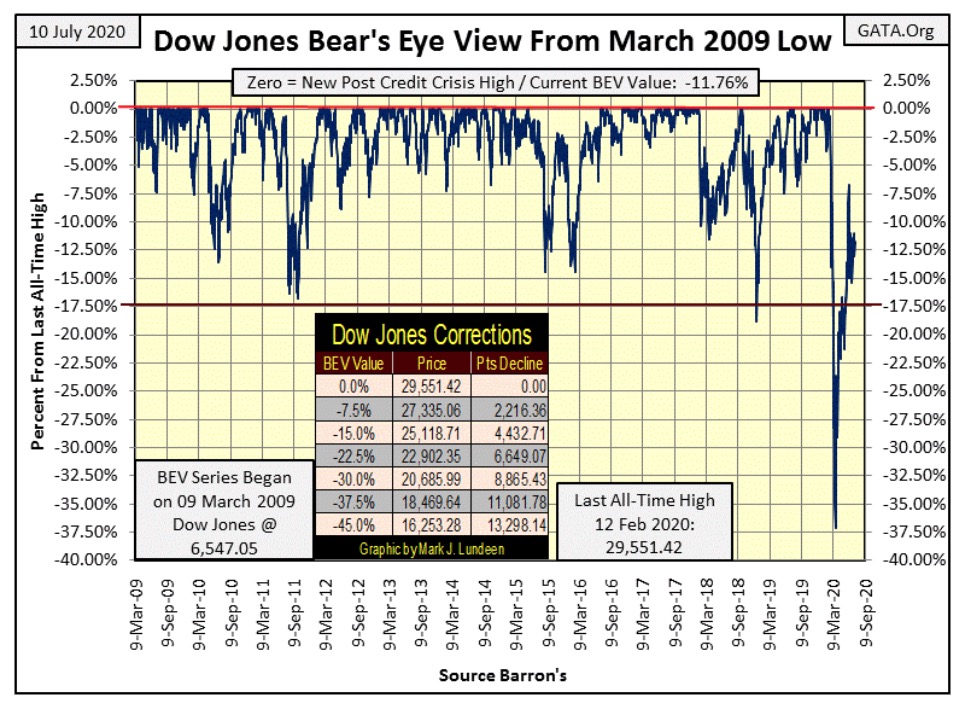
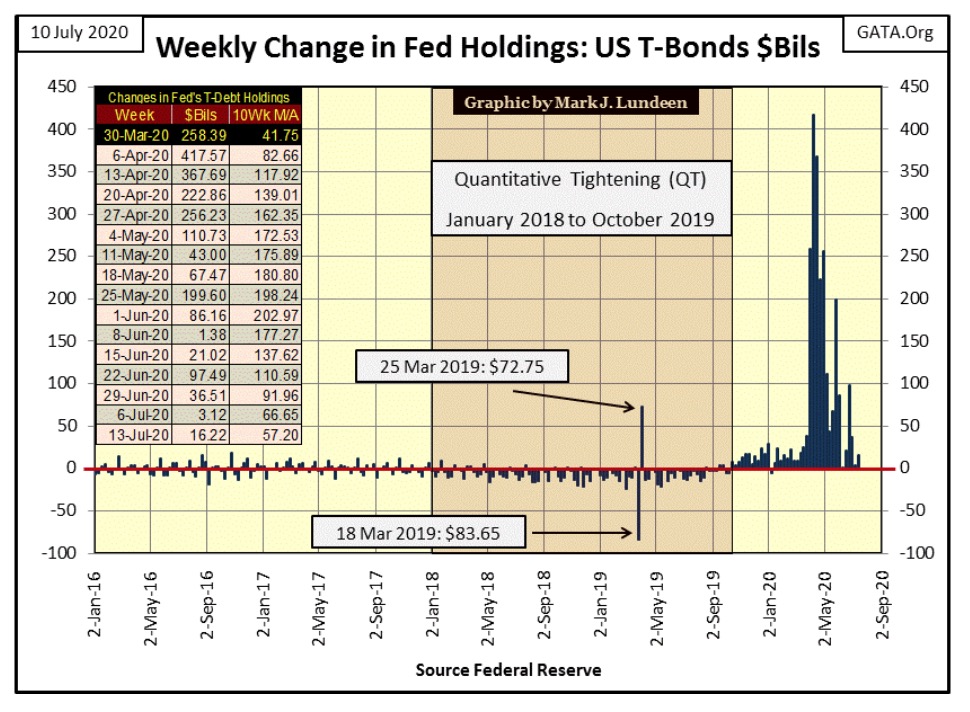
What’s the Dow Jones waiting for? As seen in my next chart showing the weekly changes in the Federal Reserve’s holding of US Treasury Debt, the Dow Jones is waiting for another “injection” of “liquidity.”
Looking at the table in the chart below, as the Dow Jones bounced off its BEV -37.5% low in the BEV chart above, the FOMC was weekly “injecting liquidity” into the market by the hundreds-of-billions. This was a historic, nay epic intrusion into the financial markets, something not seen since John Law attempted to keep his Mississippi Scheme of the early 18th century going.
Then beginning in June all that changed as the FOMC’s weekly “injections” of “liquidity” were reduced from hundreds to just tens-of-billions of dollars, and the Dow Jones became range bound between its BEV -10% and -15% lines.
Though the Dow Jones continues struggling to make a new all-time high (BEV Zero), this week some of the major market indexes have gone on to market history in the table below.
The NASDAQ indexes, with the exception of its financial indexes, are doing good, as is the Russell Growth index (#1-4). But beginning with #5 (Russell 1000), none of the other indexes are within scoring position (< 5.00%) of a new all-time high.
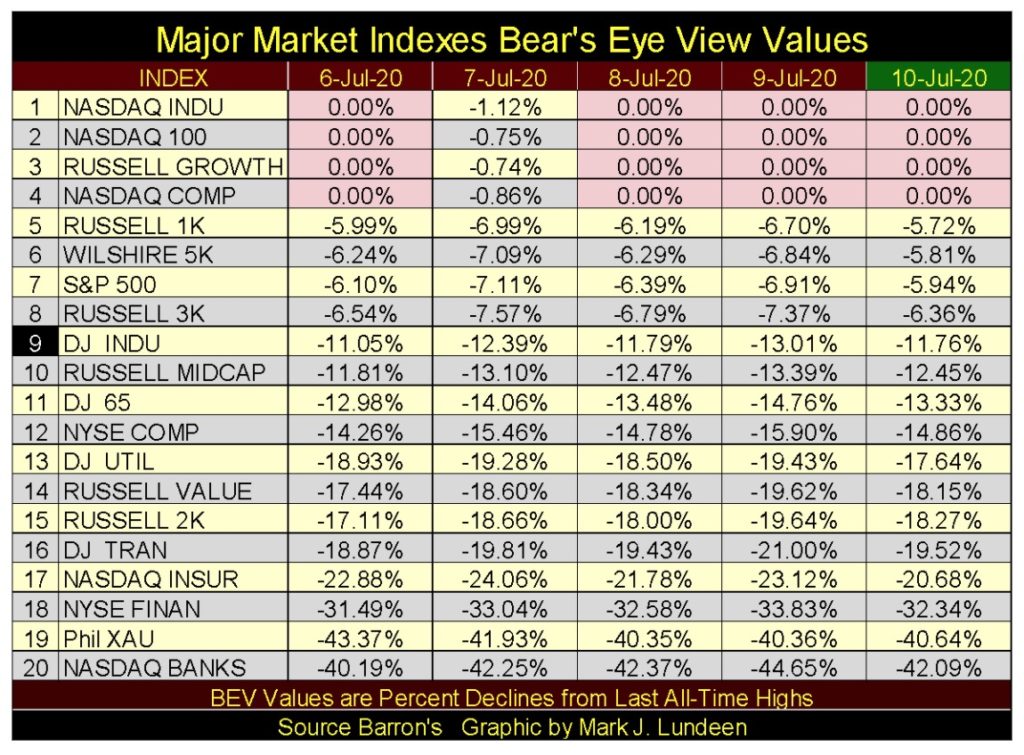
This week something changed in the stock market; something I believe will prove to be historic. On Tuesday the XAU (gold mining shares) closed closer to its last all-time high than did the NASDAQ Banking index; the XAU closed the week at #19 instead of its perennial last place of #20 in the table above.
This deserved further investigation, so I constructed the table below listing the percentage increases of the above indexes (with gold and silver bullion) from the Dow Jones’ March 23rd market bottom. The XAU is the top performer (#1), coming in with a sizzling 82.02% advance in the past seventy-five NYSE trading sessions – Wow! Not included in the table, Barron’s Gold Mining Index (BGMI) has advanced by 99.21% since the Dow Jones’ March 23rd bottom, just short a double!
Gold and silver bullion lagged behind the XAU (#18 & #22), lagging behind most of the major market indexes too.
So what’s with that? My best guess is large financial institutions, such as pension funds and insurance companies, are becoming concerned with the mismanagement of the financial markets by the FOMC. My readers are not the only ones looking at the weekly blow out of the Federal Reserve’s balance sheet, and so institutional money has begun to flow into the precious metal miners.
If gold and silver bullion aren’t taking a leading position in the table below, it’s because these large financial institutions don’t want the hassle of storing tons of a physical commodity like gold and silver bullion. That plus the ongoing price suppression in the precious metals futures markets. For a fund manager it’s so much easier to buy and sell mining stocks, and I believe that is exactly what we are seeing below.
Let’s take a Bear’s Eye View of the XAU in the chart below. Its last BEV Zero was on 12 April 2011. That’s a long time ago, and since then it saw a horrific 83% bear market bottom on 19 January 2016.
I’ll make this simple: in the world of widely held assets, such as stocks, bonds and real estate, only precious metal assets are currently rebounding off of profound bear-market bottoms. It’s been almost a decade since anything gold or silver has seen a new all-time high. But everything else has been in a bull market since their sub-prime mortgage debacle bottoms of March 2009.
Bull markets, exactly like bear markets don’t go on forever.
Given the choice of holding stocks now trading in today’s glamor NASDAQ indexes, or a gold and silver miner in the XAU, I have to go with the miners now rebounding off a horrific 83% bear market bottom seen below.
And what will the XAU do when the financial markets stumble again? At first it and gold and silver bullion may go down with everything else. But soon thereafter they’ll take off as even more institutional money realizes that precious metal assets are a safe harbor in the coming storm.
Here’s the Dow Jones in daily bars. Depending whether one sees a glass as half full or half empty will lead someone to conclude if this chart is bullish or bearish. As far as the Dow Jones goes, at the end of this week I’m looking at it like a half empty glass. But I admit if given a sufficient “injection” of “liquidity” from the FOMC, I could just as easily become one of those glass half full guys for a while.
Long term though, being bullish on the stock market doesn’t have much of a future in my opinion, and won’t until the Dow Jones comes rebounding off of a bear market bottom as we see the XAU is in the chart above. But the XAU can go through an 80% bear market and few people notice or care. However, should the Dow Jones do so it will be a repeat of the depressing 1930s.
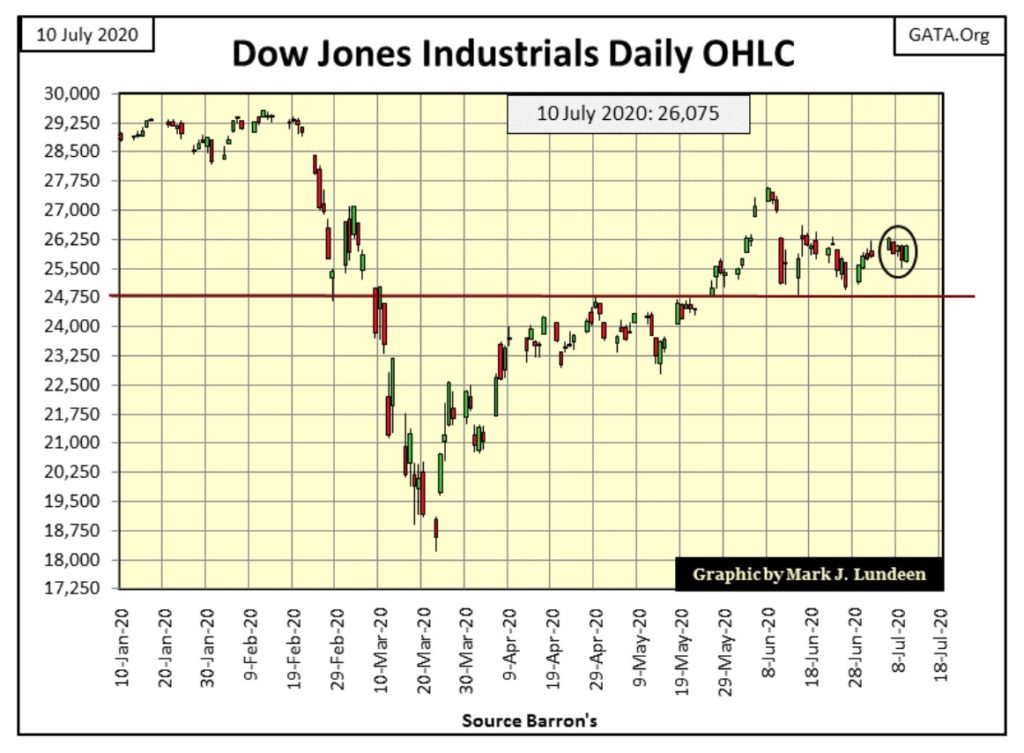
Moving on to my comparison between the Great Depression and our bear markets; on Friday (Day #103) the Dow Jones has yet to exceed its BEV -6.70% seen on day #80 (June 8th), and refuses to break below the BEV -15.35% seen on day #94 (June 26th). So we wait to see what is to be in the weeks and months to come.

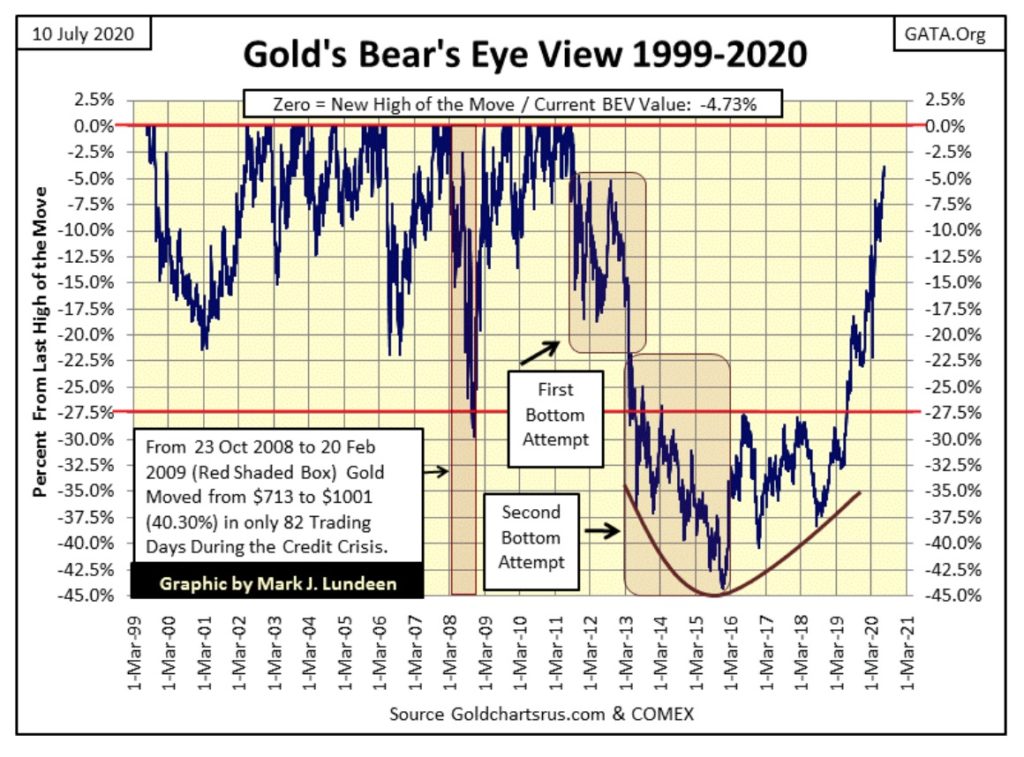
Looking at gold’s BEV chart below we see real power in gold’s advance from last summer when it finally broke above its BEV -27.5% ($1360) line. For six years gold couldn’t get above, and then stay above this line. That made this level very strategic.
Today it’s easy seeing the significance of gold breaking above this level. But my hats off to my readers who actually purchased gold and silver last year when this breakout began, because last June when gold began this advance the chart looked very different, with its predominate feature being the December 2015, BEV -45% bottom.
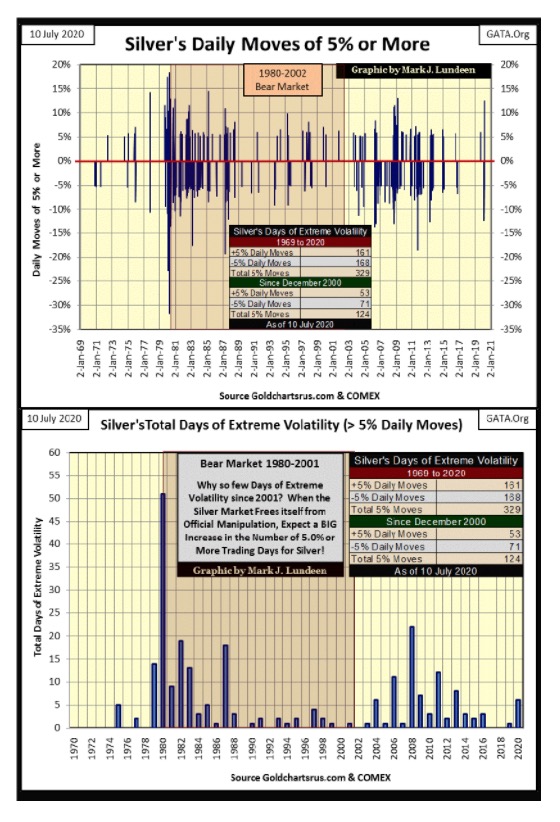
Let’s look at daily volatility for gold and silver below. The upper portions of these charts show the actual daily advances of > +/-3% for gold and > +/-5% for silver since January 1969. The bottom portions shows these days of extreme volatility totals for each year since 1970. This bottom portion provides a more strategic view of these markets over the decades.
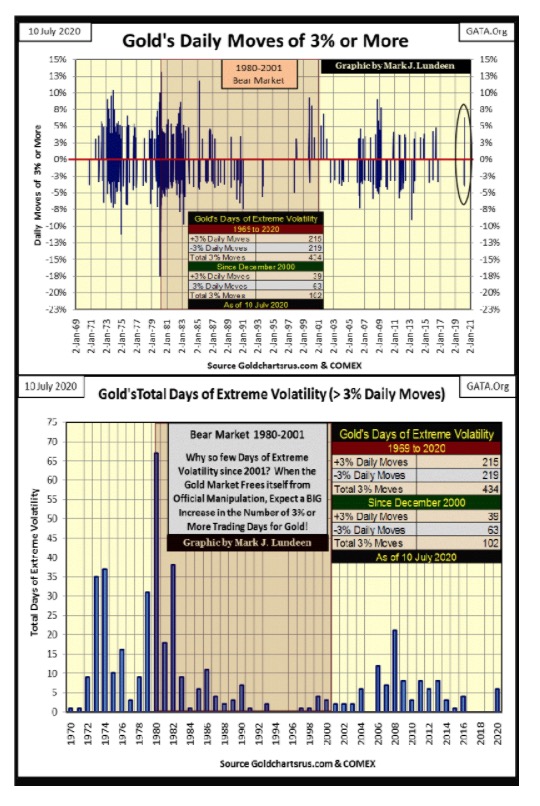
From 1972 to 1982 gold saw frequent extreme days of market volatility, which for gold and silver are market events seen in both bull and bear markets. The way to look at extreme volatility for the old monetary metals is when they are in play; seeing big moves in either a bull or bear market, they are frequent market events. But when market action becomes as boring as looking at paint dry, gold and silver can go for years without seeing an extreme day of volatility.
So what do we see above? Since 2016 when the gold market saw four extreme days, the gold market saw no extreme volatility until this year (a three year gap), which in 2020 so far has seen six of them:
- Four -3% days
- Two +3% days
For what it’s worth, these charts of extreme volatility tell us something has changed in the gold and silver market which is very favorable of the bulls. I expect in the years to come extreme market volatility will increase significantly as the old monetary metals soar to heights none of us could believe today. But I’d be happy should gold close out 2020 at something over $1950 and silver something over $25. Not that these values are a prediction of mine.
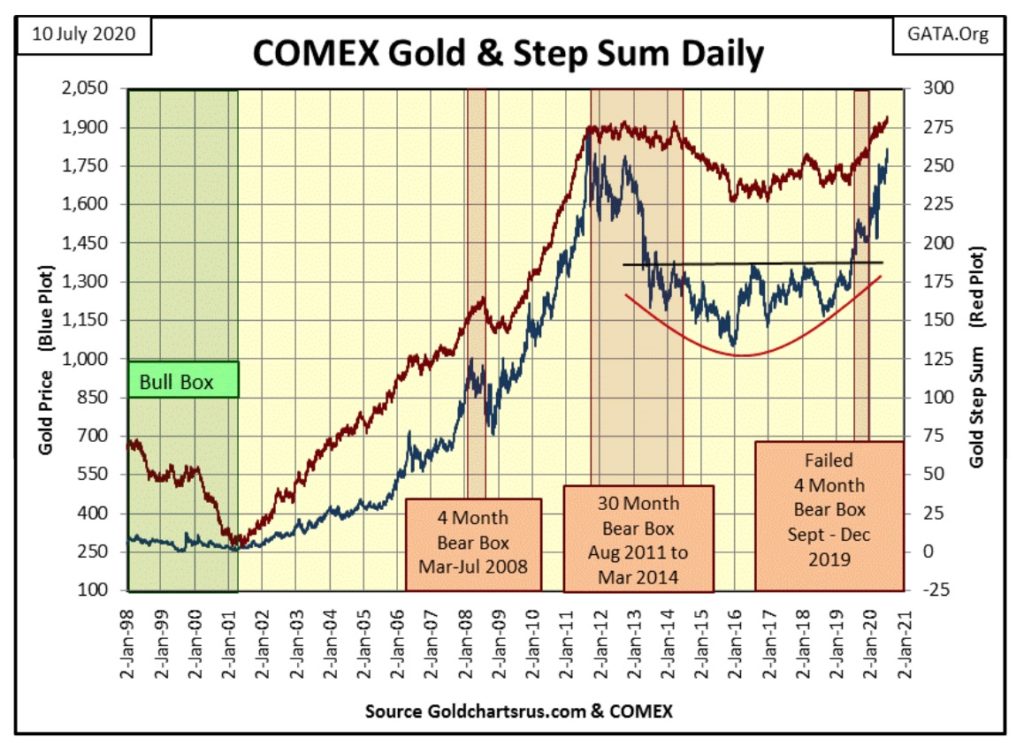
Gold’s step sum chart is next. Market sentiment (the red step sum plot) is coupled with market reality (the blue price plot) as they both advance to higher levels.
The hard times of the post 2011 market top are now over. It’s only a matter of time before the financial mainstream media is forced to report on a bull market advance in gold which began a year ago in June 2019.
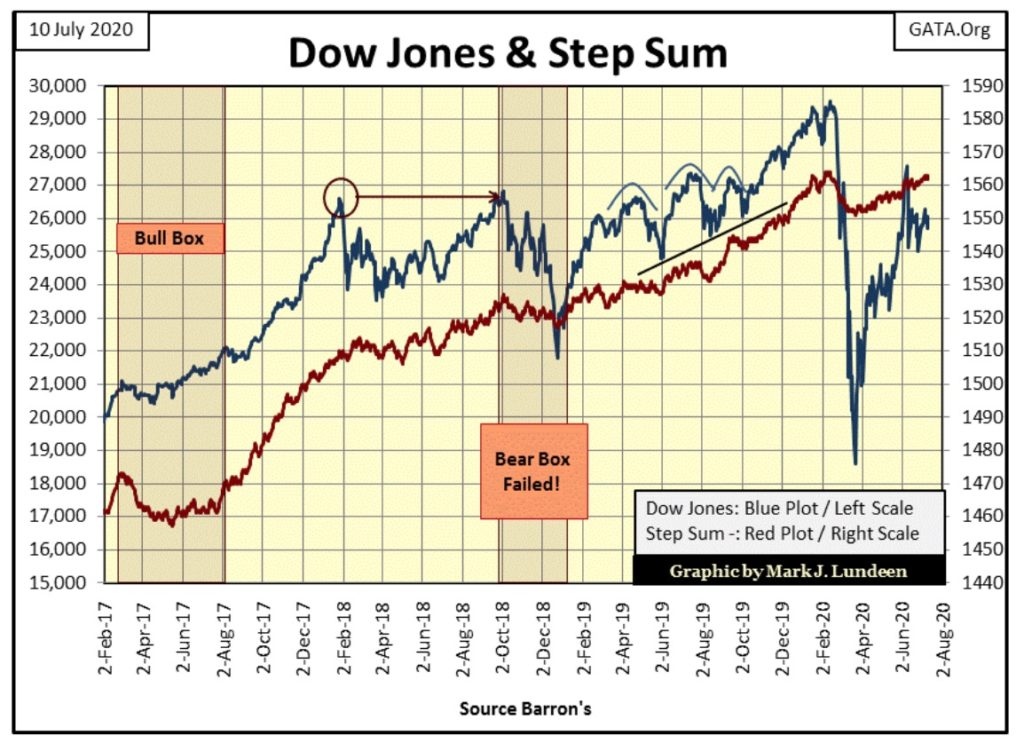
For the Dow Jones step sum chart, market sentiment (red step sum plot) bullishly advances, but market reality (blue price plot) has been range bound between 25,000 and 26,000 for the past month.
Are we looking at a bear box in the making here? Maybe. But between the step sum and price plots, the price plot is usually a superior predictor of future market price trends. It’s not bullish seeing a step sum decouple from its price plot as has happened with the Dow Jones below, but it doesn’t mean the Dow Jones will soon be crashing either.
Moving on to gold’s step sum table below; its step sum is up four net daily advances in the past twenty-five trading days, which moved gold UP by 7% since June 5th. Gold’s 15 count closed the week at a neutral +3. This is all good, but when is gold going to see its daily volatility’s 200 Day M/A advance above 1%? Gold could use some extreme days (3% days).
Maybe when gold takes out its current all-time closing high of $1888 from August 2011, there’ll be some excitement at the COMEX; a few daily moves of over 5%. During its explosive advances (and declines) gold sees BIG daily percentage moves both up and down! So don’t be dismayed should you see a 6% decline from one day to the next when gold breaks above its current all-time highs of $1888. That’s just how real cowboys ride this bull.
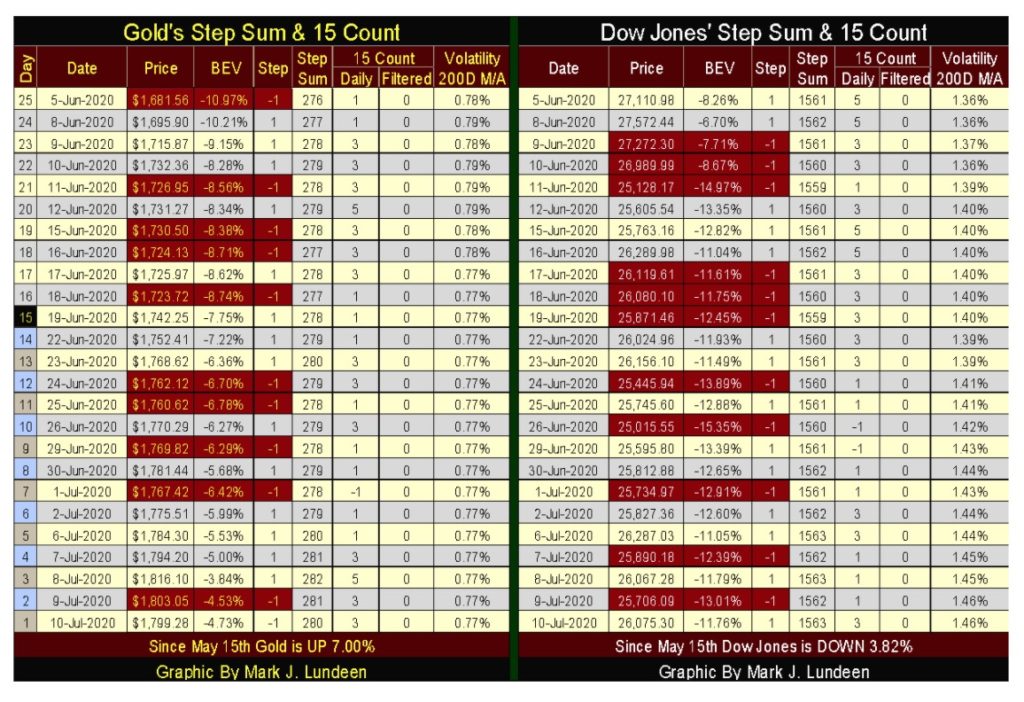
I note for the Dow Jones in its step sum table above, how since June 5th its price is down by over 1000 points as its step sum has advanced by two steps; to 1563 from 1561. Market sentiment in the stock market seems a bit out of whack as daily volatility’s 200 Day M/A continues rising; from 1.36% on June 5th to 1.46% at this week’s close.
Keep in mind all 200 day moving averages are lagging indicators. Whatever internal condition a 200 day moving average is measuring; that internal condition, like daily volatility, is likely to reverse its trend weeks or even months before its 200 day moving average can.
And since January 1900, with few exceptions from the depressing 1930s, seeing Dow Jones daily volatility’s 200 Day M/A increase to 1.46% was a dependable * BUY * signal. This was the case for the NASDAQ High-Tech bear-market bottom of 2002, and again for the sub-prime mortgage bear-market bottom in November 2008.
So what’s my problem now? For one thing, seeing the Dow Jones daily volatility’s 200 day moving average at 1.46% is something that happens during a BIG market decline. So at week’s end with the Dow Jones closing only 11.76% away from its last all-time high, why is its daily volatility’s 200 day moving average at a whopping 1.46%? It’s all wrong!
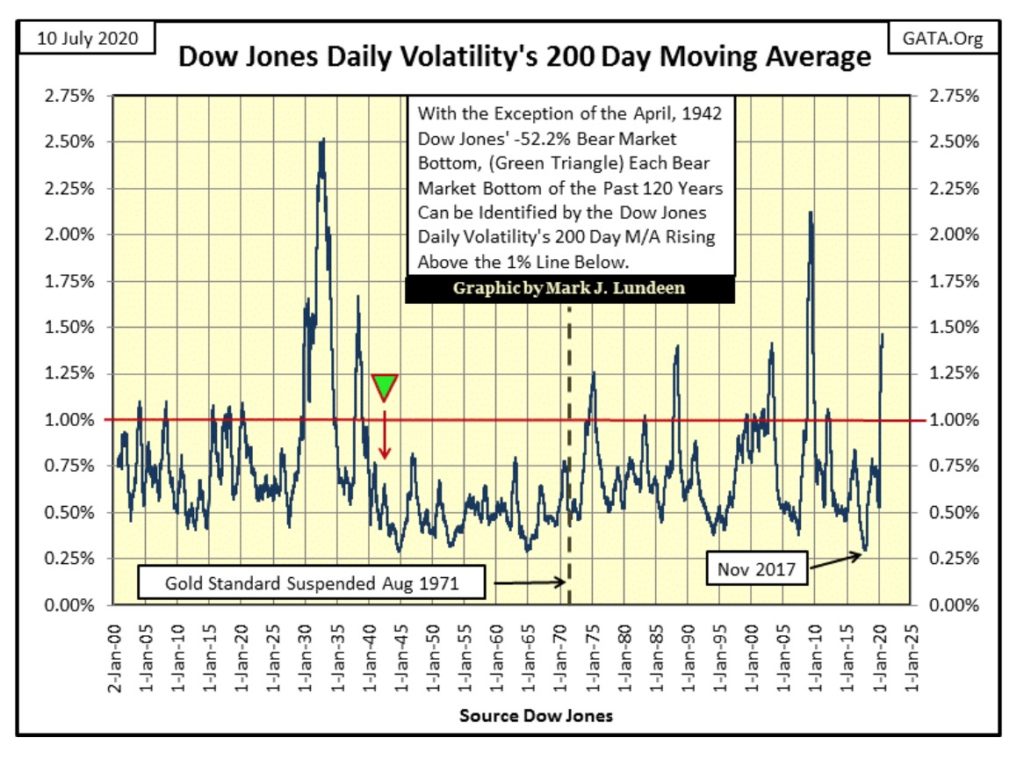
Could it be the FOMC has over medicated the stock market with its massive “injections” of “liquidity” to the point it doesn’t know whether it’s coming or going? From the stand point of daily volatility, I believe that is the case.
It’s amazing what a bioweapon let loose on an unsuspecting world can do to one’s global reputation, as China discovered this past year. Since last January global opinion of China has changed from being a benign member of the global community to a menace for the rest of the world; and for darn good reasons! But one element of this danger is under reported; that China is also a danger to itself.
China’s emergence from 3rd World status since the Carter Presidency (1976-80), is remarkable, but possible only because of ill-considered massive transfers of technical knowledge and manufacturing facilities from Europe and North America. What were the Clinton, Bush and Obama administrations thinking of?
However, one impediment main-land China can’t overcome is it’s governed by the Chinese Communist Party (CCP). Why is that? Because the cadre of hard-core party members who survived the party purges of Chairman Mao’s Cultural Revolution are now in power, and their understanding of capitalism remains twisted. The CCP’s rejection of what the West considers good-business practice, such as honoring one’s contractual obligations, is a flaw that one day will prove fatal to the CCP.
The Chinese communists of the 21st century’s political views remain loyal to Marxist ideology, which today is best stated as – “by any means necessary.” They’ve made no attempt to incorporate the rule-of-law which is central to the success of the Western-Capitalist Society, the political system they still strive to overturn. Here’s a quote from Samuel Johnson, an 18th century English author and moralist that I believe illustrates this theme.
“Whoever commits a fraud is guilty not only of the particular injury to him who he deceives, but of the diminution of that confidence which constitutes not only the ease, but the very existence of a society.”
Samuel Johnson
Sadly Doctor Johnson isn’t as popular today as he was a century ago, and the world is unhappier for it. But for the communists Chinese, he is totally unknown as their world view today is still best seen in Karl Marx’s Communist Manifesto, published in 1848 in the link below.
https://www.marxists.org/archive/marx/works/1848/communist-manifesto/
Except in China today, the bloodsucking capitalists Marx denounced are the senior members of the CCP and their fellow travelers from California’s Silicon Valley, mainstream-media outlets, Hollywood, Ivy-League Academics and sadly many others.
The Communist Manifesto is a difficult read; if you’re a normal person. Unfortunately, for all too many Western academics, Marx’s turgid text is a real page turner; and required reading for college students taking “critical studies programs” in feminist, race, and queer studies.
Back to the CCP; probably the biggest flaw they’ve introduced into their society and economy is the elimination of respect for the moral basis of contracts. Contracts are simple; comprised of only three elements:
- an offer;
- an acceptance of the offer;
- considerations.
The offer to contract is from someone; let’s call them the party of the first part, in need of a service or source of goods they themselves can’t produce.
The acceptance of the contract is by someone, the party of the second part who can fulfill the terms of the contract.
The considerations are the fulfillment of the contract; where the party of the first part receives the services or goods from the party of the second part, who in turn receives payment from the party of the first part as set forth in the contract.
Note this contract example is accomplished without any government involvement. It’s called private enterprise, though government frequently enters into contracts with private contractors. However, in this example the government becomes involved only when the terms of this contract are not fulfilled, as the government’s sole role in private enterprise is to ensure the terms of this, or any other contract are enforceable in a court-of-law. Tell your bank you refuse to make any future monthly payments on your mortgage and watch what happens!
Okay; but what does this has to do with the Chinese Communist Party? Well, their refusal to understand the moral basis of contracts will one day result in possibly the largest tragedy in recorded history. I’m talking about the ongoing failure of the Three-Gorges Dam across the Yangtze River, which is located at or around Yichang in the map below.

Googling, or in my case DuckDuckGoing, the Three-Gorges Dam provides plenty of information on this topic, both pro and con. But most of the pro commentary is by CCP friendly media; such as the Global Times, which should be discounted after one studies the photo provided below.

“Chinese experts have dismissed rumors hyped by some Western media that the Three Gorges Dam, the world's biggest hydropower project, is at risk of collapse, noting the dam is intact and has spare capacity to hold the current inflows of water after southern parts of China experienced heavy rainfall and the Three Gorges reservoir's water level exceeded the flood control line.”
https://www.globaltimes.cn/content/1192443.shtml
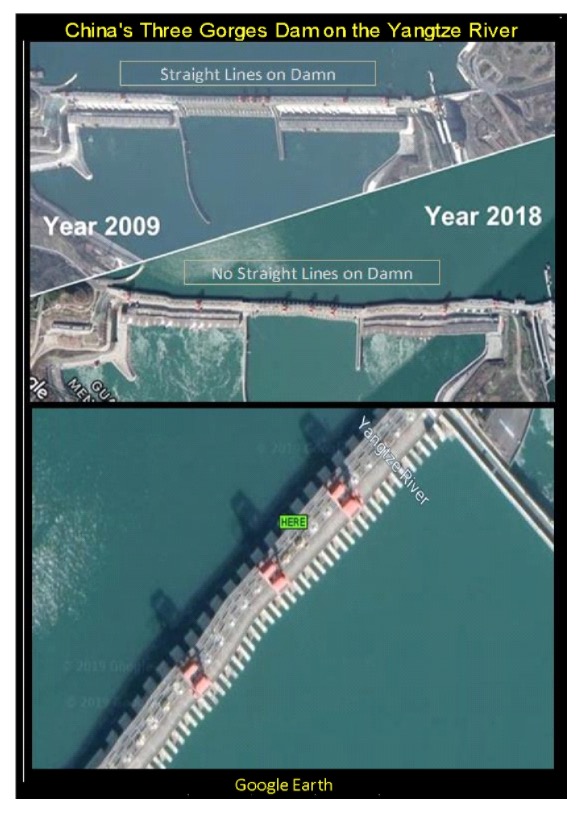
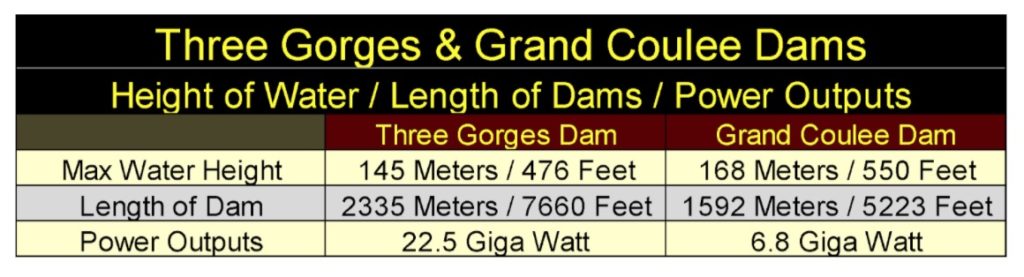
The closest example of a similar dam in the United States is the Grand Coulee Dam in Washington State on the Columbia River. The Grand Coulee Dam was completed in 1947. After seventy – four years of service its concrete body remains free of the warpage evident above in China’s Three-Gorge Dam.

Here’s a table listing statistics for these two dams. The Grand Coulee Dam is actually twenty-three meters higher than the Three Gorges Dam, proving the feasibility for a high dam.
So what went wrong on the Yangtze River? Contractors on the dam didn’t honor their commitment to the contracts they entered into. Rather they used substandard materials and techniques to cut costs, then funneled the savings into their personal net worth.
As nothing in China is done without the involvement of the Communist Party, especially something as large as damming the Yangtze River, this slow-motion collapse of the Three-Gorges Dam is a failure of Chinese Communism. When this dam fails, and it will, God help the many tens-of-millions of people living downstream from it.
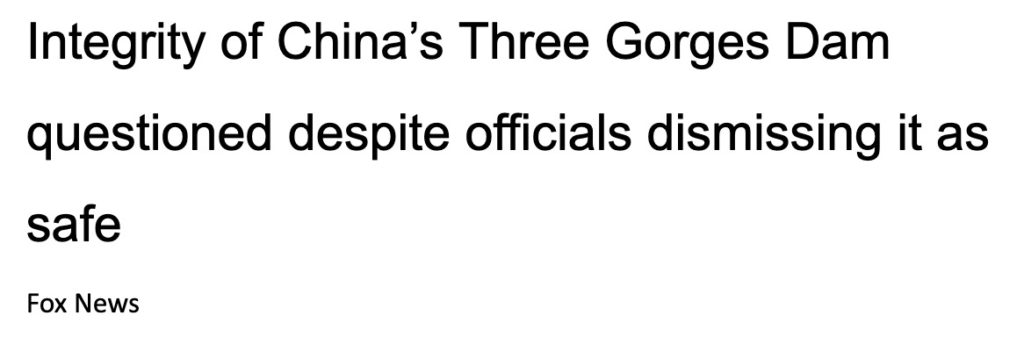
“China’s Three Gorges Dam, the world’s biggest and most controversial hydropower structure, was rumored to have been cracking and splitting as people posted satellite images of the structure last week. Chinese officials stated the structure was sound, denying online rumors that the construction was at risk of collapse.”
In China today, it’s not just the dams which have problems with quality.
Next are two videos by ADVChina. The creators of these videos are two guys from New York State and South Africa who moved to China in the late 1990s teaching English and computer science, both now fluent in spoken and written Mandarin. They have recently departed from Mainland China, with their Chinese wives and children; for fear of their personal safety.
The proprietors of ADVChina: aka Serpentza & Laoway 86 create interesting content as they travel around China on motorcycles commenting on what they see. As seen in these two videos; construction with substandard concrete is a Chinese Communist specialty.

Shoddiness in construction and maintenance for housing and commercial property is there for all to see, and this can’t be good for the long-term health of the Chinese economy. I have to believe this problem of corrupt construction also extend to Chinese Communist Party’s Peoples Liberation Army, Air Force and Navy.
The lack of respect for contractual obligations has created a ticking time bomb for the Chinese Communist Party. And then there are the border disputes with EVERY country which shares a border with the Chinese Communist Party, which now also includes Russia. Defense Updates below reports the CCP is now looking to liberate Vladivostok, Russia’s port on the Pacific.

Not satisfied with managing its own internal affairs, the Chinese Communist Party is compelled to exert its control ever farther from its boarders, becoming a global menace in the process.
The escapades of the CCP may not today impact American markets, but as China has become a huge trading partner to the United States, it could tomorrow. The collapse of the Three-Gorges Dam would not only be a huge human tragedy in China, but could also be a significant market event worldwide.
How much of China’s industrial base would be flushed out to the East China Sea? The loss of this dam’s electrical power to the Chinese economy will impact industrial production far from the Yangtze River.
So, keeping an eye on the western shores of the Pacific Ocean as well as the Dow Jones is a prudent thing to do.
—
(Featured image by Leslin_Liu via Pixabay)
DISCLAIMER: This article was written by a third party contributor and does not reflect the opinion of Born2Invest, its management, staff or its associates. Please review our disclaimer for more information.
This article may include forward-looking statements. These forward-looking statements generally are identified by the words “believe,” “project,” “estimate,” “become,” “plan,” “will,” and similar expressions. These forward-looking statements involve known and unknown risks as well as uncertainties, including those discussed in the following cautionary statements and elsewhere in this article and on this site. Although the Company may believe that its expectations are based on reasonable assumptions, the actual results that the Company may achieve may differ materially from any forward-looking statements, which reflect the opinions of the management of the Company only as of the date hereof. Additionally, please make sure to read these important disclosures.


Biotech Booster: €196.4M Fund to Accelerate Dutch Innovation
The €196.4 million Biotech Booster fund in the Netherlands supports scientists and research teams to turn biotech innovations into market-ready...


Why the iGaming Industry Offers Some of the Best ROI for Affiliate Marketers
iGaming affiliate marketing offers high earnings through RevShare (up to 60%) and CPA ($50–$550), far exceeding e-commerce. Key advantages include...


Ripple and Mercado Bitcoin Expand RWA Tokenization on XRPL
Ripple advances its RWA ambitions with Mercado Bitcoin tokenizing $200 million in fixed-income and equity assets on XRPL. This deepens...


Soybean Market Reacts to Trade Hopes, High Stocks, and Global Price Pressure
Soybeans and Soybean Meal rose on hopes of a U.S.-China trade deal, though Soybean Oil fell. Lower Brazilian prices and...


Legal Process for Dividing Real Estate Inheritance
Dividing inherited real estate involves more than legal steps—it's strategic. Recent reforms ease probate and offer tax breaks, but proactive...
 |
|
 |  |
 |
|
-

 Fintech2 weeks ago
Muzinich and Nao Partner to Open Private Credit Fund to Retail Investors
-
 Fintech21 hours ago
Ripple and Mercado Bitcoin Expand RWA Tokenization on XRPL
-

 Crypto1 week ago
Bitcoin Traders on DEXs Brace for Downturn Despite Price Rally
-

 Crowdfunding6 days ago
From Confiscation to Cooperation: Funding Casa de la PAZ’s Social Transformation