Featured
A look at the US population and immigration changes
Can the US afford to curb the country’s immigration? Here’s a look at the best and worst population changes.

The Dems shut down the government because of the ongoing immigration impasse. Only for a couple of days, sure. But it’s THAT big of an issue across the political spectrum right now.
Trump wants a wall. Trump wants the Dreamers out. Trump even wants to put an end to legal family immigration practices, where new U.S. citizens get to sponsor green card applications for their family.
Trump’s an idiot. (Hey, you may not like to hear me say that, but we’re all entitled to our opinions.) He’s oblivious to the negative impacts his isolationist tactics could have on future growth and prosperity in the U.S.
Of course, he’s the President, and he’s fighting a battle he believes his followers want him to fight. The question is, can the U.S. afford to curb immigration? To answer that question, we first have to look at our own population and migration patterns.
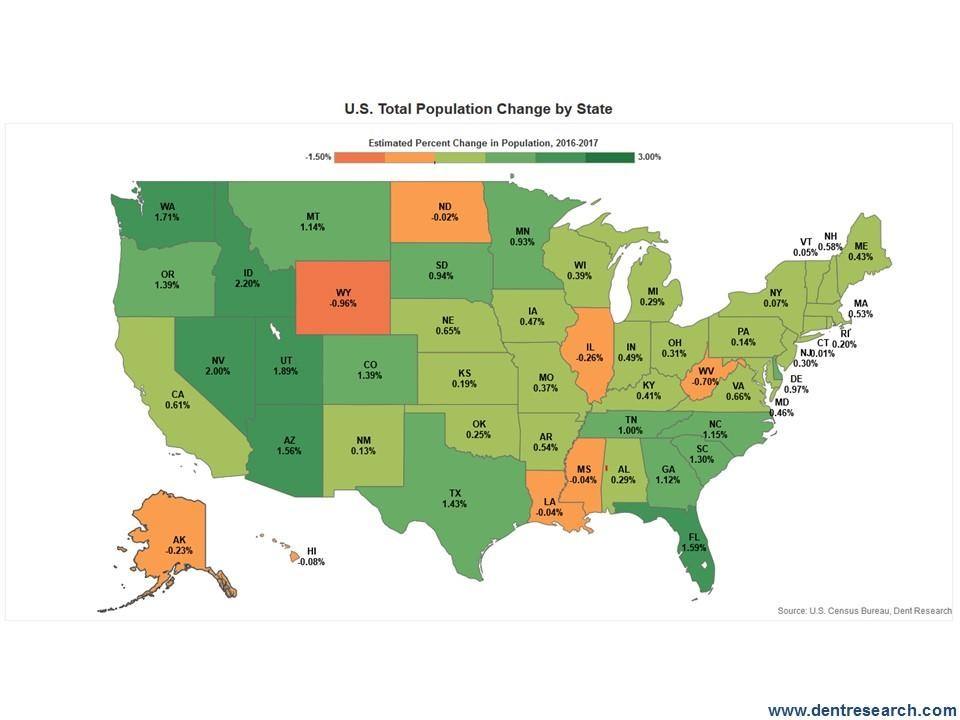
Although the U.S. population grew 2.2 million in 2017, or about 0.7 percent (a number that will decline ahead), the population growth is very different across the 50 states.
Look at this map. It shows the natural population growth by births over deaths per 1,000 residents to see which states are doing the best.

This indicator is the best for showing longer-term growth beyond immigration and migration trends, which can change (something I’ll talk about another day).
The shades of green show higher growth while the shades of orange show lower growth or even a decline in a few states.
Guess who comes in first with the highest birth rates?
Utah, with its Mormons! Its population growth rate is at 11.5 percent. Utah is the youngest state in the U.S., which bodes well for its future growth demographically.
The large state with the highest long-term growth rates is Texas (7.5 percent), with its mix of higher births, high immigration, and high migration from other states—it hits on all cylinders!
California is the other large state with high natural growth rates due to foreign immigration.
Then comes Georgia, Washington State, and Virginia.
But Florida is the surprising loser here at a mere 1.1 percent growth. That’s not surprising. It’s the retirement capital of America and has a lot of older people, despite strong migration and immigration trends.
The northeastern states are losing the most, like Maine (-0.90 percent), Vermont, Maine, New Hampshire, and Pennsylvania. The worst, of course, is West Virginia (-1.70 percent).
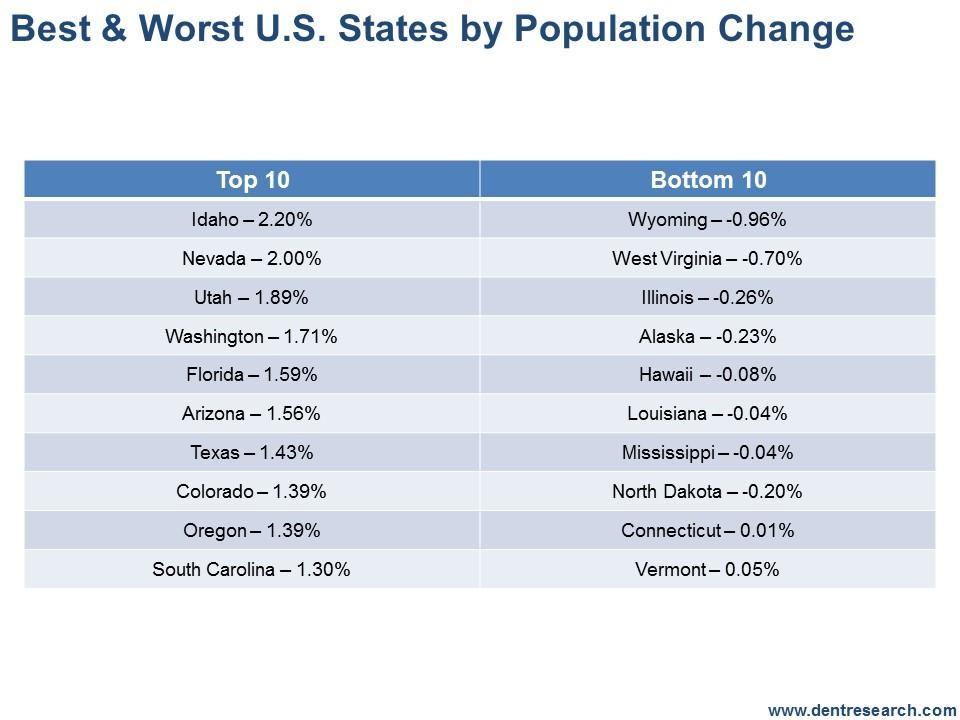
This table shows the top 10 and bottom 10 stats on natural population growth from births over death rates.

Where do you want to live or do business?
My vote is for Texas, which has four major cities with different lifestyles (my favorite is Austin where our next Irrational Economic Summit will take place in October). It’s has a zero state-income tax to boot!
—
DISCLAIMER: This article expresses my own ideas and opinions. Any information I have shared are from sources that I believe to be reliable and accurate. I did not receive any financial compensation in writing this post, nor do I own any shares in any company I’ve mentioned. I encourage any reader to do their own diligent research first before making any investment decisions.
(Featured image via DepositPhotos)

-

 Business2 weeks ago
Dow Jones Breaks 50,000 as Bull Market Surges Amid Caution and Volatility
-

 Crowdfunding2 days ago
The Youth Program at Enzian Shooting Club Is Expanding Thanks to Crowdfunding
-

 Impact Investing1 week ago
EU Backs 90% Emissions Cut by 2040 and Delays ETS2 Rollout
-

 Markets5 days ago
Markets, Jobs, and Precious Metals Show Volatility Amid Uncertainty


You must be logged in to post a comment Login