Markets
Setting Aside the Magnificent Seven, Gold Has Been a Star Performer Since the Start of the Millennium
A U.S. Thanksgiving shortened week translated into a rather dull week for the markets. But once again led by the Magnificent Seven stock markets were up on the week. Since the TSX does not have the Magnificent Seven it actually was down small. Gold appears poised to break through its resistance and like a spring that has been held back it could explode to the upside.
Bob Dylan’s song The Times They Are A-Changin’ (1964) became an anthem for the 1960s, defining a tumultuous period of change. The 1960s were marked by events such as the assassination of five major figures in the U.S., including President Kennedy (on November 22, 1963), the building of the Berlin Wall, the civil rights marches and riots, the Vietnam War with protestors and draft dodgers, Watergate, spacewalks and man on the moon, China’s cultural revolution, the Israeli-Arab six-day war, Woodstock, and the sexual revolution.
We can’t think of a song that would define the 2000s and the 2010s. The 2020s are still underway. Change, however, is a constant. And change is what defines the period. Since the turn of the twentieth century, we’ve had many defining moments. The new millennium and the millennium bug (Y2K) that never happened, the dot.com collapse, 9/11 and the subsequent invasions of Afghanistan and Iraq by the U.S. along with a few others, Facebook and the social network, terrorist attacks in London, the iPhone, the global financial crisis of 2007–2009, the election of Barack Obama, the first African-American president, the colour revolts that led earlier to the dissolution of the Soviet Union, plus Georgia, Ukraine, and the Arab Spring and others that were shown to be instigated, orchestrated, and financed by the U.S., Arab spring revolts that led to the NATO attack on Libya and the uprising in Syria while, in Egypt, an elected government was overthrown, the death of Osama Bin Laden, the alleged mastermind of 9/11, the EU/Greek crisis leading to the default by Greece, the legalization of same-sex marriage in the U.S., helping pave the way to the culture wars, Brexit, the election of Donald Trump, Facebook with two billion users and Apple becoming the first trillion-dollar company, the COVID pandemic that disrupted the world, the stock market and housing bubble, the election of far-right governments, the deepening polarization in Western countries, the Russia/Ukraine war, the Israel/Hamas war, the growing divide between the West led by the U.S. and the East led by China – G7 vs. the BRICS threatening to disrupt the global order.
Did we miss anything? The times are a-changing. Each decade brings its own challenges and disruptions. What’s an investor to do? Where does one go with ongoing global and domestic instability? Where does one go with a slowing world economy? We have deglobalization, falling demographics, digitalization, decarbonization, growing debt, rampant climate change and mass migration movements, all contributing to ongoing instability. Technology is constantly changing. It can improve lives, particularly in health care, but may also prove to be disruptive, such as AI.
The pandemic changed a lot of things. What happened was a massive rise in debt and rising inflation, sparked by disrupted supply chains and wars, followed by a post-pandemic surge in demand that we were ill-prepared for. Climate change is behind mass migrations and growing disruption because of fires, floods, heat and cold waves, and monster storms including hurricanes, yet polarization on the science is the major cause of an inability to respond. Wars are dividing the world into camps, even threatening to erupt in a global war, the first in almost 80 years. And deepening polarization within countries, in particularly the U.S., could contribute further to global instability.
Selected High Performance Stocks 2000–2023
Technology has, no doubt, led the world since 2000. We suspect that technology will continue to lead going forward. But technology is not just limited to the next big consumer gadget. Some technological advances such as the iPhone are maturing. But technology led by AI could be the leader in health care, decarbonization, space, energy, and dealing with climate change. Our performance chart above shows that the number one stock since 2000 has been Apple (AAPL) with a massive 24,521% return. Tesla (TSLA) follows with a gain of 20,566%. A distant third is Microsoft (MSFT) with a gain of 3,763%.
However, we cheated a bit, leaving off two monster winners. Nvidia (NVDA) may be the big winner, up an absolutely mind-boggling 54,210% while Netflix (NFLX), since it got underway in 2002, is up 41,235%. But have they topped? Netflix, for one, is well down off its highs. All of that makes the returns on the S&P 500 (SPX) and the TSX Composite seem rather puny. SPX is up 211% while the TSX has gained 139%. As we learned, it was only a few high-tech stocks that were leading the market higher. Studies show that only seven stocks—Meta, Amazon, Apple, Microsoft, Alphabet (Google), Tesla, and Nvidia—have accounted for 71% of the gain of the S&P 500 in 2023. We call them the Magnificent Seven.
With growing global instability, we look at hedges that could prove worthy in riding out the storm: macro hedge funds, conservative growth funds, cash, and gold. Cash doesn’t earn anything, or at least not much, and inflation destroys its purchasing power and value. Macro hedge funds and conservative growth funds aim for capital preservation. Returns can vary. Gold has been money for over 3,000 years. It is durable, divisible, consistent, convenient, and holds value as it always worth something. It is also indestructible and resilient. Gold is nobody’s liability. It has been used for centuries as jewelry and a means of exchange. If a currency collapses, gold maintains its value as a means of exchange.
So maybe it is no surprise that gold has been a strong performer since 2000 with a gain of 588%. Silver, gold’s junior partner, is up 334%. By comparison, stocks represented by the S&P 500 (SPX) and the TSX Composite are up only 211% and 139% respectively. Oil, which still constitutes 33% of all energy consumption was up 201%.
Fossil fuels still make up some 84% of energy consumption. Coal prices are up roughly 527% since 2000 and natural gas (NG) is up only 20%, thanks to discoveries that have added substantially to global supply.
Gold constitutes only a small proportion of global financial assets. According to Gold Charts R Us (www.goldchartsrus.com), gold makes up only about 0.5% of global financial assets (as of 2015 and probably not much different today). The largest gold consumers and holders are in Asia (China and India). The EU is somewhere in between. But gold has proven to hold its value over centuries. Gold continues to be under-owned and undervalued, particularly in North America.
If gold as a percentage of all financial assets is small, the market cap of all the gold mining companies in the world is less than $500 billion. That would rank them between 15th and 20th among the largest companies in the world. Newmont is the largest gold company with a market cap of $43.4 billion. Newmont ranks at number 395 amongst the largest companies in the world.
We leave with a chart of economic indicators. Money supply (M1) has exploded by 1,542% since 2000. The U.S. CPI is up 80% while GDP is up 175%. Nonfarm payroll employment has gained only 20%. However, the Case Shiller 20 city home price index is up 211%. Industrial production is up only 2%. The Fed rate that drives all interest rates is actually down 3%.
Not shown, as StockCharts doesn’t provide it, is U.S. federal government debt, up 602%. U.S. all debt (governments, corporations, households) is up 382% while the Fed’s balance sheet has leaped 1,066%. Money supply, low to ultra-low interest rates have fueled the massive debt increase along with inflation asset growth. U.S. national assets are up 902% since 2000.
The feeble GDP growth is overwhelmed by the growth in money and debt. It has taken at least $2.20 of new debt since 2000 to purchase $1 of GDP. The U.S. holds over one-third of all global debt. Total global debt is roughly $307 trillion (probably higher) and is at least 290% of GDP and again most likely a lot higher. An inability to grow debt, along with the risk of a debt crisis, could play havoc with GDP growth going forward.
As a result, where to invest and what to invest in become more important for the future. Gold should be a base to build the remainder.
Selected Economic Indicators 2000–2023
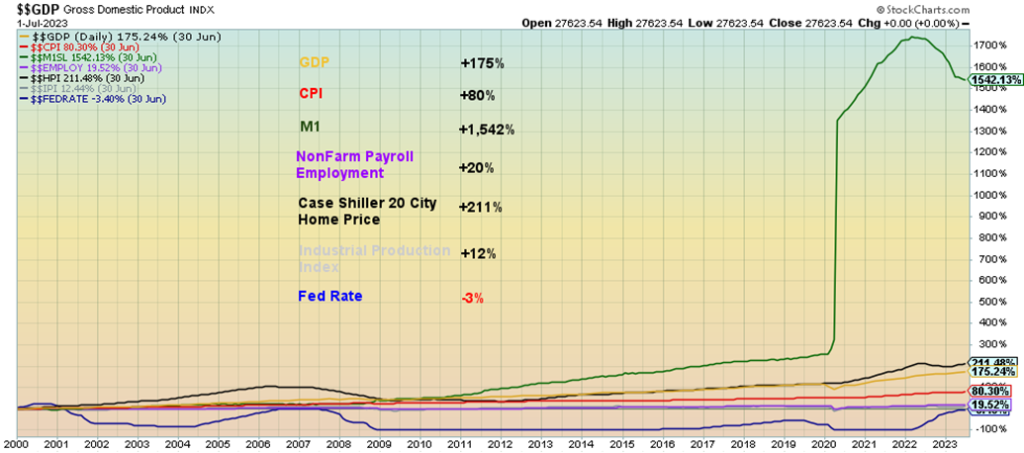
Chart of the Week
Argentina Peso vs. Argentine Inflation 1998–2023
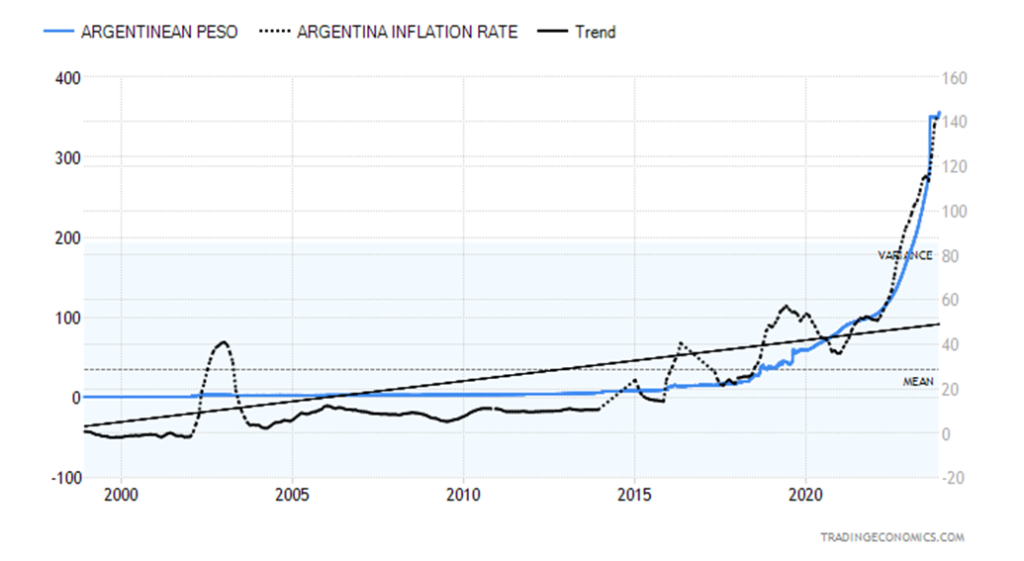
Yes, it may seem odd to post a chart about Argentina. But Argentina has been in the news of late because of the election of a libertarian president outside the mainstream elite that usually has ruled Argentina. No wonder—with inflation clocking in at a staggering 142.7% in October and a currency that has collapsed where it takes 356 Argentine pesos to purchase US$1 or, translated another way, one Argentine peso buys you US$0.0028, a 53% depreciation from a year ago.
A year ago, the rate was US$1=165 pesos. In parallel markets the rate is US$1=1000 pesos. The official rate is merely a reference as the black market is quite active in Argentina. Compounding the situation is that the president elect pledges to shut down the central bank and dollarize the economy. Given that the president elect Milei does not have control of Congress, the Senate, or the judiciary, he may have problems instituting some of his ideas.
However, one thing we couldn’t help but notice was that the Argentina stock market, the Merval Index, soared 20% on the news of Milei’s election. Milei is described as an “anarcho-capitalist”. He proclaims himself as “King of the Jungle” and is also known as “El Loco.” But the stock market didn’t care and jumped 20%. The stock market has leaped over 3,500% since a low in 2020, primarily because of the very high inflation.
Argentina is a serial defaulter, having defaulted nine times, the last time being in 2020. Could it default again? Given the unknowns around Milei, anything is possible.
Argentina Merval Index and Global X MSCI Argentina ETF 2018–2023
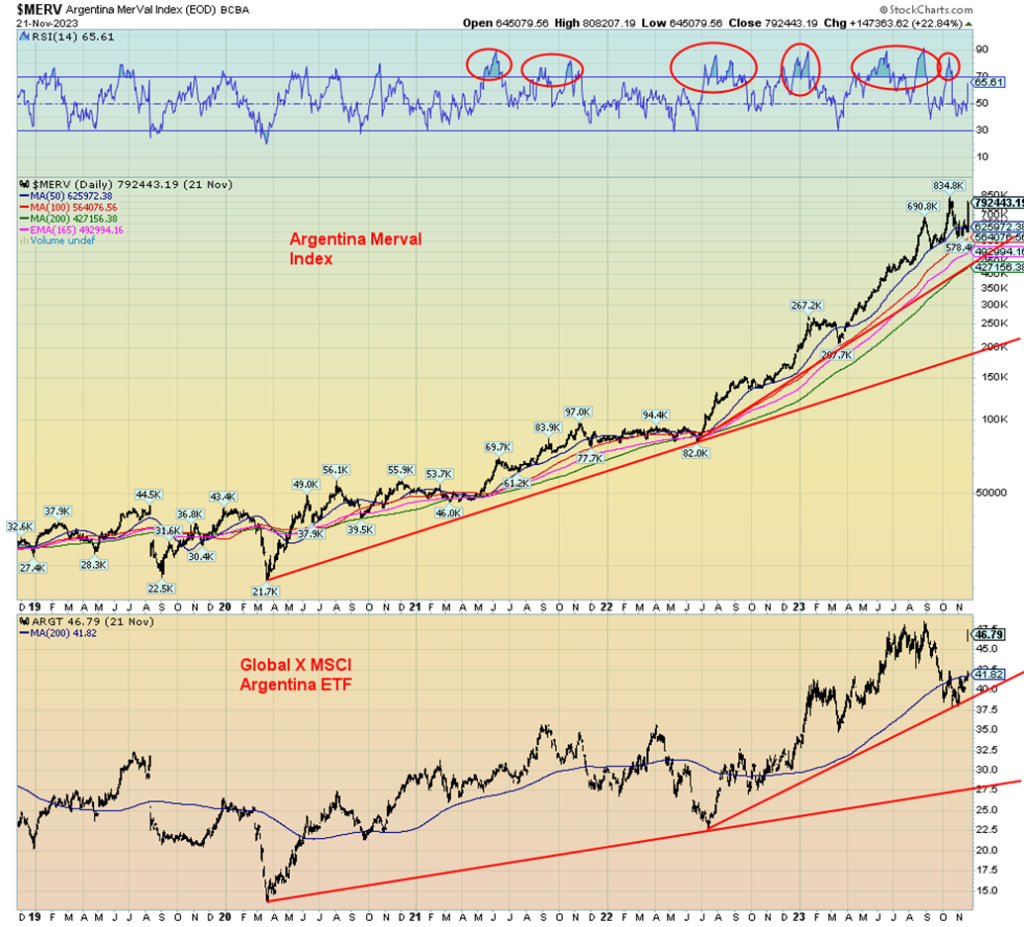
Overbought is almost meaningless when it comes to the Merval Index.
The Argentina stock market, along with the Global X MSCI Argentina ETF (ARGT), are both up sharply in the past year. Both leaped higher on news of Milei’s win. Argentina is blessed with an abundance of commodities. It is a major agricultural producer with vast lands available for agriculture. Argentina’s major exports are wheat, corn, soybean oil and meal, and meat. Argentina is also a major wine producer, even though most of its wine is consumed domestically.
Argentina has energy in natural gas, oil, bioenergy, and large reserves of shale gas and oil. It has major deposits of iron ore, uranium, gold, silver, copper, manganese, and tungsten. It also has huge potential in lithium, holding roughly 21% of global reserves, ranking third in the world behind Chile and Australia. Much of it is undeveloped. It is hoped by many that Milei opens up this potential. Chile and Australia are the world’s number one and two producers of lithium, yet Argentina barely registers. China is ranked as the third largest producer. Lithium is described as white gold. However, lithium prices have fallen sharply in the past year, down some 75% from highs. Many lithium stocks are also down from their highs.
Argentina is ranked as a second world country and has what some describe as a 20/80 economy, meaning 20% of the population control the economy. The other 80%? There is an estimated 40% poverty rate. Over one-third of the population of roughly 45 million live in Buenos Aries, the capital. 40% of the population lives in Buenos Aries province with three others, Cordoba, Santa Fe, and Mendoza bringing it to 60%. Much of the south in Patagonia is sparsely populated. The country is blessed with an abundance of natural beauty, including the world’s second largest falls, Iguazu Falls in Misiones province in Northern Argentina along the border with Brazil.
- Argentina has an abundance of potential but mismanagement has held it back, along with an entrenched elite. Despite the potential excesses and extreme views of president elect Milei, he does face a potential existential financial crisis (See The Economist view)
It is hoped that he is able to unlock some of the economic potential. High, unsustainable inflation and a sinking currency are not helping. Argentina’s federal government debt to GDP is 85% (U.S. is 124%), but its consumer debt to GDP is only 4% (Canada is 103%).
Converting the economy to the U.S. dollar would not necessarily be a smooth operation. Previous experience with using the U.S. dollar is mixed at best (Zimbabwe, Ecuador, El Salvador). Savings in pesos would be largely wiped out. There would, no doubt, be difficulty in obtaining U.S. dollars for many. The currency (monetary policy) would be controlled in Washington, not Buenos Aries. Previous experiments have shown it can bring down inflation and stabilize the economy over time, taming the current volatility. However, not all of the country is onside with this. Conversion would benefit some, but for many it could be a disaster, at least initially. The end of the central bank would also be a difficult task if not done right.
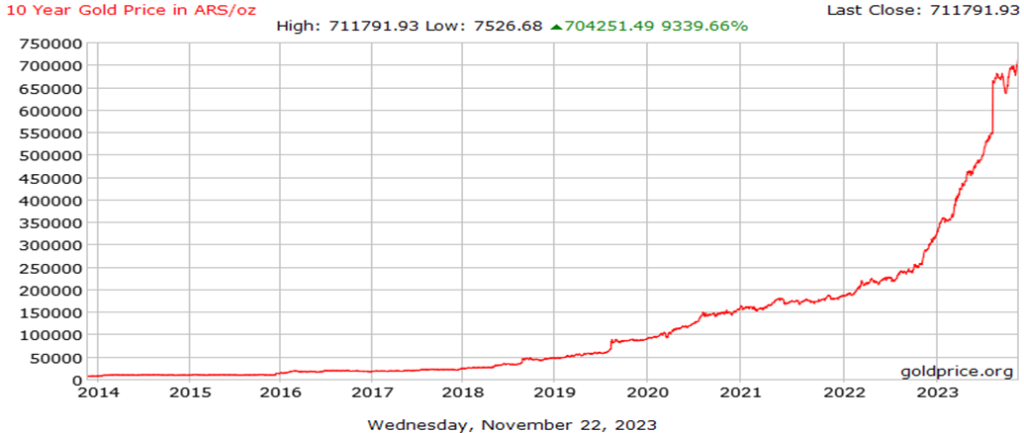
One consolation is that if an Argentinian held gold, he’d be able to purchase a lot of pesos. Today, one ounce of gold would fetch roughly 712,000 pesos. A year ago, one ounce of gold would buy 286,000 pesos—an increase of about 150% (more than keeping up with inflation). The chart is on the next page.
10-Year Gold Price History in Argentinian Pesos per Ounce
Markets & Trends
| % Gains (Losses) Trends | ||||||||
| Close Dec 31/22 | Close Nov 24, 2023 | Week | YTD | Daily (Short Term) | Weekly (Intermediate) | Monthly (Long Term) | ||
| Stock Market Indices | ||||||||
| S&P 500 | 3,839.50 | 4,559.35 | 1.0% | 18.9% | up | up | up | |
| Dow Jones Industrials | 33,147.25 | 35,390.15 | 1.3% | 6.8% | up | up | up | |
| Dow Jones Transport | 13,391.91 | 14,932.30 | 1.1% | 12.7% | up | neutral | up (weak) | |
| NASDAQ | 10,466.48 | 14,250.85 | 0.9% | 36.2% | up | up | up (weak) | |
| S&P/TSX Composite | 19,384.92 | 20,103.11 | (0.4)% | 3.7% | up | up (weak) | neutral | |
| S&P/TSX Venture (CDNX) | 570.27 | 532.33 | 0.3% | (6.7)% | up (weak) | down | down | |
| S&P 600 (small) | 1,157.53 | 1,173.82 | 0.2% | 1.4% | up | neutral | down (weak) | |
| MSCI World | 1,977.74 | 2,116.20 | 0.6% | 7.0% | up | up (weak) | neutral | |
| Bitcoin | 16,531.31 | 37,841.48 (new highs) | 4.0% | 128.9% | up | up | up (weak) | |
| Gold Mining Stock Indices | ||||||||
| Gold Bugs Index (HUI) | 229.75 | 226.85 | 3.7% | (1.3)% | up | down | down | |
| TSX Gold Index (TGD) | 277.68 | 273.13 | 2.1% | (1.6)% | up (weak) | down | down | |
| % | ||||||||
| U.S. 10-Year Treasury Bond yield | 3.88% | 4.47% | 0.7% | 15.2% | ||||
| Cdn. 10-Year Bond CGB yield | 3.29% | 3.72% | 1.1% | 13.1% | ||||
| Recession Watch Spreads | ||||||||
| U.S. 2-year 10-year Treasury spread | (0.55)% | (0.48)% | (4.4)% | (12.7)% | ||||
| Cdn 2-year 10-year CGB spread | (0.76)% | (0.74)% | 6.3% | (2.6)% | ||||
| Currencies | ||||||||
| US$ Index | 103.27 | 103.39 | (0.4)% | 0.1% | down | neutral | up | |
| Canadian $ | 73.92 | 73.01 | 0.1% | (1.2)% | neutral | down | down | |
| Euro | 107.04 | 109.46 | 0.4% | 2.3% | up | up (weak) | down | |
| Swiss Franc | 108.15 | 113.40 | 0.5% | 4.9% | up | up | up | |
| British Pound | 120.96 | 126.11 | 1.2% | 4.2% | up | up (weak) | neutral | |
| Japanese Yen | 76.27 | 66.90 | 0.2% | (12.3)% | up (weak) | down | down | |
| Precious Metals | ||||||||
| Gold | 1,826.20 | 2,003.00 | 0.9% | 9.7% | up | up | up | |
| Silver | 24.04 | 24.34 | 2.1% | 1.3% | up | neutral | down (weak) | |
| Platinum | 1,082.90 | 936.90 | 3.9% | (13.5)% | up | down (weak) | down | |
| Base Metals | ||||||||
| Palladium | 1,798.00 | 1,075.20 | 1.5% | (40.2)% | down | down | down | |
| Copper | 3.81 | 3.79 | 1.3% | (0.5)% | up | down (weak) | down | |
| Energy | ||||||||
| WTI Oil | 80.26 | 75.54 | (0.7)% | (5.9)% | down | neutral | neutral | |
| Nat Gas | 4.48 | 3.0 | 1.4% | (33.0)% | down | up | down (weak) | |
New highs/lows refer to new 52-week highs/lows and, in some cases, all-time highs.
It was a holiday-shortened week in the U.S. because of Thanksgiving. Markets were closed on Thursday and closed early on Friday. On the week, the S&P 500 gained once again, up 1.0%. The Dow Jones Industrials (DJI) was up 1.3% while the Dow Jones Transportations (DJT) gained 1.1%. The NASDAQ was up 0.9%, but the NY FANG Index gained 1.1%. The S&P 400 (Mid) was up 0.9% while the S&P 600 (Small) was up only 0.2%. The S&P 500 Equal Weight Index kept pace, gaining 1.0%.
In Canada, the TSX Composite bucked the trend, falling 0.4% while the TSX Venture Exchange (CDNX) gained 0.3%. In the EU, the London FTSE fell 0.2%, the EuroNext was up 0.8%, the Paris CAC 40 was up 0.8%, while the German DAX rose 0.7%. In Asia, China’s Shanghai Index (SSEC) fell 0.4%, the Tokyo Nikkei Dow (TKN) gained 0.7%, and Hong Kong’s Hang Seng (HSI) rose 0.6%. The MSCI World Index rose 0.6%. And the big winner on the week was Bitcoin, which continues its recent run-up to 4.0% and hitting $40,000.
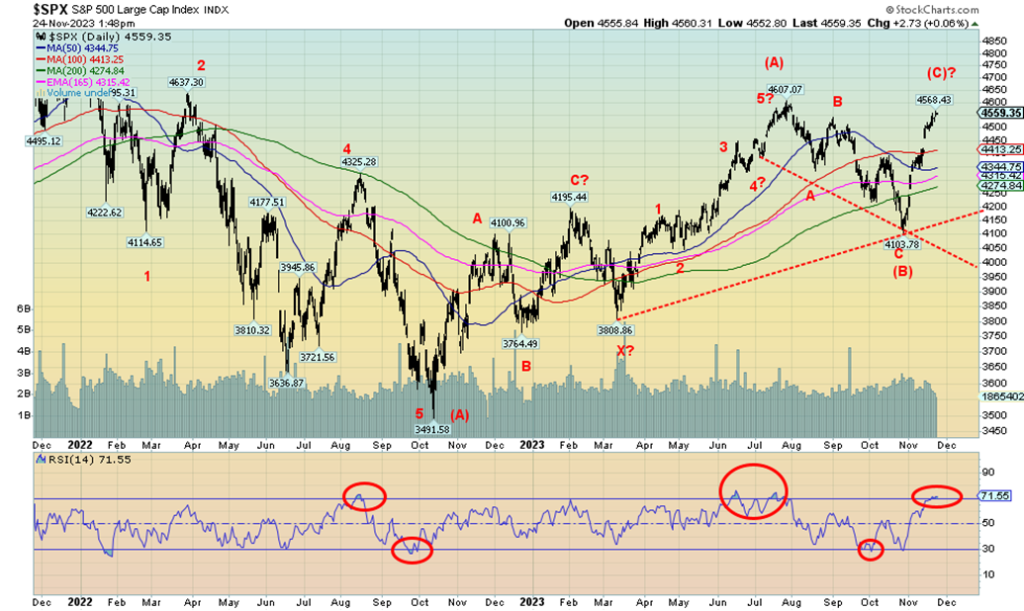
Momentum is beginning to fade in this market and some are getting overbought. The S&P 500 RSI rose to 71.65 this week, signifying overbought. So caution is the word going forward, as a pullback may be in the works. We are getting close to the July high of 4,607 with this week’s close of 4,559. We have noted that on this run, which we believe is a C wave up to complete a larger B wave, we could see new highs above July and even see new all-time highs above 4,818, the January 2022 high. However, we would not be surprised to see only one, maybe two indices make new all-time highs and not everyone a divergence. Straight-up moves like this are usually not sustainable. Volume has not been impressive, and without volume the rally is suspect. And, as we note constantly, the market is running up on the back of seven stocks (The Magnificent Seven): Meta, Apple, Amazon, Google, Microsoft, Tesla, and Nvidia.
That gap has never been threatened. It is between 4,450 and 4,400. If that is ever filled, the rally is most likely over. Below 4,300 it is definitely over. But, in the interim, we could see new highs. December ranks as the third-best month for the stock markets. For the DJI, since 1950 December has recorded 51 up months and only 22 down months. The worst December was 2018 when the DJI fell 8.7%. Later in the month, we get the Santa Claus Rally. More on that in December.
Markets are rising, but they lack oomph. For us, that makes the rise suspicious, but we don’t deny we could see new highs.
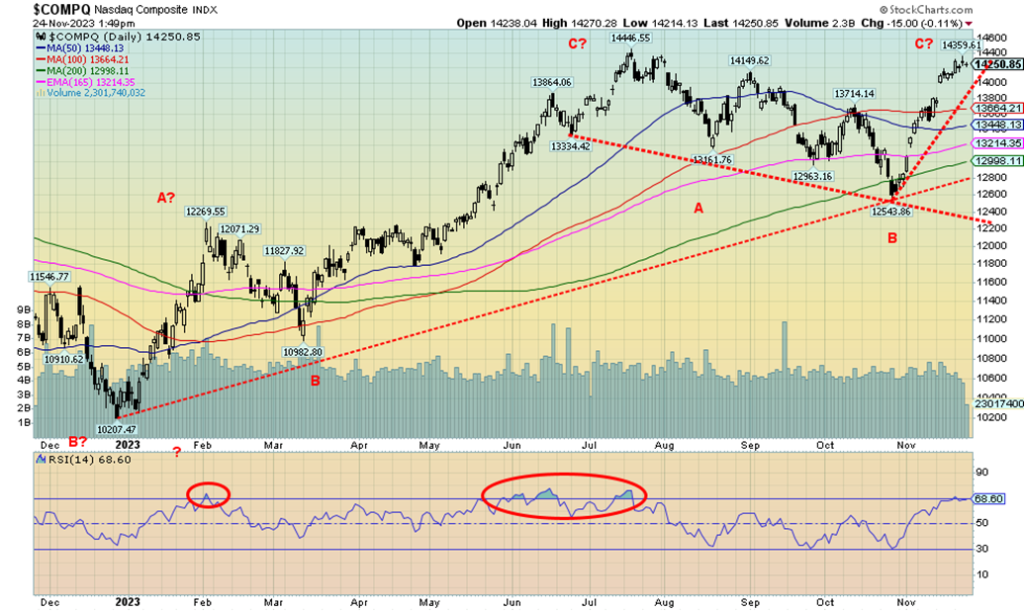
The NASDAQ continues to march higher, mostly thanks to the big seven. The NASDAQ gained 0.9% this past week while the NY FANG Index was up 1.1%. As to the Magnificent Seven, Meta gained 0.8% to new all-time highs, Apple was actually flat to down 0.1%, Amazon gained 1.1%, Microsoft was up 1.8% to new all-time highs, Google gained 0.9%, Tesla was up 0.8%, while Nvidia actually fell 3% after making new all-time highs. A key reversal for NVDA? The big winner on the week was Baidu, up 14.6% while Snowflake jumped 5.6%. That the big seven have been so dominant, one has to wonder how much longer that can last. In 1972/1973 we had the Nifty Fifty. In 2022/2023 we have the Magnificent Seven.
The NASDAQ has been flirting with an RSI at or near or over 70 traditional overbought levels. But we haven’t fallen—yet. Below 14,000 we break down. But we are also not far from the July high of 14,446. We remain well off the November 2021 high of 16,212. The probability of new highs above the July high remains intact. Unless we break under 14,000, threatening the uptrend. Filling that gap down to 13,665 would suggest the rally is over. Under 13,500 we’d confirm the rally is over.
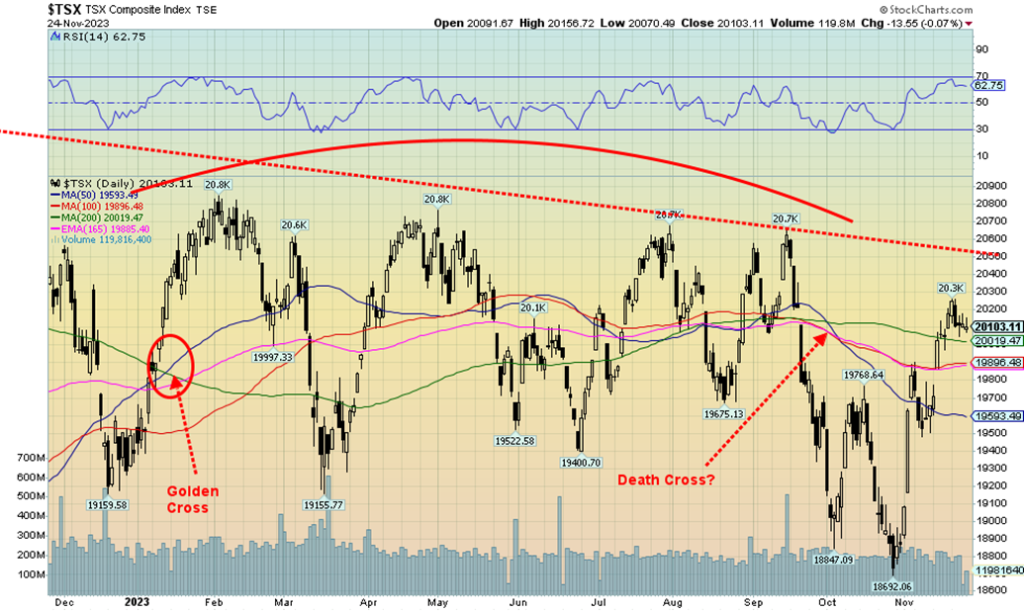
The TSX Composite did not follow the other indices higher this past week. The TSX fell about 0.4%. The junior TSX Venture Exchange (CDNX) gained a small 0.3%. Of the 14 sub-indices on the TSX, only five gained on the week, led by Golds (TGD), up 2.1%. Metals & Mining (TGM) was the only other one to gain over 1%, up 1.4%. Leading the downward thrust was Consumer Discretionary (TCD), off 2.1%. No surprise, given the expectation of lower Christmas sales. Utilities (TUT) fell 1.4%, the only other one to lose more than 1%. Higher interest rates played a role in pushing down TUT. The TSX regained the 200-day MA but is faltering just above it. The TSX remains short of that downtrend line that has held the market in check throughout 2023.
The death cross (50-day MA crossing below the 200-day MA) remains in place, despite the 8.5% gain over the past month. We can’t help but notice the deteriorating volume on this up move. A drop below 19,900 would suggest that a top is in. Below 19,600, the bear market is likely to resume. New highs keep the rebound alive, but the reality is we must take out 20,500, preferably 20,600 to convince us that we are going higher. Given faltering volume, that seems increasingly unlikely but can’t yet be ruled out. Golds, metals, materials remain the best bets while we suspect energy is in the process of bottoming.
U.S. Existing Home Sales, House Price Index 1998–2023
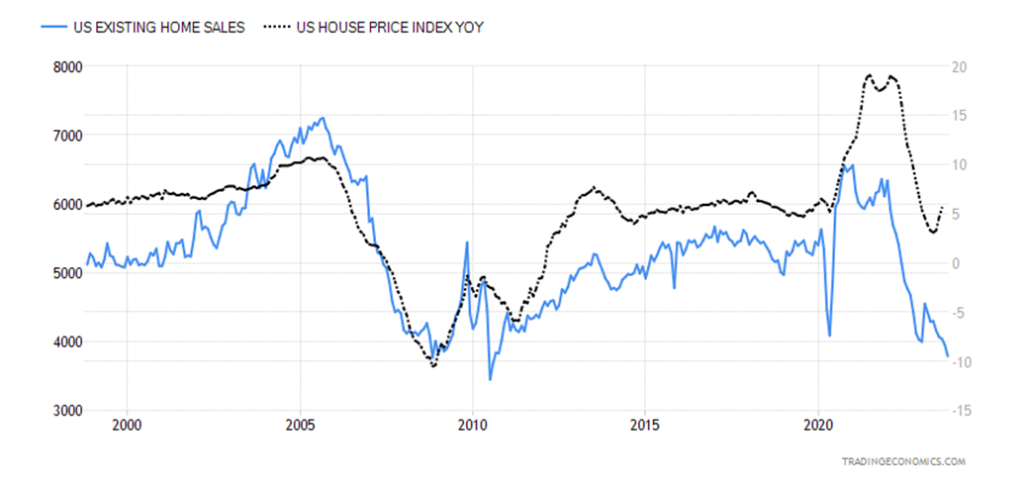
U.S. existing home sales unexpectedly plunged 4.1% in October to the lowest level since August 2010 during the financial crisis. It follows a 2.2% in September. Existing home sales are already down around the lows of the financial crisis and we haven’t even had a recession.
The U.S. house price index is also plunging (in Canada as well), even as it was last reported in August up 5.6% year over year (y-o-y). Sales at the upper end keep the index up. However, in terms of overall rises, it has dropped almost 50% in the past year. And it is better than Canada where it the house index was reported as down 0.8% in the last year to October 2023.
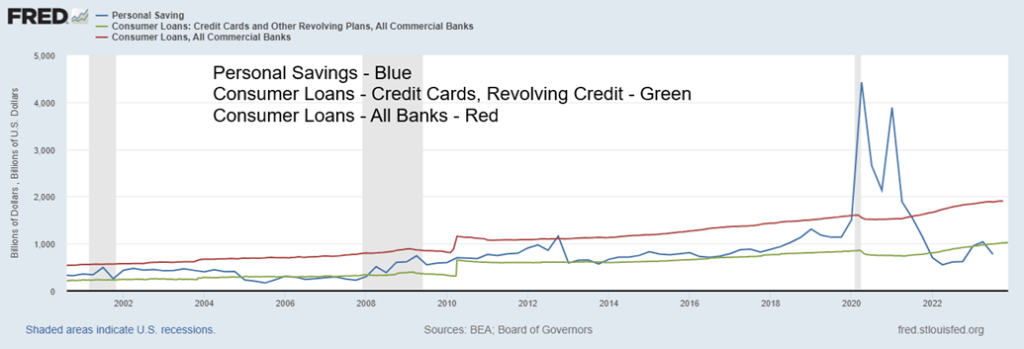
U.S. Personal Savings and Consumer Loans 1998–2023 ($billions)
Canada Personal Savings and Consumer Credit 1998–2023
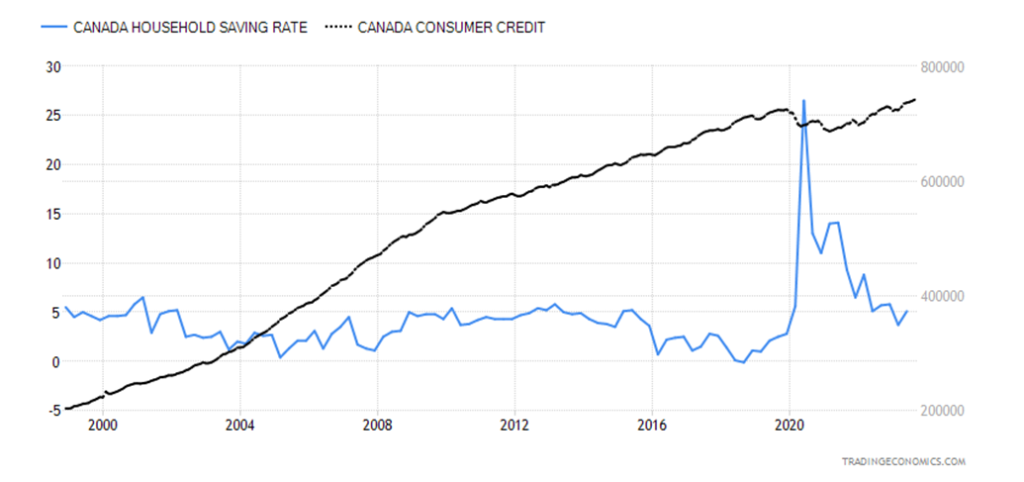
A reminder that savings and the savings rate are falling, following the sharp increase as a result of the pandemic and government supports. At the same time, consumer credit and consumer loans are rising to record levels. Canada’s household debt to GDP is last reported at 103.45% and household debt to income is 180.0%, both amongst the highest in the world. In the U.S., household debt to GDP is 73.6%, high but definitely down from the highs of 2007 as the financial crisis unfolded. Savings down, consumer credit up. Not a good sign.
U.S. 10-year Treasury Bond/Canadian 10-year Government Bond (CGB)
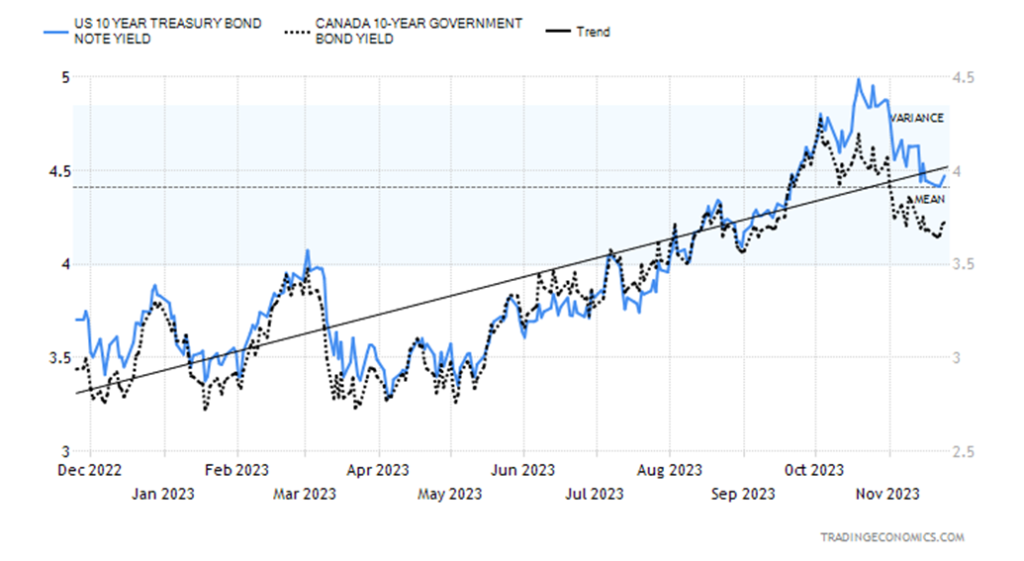
Is the bond rally over? That is a question a few are asking, given that this past week bond yields backed up. The 10-year U.S. treasury note rose to 4.47% from 4.44% while the Canadian 10-year Government of Canada bond (CGB) jumped to 3.72% from 3.68%. The 2–10 inverted spreads were mixed as the U.S. 2–10 rose to 48 bp from 46 bp and the Canadian 2–10 fell to 74 bp from 79 bp. The inverted spreads are still pointing to a recession that most likely won’t get underway until 2024. The rise in rates was a result of what the bond market seems to perceive as ambiguity as to what the Fed might do. While many market participants are expecting rates to be cut in 2024 and that the Fed is finished hiking rates, the bond market seems to be leaving the door open for further rate hikes if required.
The big news on the week was that Canada’s inflation rate for October fell to 3.1% from 3.8% and below expectations of 3.2%. The core inflation rate (less food and energy) fell to 2.7% from 2.8%. We are creeping closer to the BofC’s goal of 2%. Elsewhere, Canada’s housing index fell 0.8% y-o-y in October. In the U.S., existing home sales fell 4.1% in October. The market had expected a decline of only 1.3%. Initial jobless claims unexpectedly fell to 209,000, down from 233,000 a week earlier and below the consensus of 226,000. That helped push yields higher. The Michigan Consumer Sentiment final for November was 61.3 vs. an expectation of 60.4. On Friday, Canada retail sales y-o-y were up 2.7% above the consensus of 2.0% and above last month’s gain of 1.7%.
This week Canada releases its employment numbers, but the U.S. doesn’t until December 8. Canada is expected to have gained 20,000 jobs in November and the unemployment rate is expected to rise to 5.8% from 5.7%. A rise in the unemployment rate would only come with a rise in the number of people looking for work.
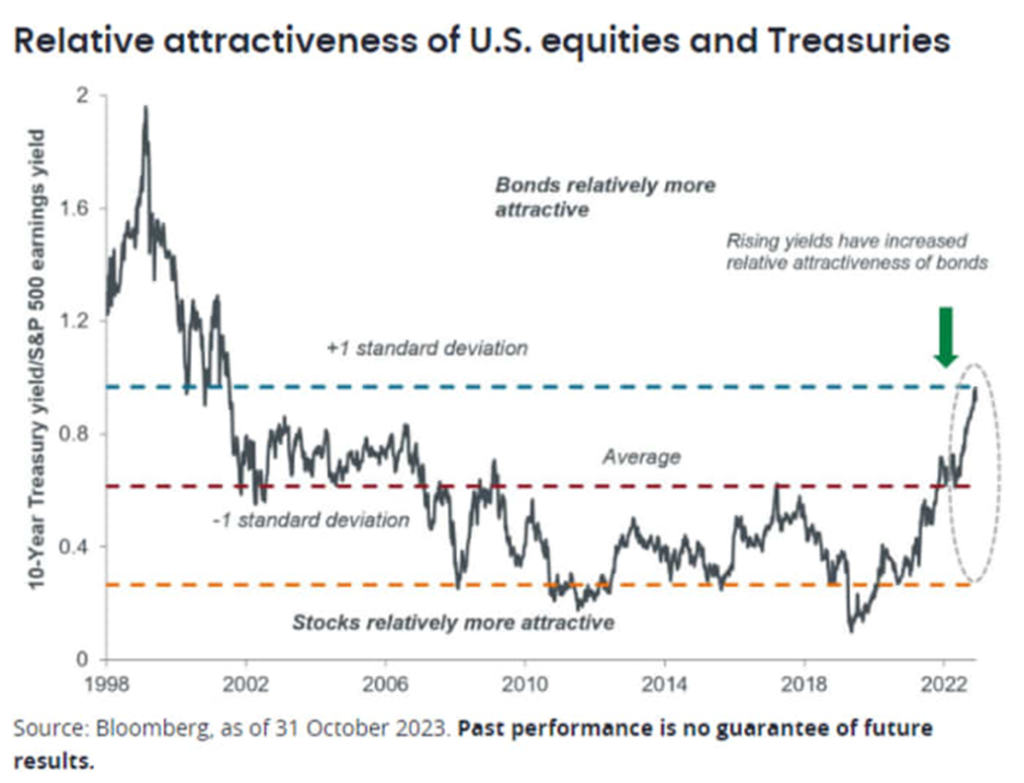
According to this chart from Bloomberg, bonds have become more attractive than equities (stocks). High yields, where the U.S. 10-year treasury note offers a yield of 4.47% vs. low yields, where the S&P 500 dividend yield is 1.51%. High yields where the Cdn 10-year Government of Canada bond (CGB) is 3.72% vs. low yields, with the TSX 60 ETF (XIU) at 0.25%.
Bonds may also offer more stability. If the economy falls into a recession, stocks are vulnerable for further downside. On the other hand, bonds could see yields fall, thus raising the potential for capital gains. None of this suggests that either stocks have bottomed or bond yields have topped. The chart indicates only that bonds are now more relatively attractive than stocks.
Canada CPI vs. Canada 10-year Government of Canada Bond (CGB) 1998–2023
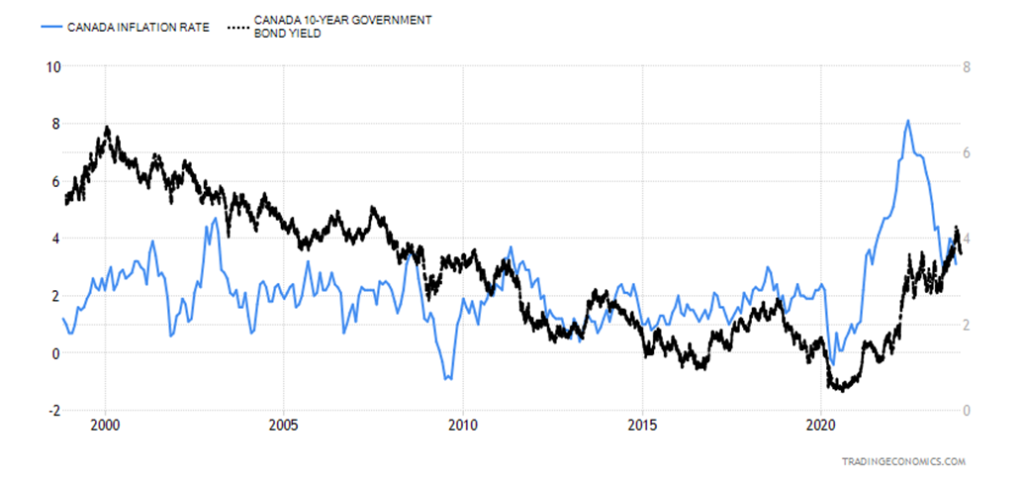
Canada’s inflation rate fell in October to 3.1% from 3.8% in September. The market expected 3.2%. The core inflation rate (ex-food and energy) fell to 2.7% from 2.8%. Price drops were led by transportation (gasoline), health, and, yes, food. But higher mortgage costs pushed up shelter. The CPI rate is now down from a peak of 8.0%. What we note here is that the 10-year rate was consistently below the rate of inflation from roughly 2010 to just recently.
The 20-year and 30-year which impact mortgage rates were even lower. It was during this period and particularly after the pandemic that led to an inflationary rise in housing prices and the stock market. Money was cheap, so borrowed. Now, it is not so cheap and many did not prepare for this day. No wonder the housing market and the commercial real estate market are teetering. Yet bond yields (and inflation) bottomed back during the pandemic. Then both started to rise in 2022. But cheap money was behind the bubble in housing, and the massive borrowing by the consumer where Canada now has one of the highest consumer debt/GDP in the world.
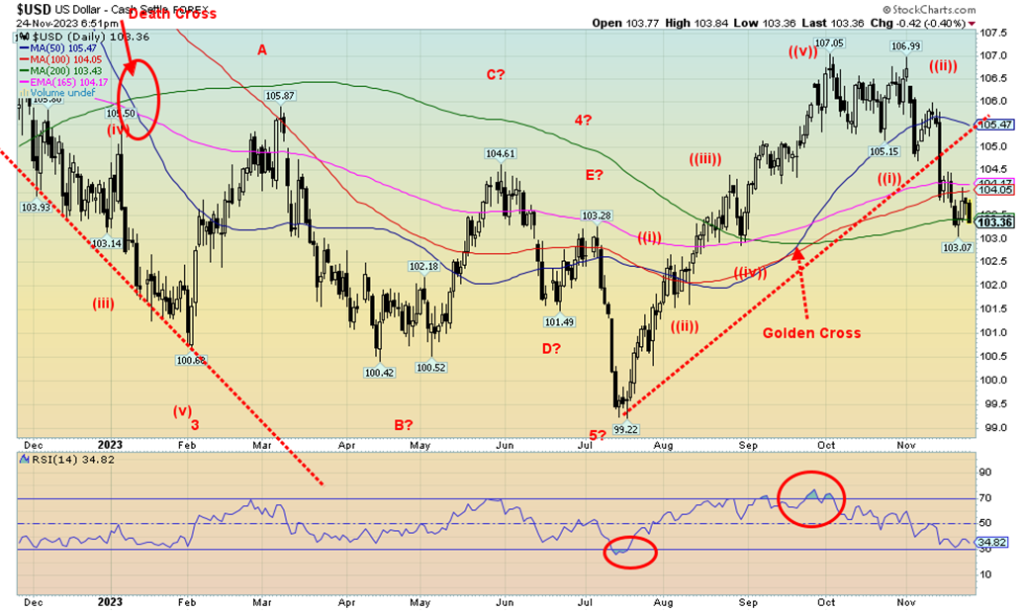
Is the US$ Index breaking down? The US$ Index fell 0.4% and is threatening to break down under 103, a level we have noted that could start a bear market. The euro was up 0.4%, the Swiss franc up 0.5%, the pound sterling gained 1.2%, while the Japanese yen was up a modest 0.2%. The Canadian dollar was a laggard, up only a small 0.1%.
We’ve firmly broken that trend line up from the July low at 99 and now we are threatening to break our key support at 103. The odds are high that we could this coming week. Regaining back above 104 would put the breakdown on hold once again. We are starting to get a bit oversold, but that might not stop a swift decline as we saw last June/July when the US$ Index plunged from 103.29 to 99.22 in seven days. The US$ Index is losing altitude as fears of recession step in, with thoughts of the U.S. cutting rates next year and signs that they have beaten inflation down.
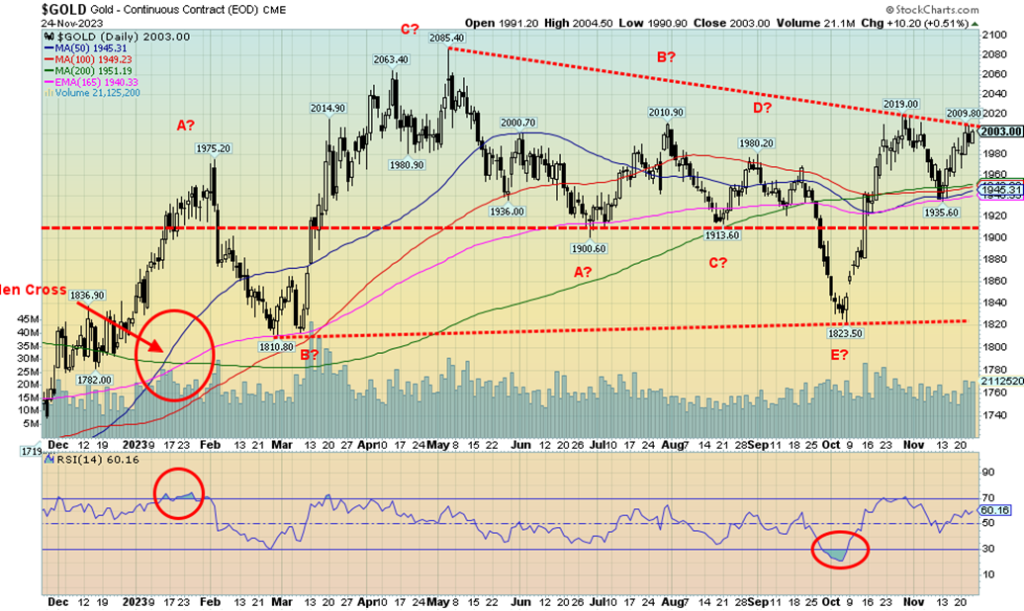
Gold enjoyed a positive week as the US$ Index weakened and fears of a recession which could spark the Fed to cut rates continue to hold. On the good news front, we finally closed over $2,000. But to break out from the recent consolidation, we need to close over $2,020. On the week, gold gained 0.9% and is now up 9.7% in 2023. Silver was up 2.1% and platinum gained 3.9% but is still negative on the year. As to the near precious metals, palladium gained 1.5% while copper was up 1.3%. Palladium has had a terrible year and is down 40.2% in 2023.
Gold is up for the second week in a row. It has also risen for six of the past seven weeks. We are moving into a positive period for gold that potentially lasts into March and the annual PDAC convention. We are up $180 from the October low. A move above $2,025 suggests potential for new highs above $2,089. Breaking out over $2,100, we suspect, may trigger stops and the entry into the precious metals of new players looking for momentum. It’s a small market as we have noted many times and it doesn’t take a lot of buying to see the market move up very quickly followed by periodic bouts of profit-taking.
The big thought for gold is that the Fed is finished hiking rates and that the US$ Index is falling. A falling US$ Index is music for gold. Nonetheless, it is no surprise that we’ve seen numerous fresh all-time highs in for gold in 2023 in other currencies. Of the major currencies, we’ve seen all-time highs in pound sterling, euros, and yen so far in 2023. As to other currencies, they are too numerous to mention. If gold is making all-time highs in other currencies, the odds are high that gold will soon make all-time highs in US$ along with Cdn$ and Swiss francs.
Helping gold is the high consensus that the Fed will not hike rates in December. As well, they are pricing in a 64% chance that the Fed will cut rates by June. We are not overly convinced of that as the Fed tends to be late with both hiking and cutting rates. While recession signs are gathering, we are not in a recession, at least not yet.
While it is encouraging to see a number of bullish forecasts, it is also cautionary. The forecasts are coming from the usual suspects. Once we see the mainstream firms jump on board, then we’ll know we are in a bull market. That in turn could bring in hedge funds and other speculators, as well as the general public. North Americans are generally not huge buyers of gold, unlike China and India. We heard rumours this past week that China has now amassed 33,000 metric tonnes of gold as reserves. Sounds fantastical and we suspect that is all it is – a rumour with no substance. Officially, China holds 2,113 metric tonnes. The U.S. holds 8,133 metric tonnes, the highest in the world. Russia holds 2,329 metric tonnes. Russia and China are ranked number four and five in the world. Canada holds none.
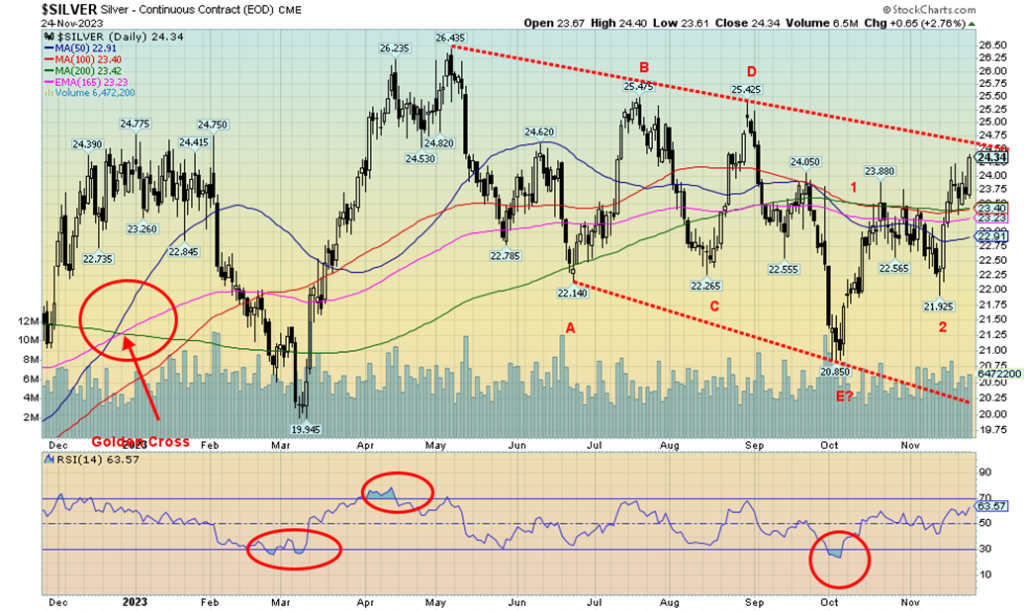
Silver did what it is supposed to do in a bull market this past week—lead. Silver gained 2.1% and is now up 1.3% on the year. No surprise that silver has spent most of the year in negative territory. More significantly, we finally broke out over $24. We still need to clear $25 and $26 to convince us we are going higher. Above those levels, new highs are highly probable. We see lots of bullish reports, but until we break out, we treat it as potential.
There is what appears as a possible head and shoulders bottom pattern on silver. The left shoulder was at $22.27 in August, the head at $20.85 in October, and the right should at $21.93 in November. The neckline appears at $24.50, but we’ll feel more comfortable with a breakout and close over $25. The possible H&S projects up to at least $29. The potential H&S fails if the right shoulder at $21.93 breaks down. The COT report was delayed because of the Thanksgiving holiday.
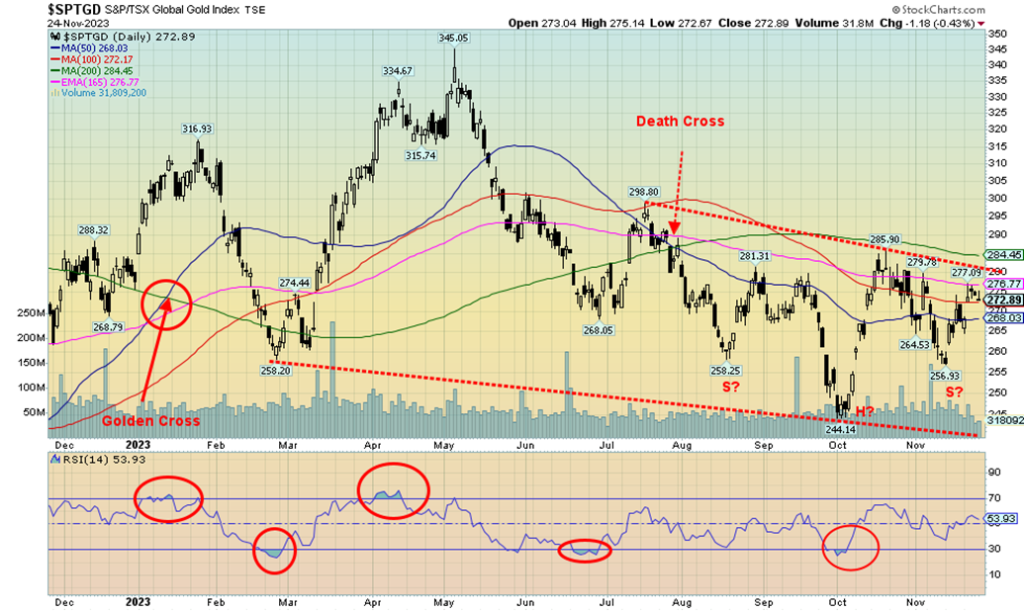
Another positive week for the gold stocks. It is the second week in a row. The TSX Gold Index (TGD) gained 2.1% while the Gold Bugs Index (HUI) was up more, 3.7%. We continue to like the look of the TGD chart with the potential head and shoulders bottom that has been forming. The HUI has a similar look. The TGD projects up to at least 335 if we break the neckline at 280 and get above the 200-day MA at 284. That’s a 23% move from current levels. The bad news is we’d still be under the May high of 345 and well under the all-time high seen in 2011 at 455.
We are seeing some movement on junior gold mining stocks, but that sector remains largely dormant, at some of the worst levels we’ve ever seen. The last time we saw it this grim was in late 2015, which proved to be a significant bottom. The focus has been on AI stocks, meme stocks, and more. But if the focus flips to the gold mining stocks, the move could be significant because it is such a small market. The potential H&S bottom is significant but until it is proven it is just that—potential. A breakdown under 257 the low of the right shoulder would end any thoughts of a H&S breakout.
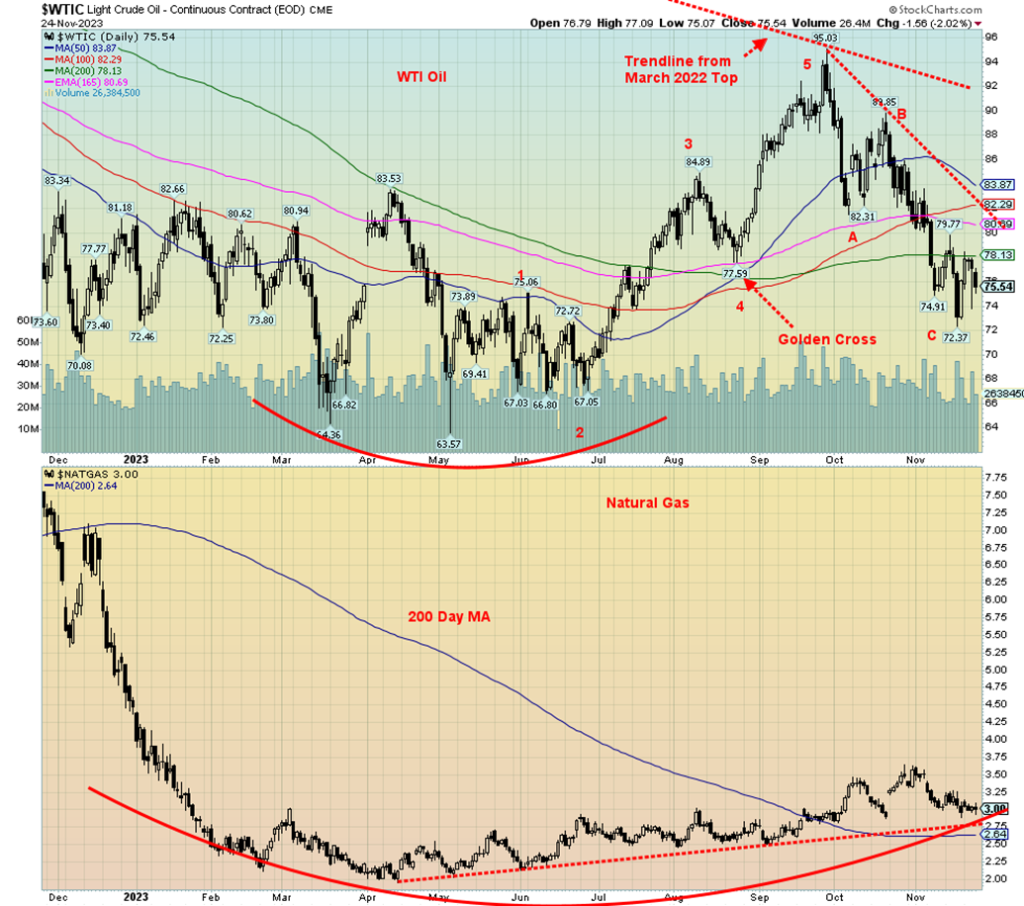
The OPEC + meeting is next weekend, on November 30. As a result, prices didn’t do much this week as they await the meeting. Still, some fears of recession have helped keep a lid on prices. WTI oil fell a small 0.7% this past week while Brent crude dropped a smaller 0.2%. Natural gas (NG) prices actually rose, with Henry Hub up 1.4% and the EU Dutch Hub up 3.6%. After a period of warmer weather, colder weather is now anticipated for both North America and Europe. The energy stocks were mixed as the ARCA Oil & Gas Index (XOI) was up 0.2% while the TSX Energy Index (TEN) fell 1.9%.
We’ll soon be moving into the best period for oil: December–July. We are seeing analysts recommend oil and gas stocks as a result. While we have no confirmed buy signals, we are seeing some divergences between the price action and indicators. That’s a possible sign of a low but not a confirmation. WTI needs to regain above $79 to suggest a low is in. A move above $84 would confirm the low. All that is premised on no new low below $72.25. A move under $71 would suggest that new lows are possible below $63.57. NG continues to hold its uptrend line.
While the U.S. strategic reserves are rebuilding, we noticed that gasoline stocks are sliding. Strategic reserves remain well below peak 5-year averages, suggesting that more could be added.
Our outlook for oil and gas and, by extension, the energy stocks is positive going forward, given demand considerations and positive seasonals. Could we get a surprise at the OPEC + meetings? That is a possibility. We’ve heard talk of an embargo because of the ongoing conflict between Israel and Hamas, but we believe the odds of that happening are extremely low to nil. Demand and weather considerations will drive the price.
__
(Featured image by sergeitokmakov via Pixabay)
DISCLAIMER: This article was written by a third party contributor and does not reflect the opinion of Born2Invest, its management, staff or its associates. Please review our disclaimer for more information.
This article may include forward-looking statements. These forward-looking statements generally are identified by the words “believe,” “project,” “estimate,” “become,” “plan,” “will,” and similar expressions. These forward-looking statements involve known and unknown risks as well as uncertainties, including those discussed in the following cautionary statements and elsewhere in this article and on this site. Although the Company may believe that its expectations are based on reasonable assumptions, the actual results that the Company may achieve may differ materially from any forward-looking statements, which reflect the opinions of the management of the Company only as of the date hereof. Additionally, please make sure to read these important disclosures.
Copyright David Chapman 2023
David Chapman is not a registered advisory service and is not an exempt market dealer (EMD) nor a licensed financial advisor. He does not and cannot give individualised market advice. David Chapman has worked in the financial industry for over 40 years including large financial corporations, banks, and investment dealers. The information in this newsletter is intended only for informational and educational purposes. It should not be construed as an offer, a solicitation of an offer or sale of any security. Every effort is made to provide accurate and complete information. However, we cannot guarantee that there will be no errors. We make no claims, promises or guarantees about the accuracy, completeness, or adequacy of the contents of this commentary and expressly disclaim liability for errors and omissions in the contents of this commentary. David Chapman will always use his best efforts to ensure the accuracy and timeliness of all information. The reader assumes all risk when trading in securities and David Chapman advises consulting a licensed professional financial advisor or portfolio manager such as Enriched Investing Incorporated before proceeding with any trade or idea presented in this newsletter. David Chapman may own shares in companies mentioned in this newsletter. Before making an investment, prospective investors should review each security’s offering documents which summarize the objectives, fees, expenses and associated risks. David Chapman shares his ideas and opinions for informational and educational purposes only and expects the reader to perform due diligence before considering a position in any security. That includes consulting with your own licensed professional financial advisor such as Enriched Investing Incorporated. Performance is not guaranteed, values change frequently, and past performance may not be repeated.


Ecobnb Turns Sustainable Tourism Into Measurable Impact
Ecobnb’s sustainable tourism platform generated significant environmental and social impact in 2025, avoiding 58,207 kg of CO₂ and adding 583...


Sugar Markets Balance Biofuel Demand and Global Supply
Sugar markets in New York and London were mostly unchanged as the Iran conflict renewed interest in biofuels. Drought concerns...


The $40 Trillion Trap: Disinflation Is Not Deliverance
U.S. debt has reached $40 trillion, with $24 billion weekly interest, while deficits accelerate. Despite disinflation in CPI, from cooling...


FinTech Matures as AI and Infrastructure Drive the Next Growth Phase
Fintech markets are entering a mature phase, shifting from rapid growth to consolidation, specialization, and sustainable business models. Zurich and...


Bitcoin, and Ethereum Rise, While Cardano Enters Transition
Bitcoin and Ethereum posted modest weekend gains, supported by ETF inflows. A new proposal may protect Bitcoin from quantum threats....
 |
|
 |  |
 |
|
-
 Markets1 week ago
Quiet Markets Await a Catalyst as Jobs and Oil Support Sentiment
-

 Biotech2 weeks ago
Karyopharm Therapeutics: High-Risk Growth Play in Cancer Drug Development
-

 Crowdfunding6 days ago
Insight Foto Festival Launches €4,500 Crowdfunding Campaign to Support 2026 Edition
-

 Africa2 weeks ago
UCITS Funds Drive Casablanca Market Activity in Q1 2026