Markets
Chaos, Cracks, and Gold: Is a Market Crash Coming?
Chaos reigns as Trump’s presidency faces criticism, Musk slashes jobs, and economic turmoil looms. GDP may contract, unemployment could rise, and consumer confidence is falling. Markets are shaky, with gold historically thriving in such times. Buffett hoards cash, Tesla plunges, and the NASDAQ signals trouble. A crash looms—will gold rise first when dust settles?

We have been longtime subscribers to The Economist magazine. We’ve always appreciated their stance on economic liberalism, particularly free markets, free trade, and globalization. No, we don’t always have to agree with them, particularly their editorial stance, but over the years one appreciates their lack of reporting bias and their editorial fact-checking. It is something we have tried to emulate.
It is probably no surprise that The Economist has come out swinging against U.S. President Donald Trump’s desire for an imperial presidency (“The Would-be King” – The Economist, February 22–28, 2025). He and his administration claim they are there to clear up waste, fraud, and abuse; but, instead, they appear to be taking a wrecking ball approach to anything they don’t like or anyone who doesn’t swear ultimate loyalty to Trump.
He has shattered long-held alliances through threats like wanting to annex Canada and Greenland, and to take over the Panama Canal. He has also threatened alliances in Europe and has withdrawn from a number of international organizations where the U.S. was viewed as a leader. He is largely ignoring the legislature or they are too cowered to challenge him (Republican controlled Congress and Senate), which in turn could lead to a constitutional crisis or autocracy.
He is also threatening judges and threatening to ignore any judicial decision they don’t agree with, including possibly the Supreme Court. Tariffs, budget deficits, and tax cuts are ultimately inflationary. But countering that is an assault on the beaucracy that could lead to a large upswing in unemployment and an economic slowdown. Stagflation?
We are entering a period of economic turmoil and uncertainty. Or, as we’ve said many times, a period of chaos and volatility. Has that happened before? Of course it has, notably in the 1930s, the 1970s, and the 2000s.
What were their characteristics? The stock market crashed (Dow Jones Industrials (DJI)): 1929–1932 down 89%, 1973–1974 down 45.1%, and 2007-2009 down 53.8%. So, if it was dangerous period to own stocks what was the safe haven? No surprise—gold. Gold was fixed during the 1930s, but Homestake Mining HM (today included with Barrick Gold) rose 105% from 1929–1932 during the same period that the DJI was falling 89%.
Eventually HM was up 1,000% by 1936. From 1970 to 1980 gold rose over 1,900% and from 2000 to 2011 gold was up 462%. We are referring to gold the metal and not gold stocks, except in the case of HM during the 1930s. Gold, unlike stocks, has no liability. Gold stocks had strong runs in both the 1970s and 2000s.
Conference Board Consumer Sentiment and Expectations 2007–2025

Consumer sentiment is fading. This is probably no surprise, given what is going on with attempts to fire thousands of federal workers, impose tariffs, and more. The recent Conference Board February report noted that consumer sentiment had its biggest drop since 2021. The expectations index fell below 80, which is usually a threshold for a recession.
Labour market conditions are weakening. Note that initial weekly claims jumped to 242,000 this past week, well above the expected 225,000 and the previous week’s 220,000. The Conference Board’s consumer sentiment came in at 98.3 vs. January’s 105.3 and expectations of 103. Confidence fell across all income levels. This coming week we get the February jobs report and the expectation so far is for nonfarm payrolls to rise 133,000 and the unemployment rate to remain at 4%. Would we be surprised if the numbers were worse? Probably not. Better? Absolutely.
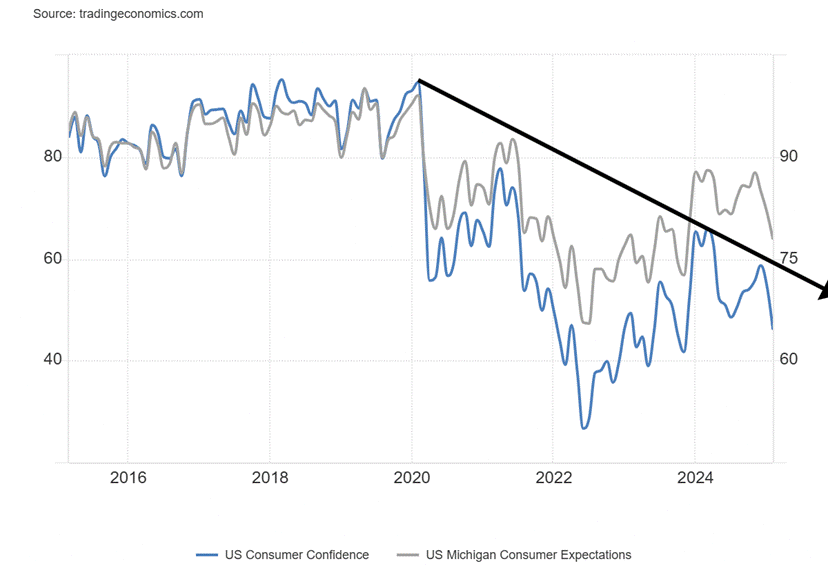
The University of Michigan Consumer Sentiment Index is also falling. The final came at 64.7, well down from the 67.8 that was recorded at the beginning of the month. It was down across all age groups, income groups, and wealth groups. Earlier January retail sales fell 0.9%, far below the expected 0.1% drop. Add in the chaos since January 20, 2025 and no wonder sentiment is falling. Not helping consumer confidence is the slumping housing market. Pending home sales have turned negative. Existing home sales are down sharply, approaching levels seen in 2010, while new home sales are down but not yet near the 2010 and 2020 lows.
University of Michigan Consumer Sentiment and Expectations 2015–2025
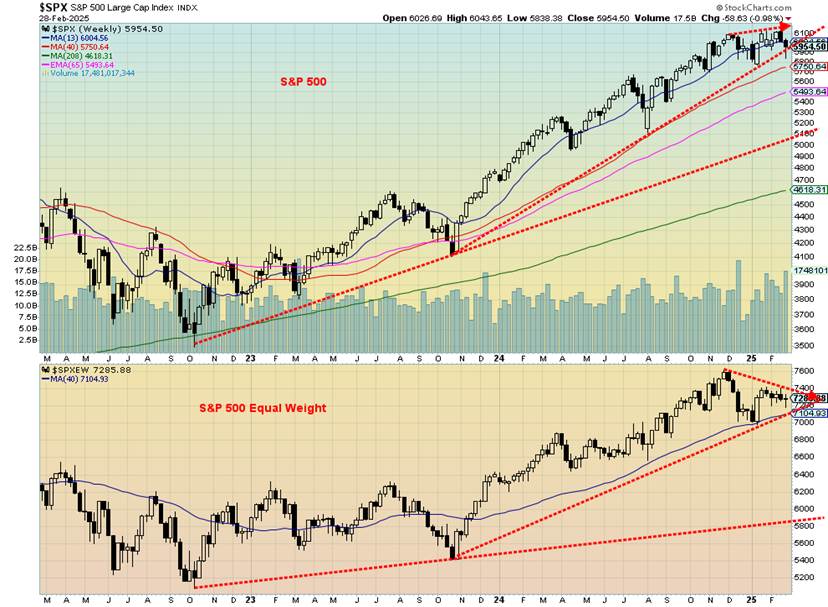
The stock market is now beginning to wobble. After making an all-time high, the S&P 500 has now fallen about 3.1%. It could have been worse except Friday we witnessed a strong rebound. Buying the dip? Or rallying on bad news? However, the S&P 500 did close under 6,000. Next stop could be 5,800 and below that 5,700. The S&P 500 Equal Weight Index has underperformed the S&P 500, making a lower high while the S&P 500 weighed heavily by the MAG7 had made new highs. The S&P 500 Equal Weight Index is now down 4.3% from its high.
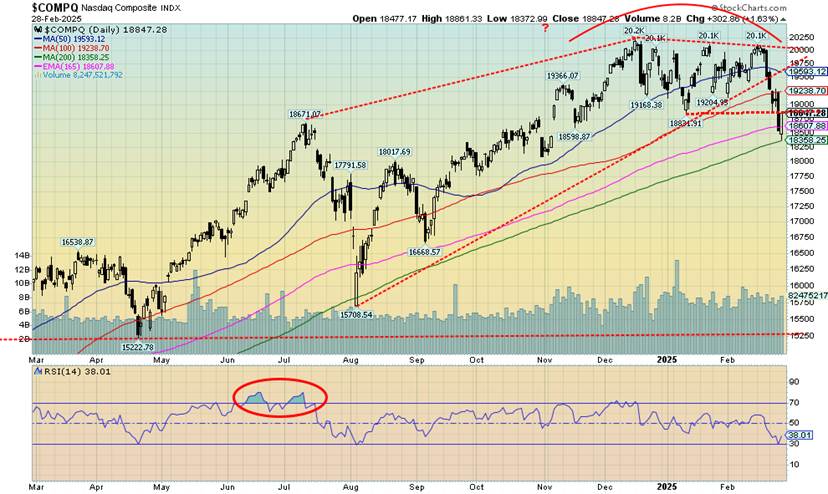
The Dow Jones Industrials (DJI) has fallen about 3% and the NASDAQ, home to the MAG7 and many other tech stocks, is down 6.7%. Of the MAG7 stocks, Tesla has fallen the most, down 40% from its all-time high set in December 2024. That’s solid bear market territory. We suppose the only good news is it is approaching its 200-day MA and is oversold.
Elon Musk may still be the richest man in the world, but his net worth has plummeted by over $100 billion from its high. The other billionaires are also seeing their net worth trimmed. Just so they don’t feel left out, the Dow Jones Transportations (DJT), which continues to diverge with the DJI, is down 12.4% from its all-time high set way back in November 2021.
S&P 500 and S&P 500 Equal Weight 2022–2025
So far, the NASDAQ has been the only major index to break its recent low. The NASDAQ has broken its trendline, up from the August 2024 low, and has now broken its low of January 13, 2025. The S&P 500 up trendline from October 2023 that connects with the August 2024 low was penetrated, but continues to hold for the moment. The January 2025 low remains intact. The NASDAQ has given us a sell signal, despite Friday’s strong bounce back as it came back to the breakdown line.
Gold appears to be correcting its recent run-up to over $2,900. Gold has failed to take out $3,000, with a high thus far of $2,974. We have now broken back under $2,900 and could now have potential targets down to $2,700/$2,750. Interim support would be seen at $2,850 and $2,800. Still, we appear to be on a fresh upward wave from lows seen in November/December 2024. Since then, we are up roughly 12.1%. We maintain targets up to $3,600 but it won’t be a straight-up move. This is the first correction since the lows in December 2024. As noted, we would not want to see a breakdown under $2,700 as that could signal the end of the current bull market.
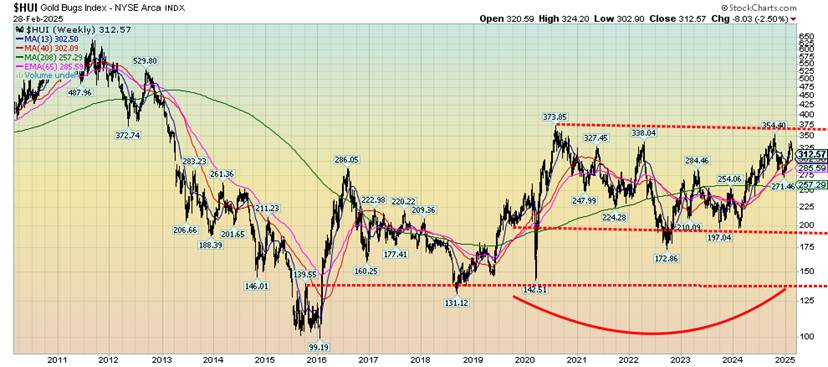
Potentially more compelling are the undervalued gold stocks. While gold has gone to record multiple new all-time highs, the gold stocks remain moribund, undervalued and under appreciated. This is occurring even as they are up from their more recent lows seen in 2023. The Gold Bugs Index (HUI) remains down a huge 51% from its all-time high in 2011. The TSX Gold Index (TGD), on the other hand, is down just over 12% from its all-time high in 2011.
Since 2020 the HUI, the weakest of the two gold stock indices, appears to be forming a large sideways pattern that ranges roughly from 200 to 370. The pattern is shown on the weekly chart below. These sideways patterns tend to be consolidation patterns not topping patterns. Ultimately, it should break to the upside. The breakout point would come at around 375. Potential targets then could be up to 575. The risk is a breakdown under 250. Then the lower end of the sideways pattern could be underway.
Gold Bugs Index (HUI) 2010–2025
The junior gold mining exploration stocks, which trade primarily on the TSX Venture Exchange (CDNX), are even more undervalued. Many are trading under the value of their gold holdings or valuations of under $100/ounce gold in the ground.
The most recent Personal Consumption Expenditures (PCE) prices, which the Fed tends to rely on, showed a gain of 2.5% year over year (y-o-y) which was as expected. That was only marginally better than the 2.6% rise the previous month. Month over month PCE prices were up 0.3% in February, below the expected 0.4%. Still, inflation rates remain sticky and definitely not under the Fed’s target of 2%.
This suggests to us the Fed has little incentive to lower interest rates just yet. We continue to expect a clash at some point between President Trump and Fed Chair Powell. It probably won’t be a pleasant one and it could have a negative impact on the US$ Index, bond yields and the stock market. The Fed is not answerable to the White House or Congress but does report on its operations and outlook to Congress.
The Fed can control the short end of the market but not the long end, which is the purview of the bond market. The bond market cannot be controlled, primarily because it is too big and diverse and there in no one party in charge like the Fed. Right now, the bond market is being helped by the promise to slash the U.S. budget. Currently, the U.S. budget deficit is roughly 6.6% of GDP, the highest in the G7.
A combination of budget cuts and tax hikes could bring the budget deficit more in line. Instead, they prefer to make huge tax cuts that will mainly benefit the wealthy and slash the civil service which could put upward pressure on unemployment as well as disrupting government services. The result is, at least in the short term, is that bond prices are rising, while yields are falling. The question is, will it last?
Globalization had a dampening effect on inflation. De-globalization will do the opposite and could cause inflation to rise, which in turn feeds into the actions of the Fed and the bond market. If the bond market sees higher inflation for a longer time, then inevitably yields will rise and prices will fall. Tariffs, combined with the geopolitics of tariffs, limit the flow of goods and stall the movement of labour.
Tariffs beget tariffs and, ultimately, devastating trade wars that were behind the Great Depression (with the Smoot-Hawley tariffs of 1930). All this tends to make inflation structural, even as the economy may slow as result of rising unemployment. In a word, stagflation.
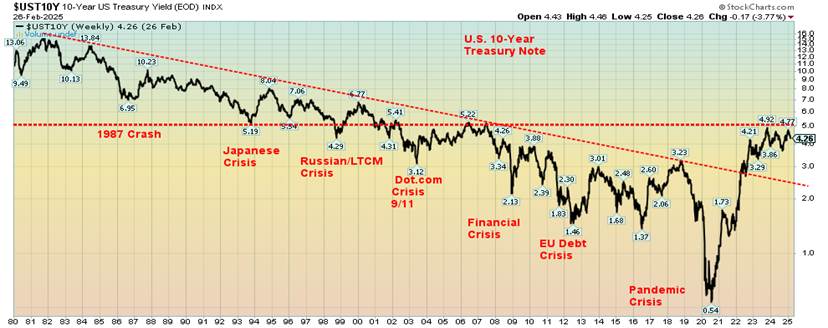
The U.S. 10-year treasury note backed off from 5%. Thus, 5% could prove to be a breakout point if interest rates were to turn back up. We have noted that the U.S. alone has some 33% or about $9.5 trillion of its public debt maturing in 2025. That’s a lot of refinancing. Foreign buyers have been pulling back. As of December 2024 foreign holdings were up $574 billion in the past year. China’s holdings are down $57 billion while Japan is down $55 billion.
China and Japan are the two largest holders of U.S. treasuries. Some of the slack has been picked up by other G7 countries. But if foreigners become nervous about what is going on in the U.S., they could refuse to buy their treasuries or, worse, sell off their holdings for gold, a move that would ultimately put upward pressure on long-term yields but be very beneficial for gold.
10-Year U.S. Treasury Note 1980–22025
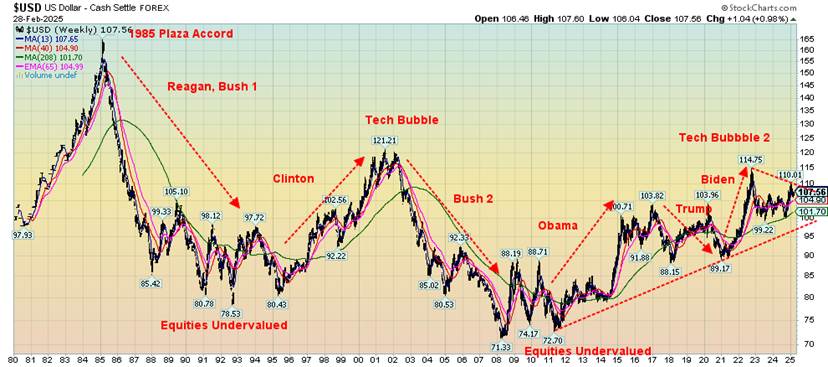
What’s key to watch could be the U.S. dollar. The US$ Index, after topping recently at 110, has fallen roughly 3%. Doesn’t sound like a lot, but in the world of currencies it’s significant. At 110 it was a lower high than the previous high of 114.75. A breakdown of the U.S. dollar, while it could be positive for foreign holders of U.S. debt, could prove troublesome for holders of U.S. treasuries.
While the evidence may be circumstantial, we can’t help but notice that the US$ Index tends to be strong under Democrat administrations and weak under Republican administrations. The US$ Index fell under Reagan/Bush 1, rose under Clinton, fell under Bush 2, rose under Obama, fell under Trump, and rose under Biden. The current Trump administration believes that tariffs are good for the U.S. and a lower U.S. dollar is also good.
US$ Index 1980–2025
Under the Trump administration, things are beginning to implode both domestically and internationally. The actions of the Trump administration are impacting international relations (see the weekend “brawl” between Trump and Zelensky), by pulling out of international institutions such as WHO, and threatening to pull out of the WTO, NATO, and even the U.N.
They are threatening to take over nations such as Canada, imposing tariffs that stall globalization, potentially leading to a severe recession or worse, firing potentially thousands in the U.S. civil service which would not only negatively impact delivery of government services but also directly negatively impact other businesses. It then feeds on itself.
Many are already feeling the negative impacts of the White House’s actions. Unemployment claims are rising, interest rates remain sticky, real estate markets are under pressure, the housing market is faltering, delinquencies are rising on a host of consumer debt, consumer sentiment is falling along with retail sales, commercial real estate is under pressure, and inevitably the banks will be under pressure. Finally as well, protests are rising. Could they turn violent?
Yet on Friday, despite bad news elsewhere and the brawl between Trump and Zelensky, the stock market rose, then it fell, then surged ahead as the DJI finished up 600 points. Volatility reigns. Is Friday’s action a sign we’ve bottomed? Not likely. We are reminded how in 1987 the stock market topped in August, then fell into a low on September 21. September 22 saw the market make a mild new low, then it rebounded with the DJI up over 3%.
Yes, we rallied for the next eight days, but that was it. No new highs. On October 6, 1987, the market turned down sharply and what followed was the record-breaking collapse of October 1987, culminating in the October 19 stock market crash. A crash in March? We are reminded of the gyrations in March/April 2000 when things unraveled for the dot.com/high-tech market of the 1990s.
Today it’s the MAG7 and AI. Friday’s sharp gain for the DJI was only 1.4%. Nonetheless, a 600-point move was dramatic after being down earlier. The DJI is outperforming the other indices in this downtrend. A sign of flight to quality.
The stock market appears to have made a potentially important top, but the major breakdown zones lie ahead. Bitcoin is breaking down, having plunged under $90,000. Even gold is faltering, despite being a safe haven. In past sharp declines, gold has tended to follow the market down, but then it is the first out of the chute. We saw that, especially in the 2008 financial crisis panic and again in the 2020 pandemic crisis. Oil prices are under pressure from a global supply glut and all is quiet for now on the geopolitical front, which could impact oil.
Chaos and volatility continue. But a warning. Warren Buffett dumped all his S&P 500 ETFs, and then Buffett’s company Berkshire Hathaway (BRK.A) made all-time highs. Buffett is sitting on a mountain of cash, even as the broader market of funds, etc. are at their lowest cash position in years.
Markets and trends follow. A lot of red ink this past week.
Markets & Trends
| % Gains (Losses) Trends | ||||||||
| Close Dec 31/24 | Close Feb 28/25 | Week | YTD | Daily (Short Term) | Weekly (Intermediate) | Monthly (Long Term) | ||
| Stock Market Indices | ||||||||
| S&P 500 | 5,881.63 | 5,954.50 | (1.0)% | 1.2% | down | up | up | |
| Dow Jones Industrials | 42,544.22 | 43,840.91 | 1.0% | 3.1% | neutral | up | up | |
| Dow Jones Transport | 16,030.66 | 15,986.49 | (0.3)% | 0.6% | down | up | up | |
| NASDAQ | 19,310.79 | 18,847.28 | (3.5)% | (2.4)% | down | up (weak) | up | |
| S&P/TSX Composite | 24,796.40 | 25,393.45 | 1.0% | 2.7% | neutral | up | up | |
| S&P/TSX Venture (CDNX) | 597.87 | 614.64 | (3.2)% | 2.8% | down | up | neutral | |
| S&P 600 (small) | 1,408.17 | 1,363.73 | (1.1)% | (3.2)% | down | down (weak) | up | |
| MSCI World | 2,304.50 | 2,447.54 | (1.3)% | 6.2% | up | up | up | |
| Bitcoin | 93,467.13 | 84,237.84 | (11.9)% | (9.9)% | down | up (weak) | up | |
| Gold Mining Stock Indices | ||||||||
| Gold Bugs Index (HUI) | 275.58 | 312.57 | (2.5)% | 13.4% | neutral | up (weak) | up | |
| TSX Gold Index (TGD) | 336.87 | 400.17 | (0.6)% | 18.8% | up (weak) | up | up | |
| % | ||||||||
| U.S. 10-Year Treasury Bond yield | 4.58% | 4.21% | (5.0)% | (8.1)% | ||||
| Cdn. 10-Year Bond CGB yield | 3.25% | 2.92% | (6.7)% | (10.2)% | ||||
| Recession Watch Spreads | ||||||||
| U.S. 2-year 10-year Treasury spread | 0.33% | 0.21% | (8.7)% | (36.4)% | ||||
| Cdn 2-year 10-year CGB spread | 0.30% | 0.34% | (12.8)% | 13.3% | ||||
| Currencies | ||||||||
| US$ Index | 108.44 | 107.56 | 0.9% | (0.8)% | down (weak) | up | up | |
| Canadian $ | 69.49 | .6913 | (1.6)% | 0.5% | down | down | down | |
| Euro | 103.54 | 103.74 | (0.8)% | 0.2% | neutral | down | down | |
| Swiss Franc | 110.16 | 110.71 | (0.7)% | 0.5% | up (weak) | down | neutral | |
| British Pound | 125.11 | 125.79 | (0.4)% | 0.5% | up | down | neutral | |
| Japanese Yen | 63.57 | 66.41 | (0.9)% | 4.5% | up | neutral | down | |
| Precious Metals | ||||||||
| Gold | 2,641.00 | 2,848.50 | (3.6)% | 7.9% | up (weak) | up | up | |
| Silver | 29.24 | 31.50 | (4.6)% | 7.7% | neutral | up | up | |
| Platinum | 910.50 | 937.90 | (5.0)% | 3.0% | down | down | neutral | |
| Base Metals | ||||||||
| Palladium | 909.80 | 911.90 | (8.0)% | 0.2% | down | down | down | |
| Copper | 4.03 | 4.55 | (0.2)% | 12.9% | up | up | up (weak) | |
| Energy | ||||||||
| WTI Oil | 71.72 | 69.76 | (0.9)% | (2.7)% | down | down | down | |
| Nat Gas | 3.63 | 3.83 | (10.3)% | 5.5% | up (weak) | up | neutral | |
__
(Featured image by Artem Podrez via Pexels)
DISCLAIMER: This article was written by a third party contributor and does not reflect the opinion of Born2Invest, its management, staff or its associates. Please review our disclaimer for more information.
This article may include forward-looking statements. These forward-looking statements generally are identified by the words “believe,” “project,” “estimate,” “become,” “plan,” “will,” and similar expressions, including with regards to potential earnings in the Empire Flippers affiliate program. These forward-looking statements involve known and unknown risks as well as uncertainties, including those discussed in the following cautionary statements and elsewhere in this article and on this site. Although the Company may believe that its expectations are based on reasonable assumptions, the actual results that the Company may achieve may differ materially from any forward-looking statements, which reflect the opinions of the management of the Company only as of the date hereof. Additionally, please make sure to read these important disclosures.
David Chapman is not a registered advisory service and is not an exempt market dealer (EMD) nor a licensed financial advisor. He does not and cannot give individualised market advice. David Chapman has worked in the financial industry for over 40 years including large financial corporations, banks, and investment dealers. The information in this newsletter is intended only for informational and educational purposes. It should not be construed as an offer, a solicitation of an offer or sale of any security.
Every effort is made to provide accurate and complete information. However, we cannot guarantee that there will be no errors. We make no claims, promises or guarantees about the accuracy, completeness, or adequacy of the contents of this commentary and expressly disclaim liability for errors and omissions in the contents of this commentary. David Chapman will always use his best efforts to ensure the accuracy and timeliness of all information. The reader assumes all risk when trading in securities and David Chapman advises consulting a licensed professional financial advisor or portfolio manager such as Enriched Investing Incorporated before proceeding with any trade or idea presented in this newsletter.
David Chapman may own shares in companies mentioned in this newsletter. Before making an investment, prospective investors should review each security’s offering documents which summarize the objectives, fees, expenses and associated risks. David Chapman shares his ideas and opinions for informational and educational purposes only and expects the reader to perform due diligence before considering a position in any security. That includes consulting with your own licensed professional financial advisor such as Enriched Investing Incorporated. Performance is not guaranteed, values change frequently, and past performance may not be repeated.


The TopRanked.io Weekly Digest: What’s Hot in Affiliate Marketing [++ KuCoin Affiliate Program Review]
X now allows people to block certain topics from their feed. This week, we're going to tell you how to...


Hotel Stay Project Supports Wildlife Conservation in Japan
Iwate Prefecture launched a project linking hotel stays to conservation through Morioka Zoological Park Zoomo. A themed room at Yunomori...


Bitcoin Leads Modest Crypto Rebound Amid Mixed Signals
Bitcoin rose 2 percent to above 77000 as ETFs saw 15 million inflows and April gains of 12.2 percent. Ethereum...


Major Pharma Advances: EU Approvals, Vaccine Progress, and Breakthrough Clinical Results
Johnson & Johnson has EU approval for nipocalimab for generalized myasthenia gravis, showing superior control and sustained benefits. Sanofi reported...


Agential Cannabis 2026 to Drive APAC Market Growth and Global Industry Collaboration
Agential Cannabis 2026 will take place September 23–24 in Bangkok, bringing global experts together to advance the APAC medical cannabis...
 |
|
 |  |
 |
|
-

 Africa1 week ago
Record State Funding Strengthens Support for Moroccan Associations in 2024
-

 Fintech3 days ago
Splint Invest Expands Access to Alternative Assets with Strong Growth and Data-Driven Strategy
-

 Business2 weeks ago
Understanding the Bear’s Eye View: A Clearer Perspective on Market Trends
-
 Biotech9 hours ago
Major Pharma Advances: EU Approvals, Vaccine Progress, and Breakthrough Clinical Results