Markets
Echoes of 2008: Market Highs Mask Mounting Risks
The 2007–08 crash showed markets can ignore warning signs until collapse hits suddenly. Today’s rally echoes that pattern: rising debt, inflated housing, AI-driven bubbles, and persistent inflation despite rate hikes. Government deficits widen, tariffs pressure producers, and only a few mega-stocks sustain gains. Beneath record highs, risks mount—gradual cracks could quickly become crisis.
“How do you go bankrupt? Two ways. Gradually, then suddenly.”
—Ernest Hemingway, American author and journalist; 1899–1961. From his first novel, The Sun Also Rises
We think of this phrase when observing today’s market. Hark back to 2007. We first heard about potential problems in the sub-prime loan market in July 2007. Then two Bear Stearns funds went under. The market hiccupped. But then it came right back and by October we were once again making all-time highs. Leading up to that was financial deregulation, a massive surge in sub-prime mortgage loans that helped push housing prices to dizzying levels, with rules that allowed higher leverage.
However, the housing market actually peaked in 2006, with home sales falling and mortgage delinquencies rising as 2007 unfolded. Still the market, despite setbacks, kept on rising. Until it didn’t anymore.
The Fed actually cut rates in September 2007 because of growing issues in the sub-prime loan market. Still, the market didn’t peak until October. But then it began to fall. Bear Stearns needed loans to stay afloat, but its collapse was staved off when JPMorgan Chase bought it. By January 2008 the Dow Jones Industrials (DJI) was down 18% but it found a low and bounced back as they thought everything was under control. By May 2008 the DJI was back up 12% and everything seemed hunky dory. Then the wheels came off the bus and by September 2008, after the collapse of Lehman Brothers, the DJI was down 54% from the October 2007 top.
Other indices fell more. A recession or worse loomed. The collapse was spreading around the world.
By the time the market made its secondary final peak in May 2008, it had been two years since the housing market peaked. Throughout the period trouble was mounting, but the market paid little heed and kept on rising, despite periodic setbacks. Gradually, then suddenly. Two years of gradual, four months of suddenly. A new Great Depression could be looming. The authorities, along with governments, went into overdrive to prevent a collapse: interest rates to zero and even lower, plus massive piles of liquidity. Even a new term emerged: quantitative easing (QE). The market didn’t make its final bottom until March 2009. It wasn’t until 2013 that the DJI regained its October 2007 high.
We say all this as we watch the stock market continue to move to new highs, despite a deteriorating background. Technically, this market topped back in 2019 with the run-up that preceded the 2020 pandemic crash. Flooding the market with liquidity and lowering interest rates once again to zero or lower helped stave off a collapse. The market soared to new heights and housing prices exploded.
Then inflation struck as the pandemic had sparked supply disruptions, the Russia/Ukraine war broke out in 2022, sparking more disruptions, pent-up demand following the pandemic helped push up prices, and ongoing climate disasters including drought, floods, and wildfires put upward pressure on food prices. Governments also went into QE overdrive during the pandemic to avoid an even bigger collapse. Interest rates collapsed to zero or lower, oodles of liquidity for the markets helped create a stock market bubble in AI stocks, and once again the housing market took off into the stratosphere.
During the pandemic, interest rates were held below the rate of inflation, not just the Fed rate but also 10-year U.S. Treasury notes. Generally, since the 2008 financial crisis, interest rates had been held artificially low and the 10-year U.S. Treasury note had remained low, below the rate of inflation and the core inflation. Add in a huge surge in money following the pandemic to prevent the economy from collapsing and it played a major role in the bubble that followed, along with the surge in inflation in 2022.
Belatedly, the Fed started hiking interest rates, but it wasn’t until April 2023 that the Fed rate finally surged above the rate of inflation. The Fed didn’t start cutting rates until September 2023, which today remain above the CPI by 180 bp. Inflation is lower today than its peak in June 2022, but it remains above the Fed’s target of 2%. Core inflation is even more sticky, currently 140 bp below the Fed rate. And then there was the PPI.
It comes as no surprise that President Trump thinks the inflation rate is too high and the Bureau of Labour Statistics (BLS) is keeping it artificially high. After all, he fired the head of the BLS over the job numbers that came in sharply lower than expected. It’s also no surprise that, once again, Trump is demanding that the Fed cut interest rates now to spur economic growth. The suggestion is to cut up to 150 bp from the current 4.50% to 3.00%. Yes, economic numbers are showing a slow deterioration. No, the inflationary impacts of the tariffs have not as yet kicked in. But one thing that is rising is the government debt.
The budget deficit for July was $291 billion. Tariffs added in $21 billion, but spending far outstripped revenues. The budget deficit for the year is expected to be $2.0 trillion, an increase from 2024.
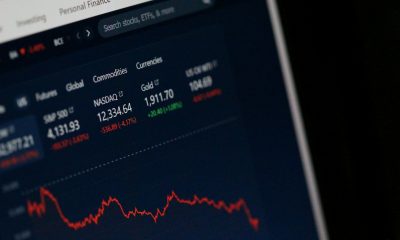
CPI, Core CPI, Fed Rate, 10-Year Treasury Note 2020–2025
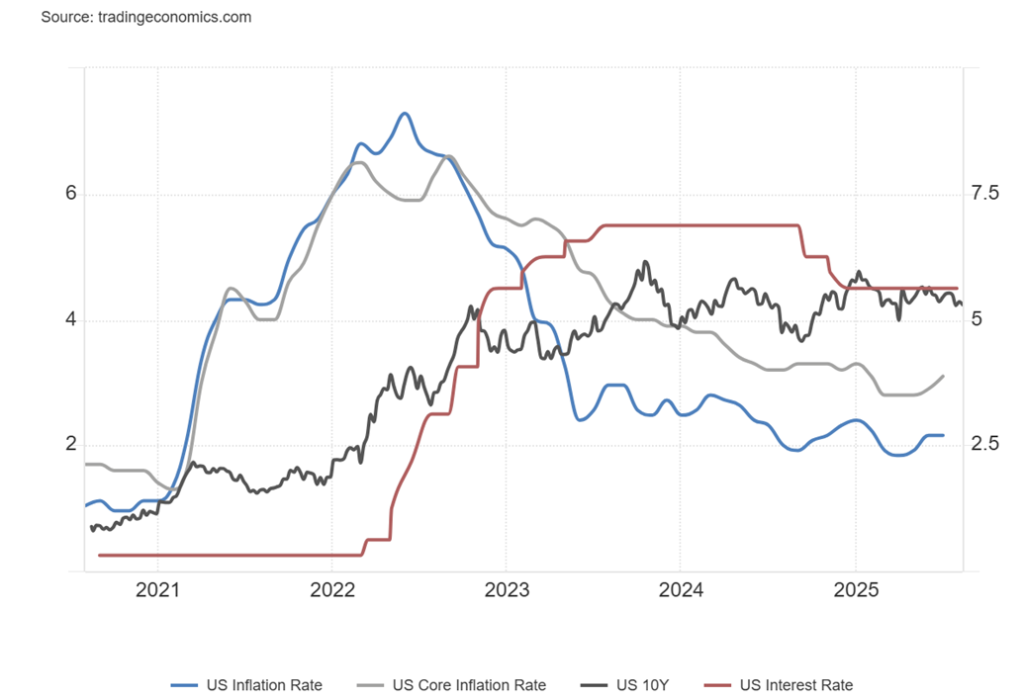
In this chart, note that the current Fed rate and the 10-year Treasury note yield are above the rate of inflation. That wasn’t always the case and throughout the 2000s, especially after the 2008 financial crisis, interest rates remained below the rate inflation. Yes, there were brief periods where interest rates did go above it. The super-low rates, coupled with ongoing QE operations, helped fuel the eventual bubble in stocks and housing.
Now, finally, we have what we’d call a normal yield curve with interest rates above the rate of inflation. That in turn has helped prick the housing market, even as the stock market continues to rise. The stock market, however, continues to be dominated by about 10 stocks: the MAG7 and FAANGs. Strip them out and the stock market is not doing anywhere nearly as well.
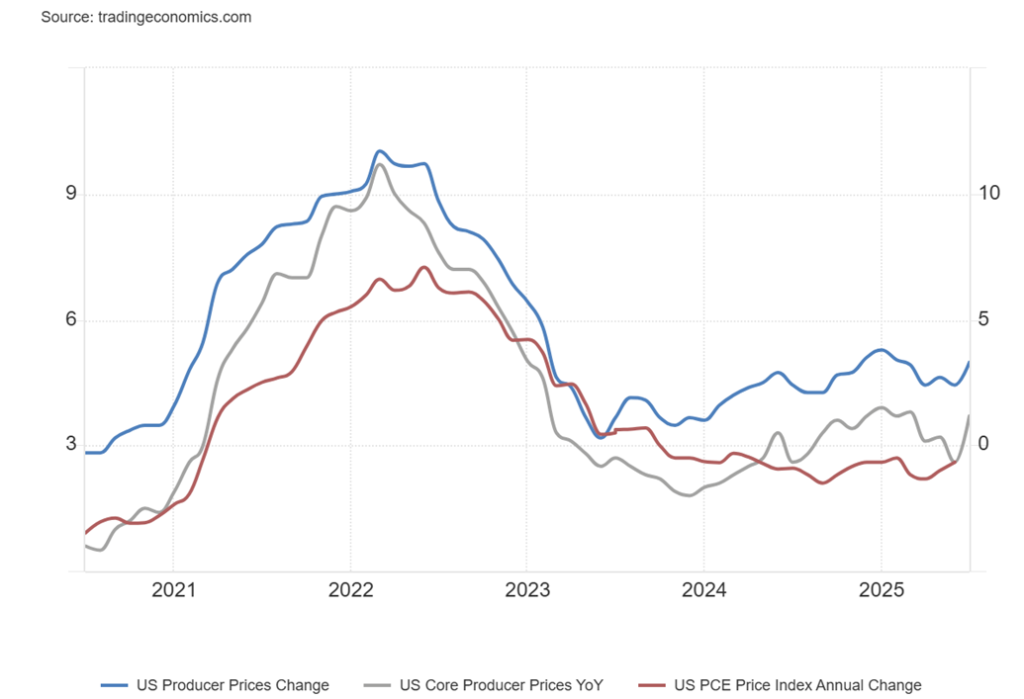
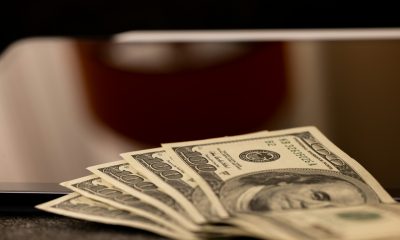
Then along came the PPI. In a way, it was a bit of a shock. The market expected a month-over-month (m-o-m) rise of 0.2%. They got 0.9%. Year over year (y-o-y), they expected 2.5% but got 3.3%. The core PPI also shocked. Expectation was an m-o-m rise of 0.1%. They got 0.9%. And, y-o-y, they expected 2.7% but got 3.7%.
The PPI is the first line against the tariffs, and with these numbers it appears the tariffs are beginning to hit the economy. It’s a matter of when, not if, it also shows up in the CPI and has a negative impact on the economy and the labour market. Nonetheless, the president still holds on to the fantasy that other countries pay the tariff. No, they don’t. Companies in the U.S. pay the tariffs and eventually they pass that additional cost on to the consumer.
Surprisingly, however, the retail sales are still good. The consumer is still spending. They expected a monthly rise of 0.4% but got a rise of 0.5%. Y-o-y, they expected 3.5% rise and got a 3.9% rise. Yippee. But notably, the Michigan Consumer Sentiment Index took a hit and fell to 58.6, down from 61.7 and below the expected 60.5. Inflation expectations rose. Consumer sentiment today is down around levels seen during the 1980-1982 recession, the 2008 financial crisis and the 2020 pandemic. Note that curl-up in the PPI. We await the Personal Consumption Expenditures (PCE), an inflation measure followed closely by the Fed. PCE prices come out in the last week of August. But even the PCE prices are showing an uptick.
PPI, Core PPI, PCE Prices (June only) 2020–2025
All this could put the Fed in a quandary over what to do at the September 16-17 FOMC. Do they lower rates, even as inflation is picking up as many had expected? Or do they now hold the line? Jackson Hole, the annual central bank symposium is August 22. That annual brouhaha could provide a clue as to what the Fed might do. Fed Chair Jerome Powell is the keynote speaker.
Understandably, the U.S. wants lower interest rates. After all, with $37.2 trillion federal debt—the highest in the world—interest payments on that debt now exceed $1 trillion, more than they spend on defense. So lower interest rates would help. But the U.S. is not helping itself as the debt is expected to grow over the next few years because of tax cuts and more. Yes, tariffs are bringing in revenue, but in billions, not the trillions reiterated by the president. The budget deficit for July was $291 billion. So far this year the U.S. has racked up $919 billion and the forecast is for a $2 trillion deficit.
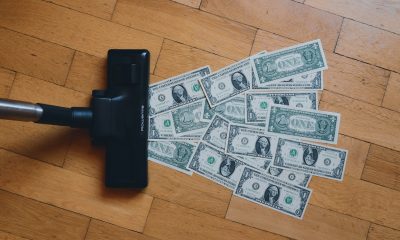
U.S. Budget Deficit, U.S. Debt 2020–2025
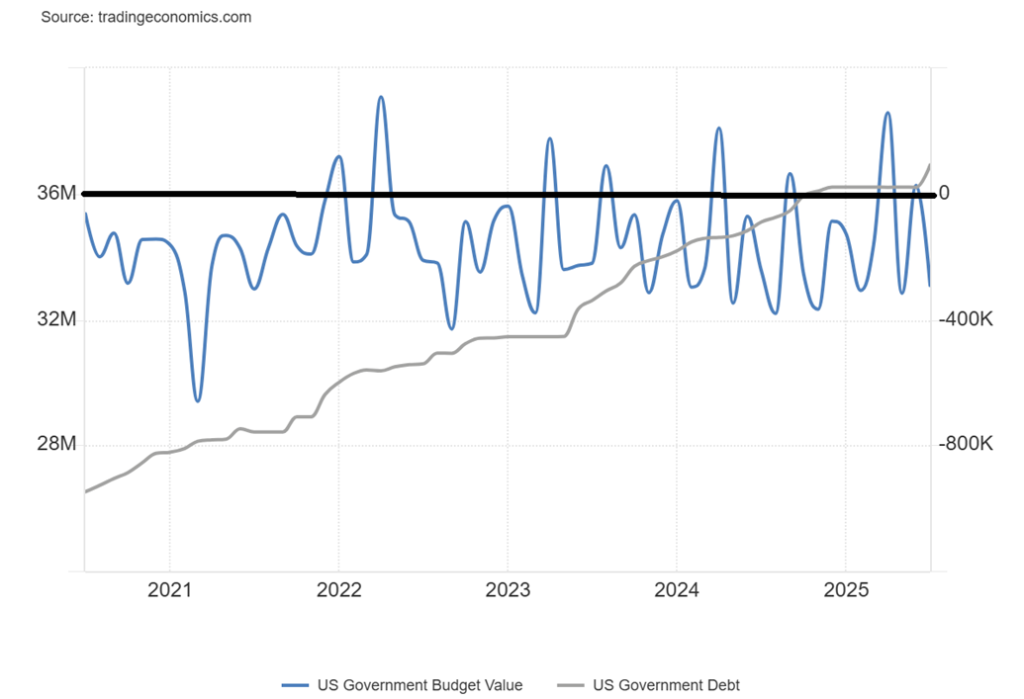
In the preceding chart, we show the monthly budget deficit vs. the growth in the U.S. federal debt. Since 2020, the U.S. federal debt has gone up $10.7 trillion, meaning 28% of the debt has been added in just the past five years. Grant you, it exploded as a result of the pandemic and although it rose slower in 2022–2024, it still rose. Now it is starting to accelerate again and the expectation is that U.S. debt could reach $47 trillion debt by 2029, up another $10 trillion in just four years.
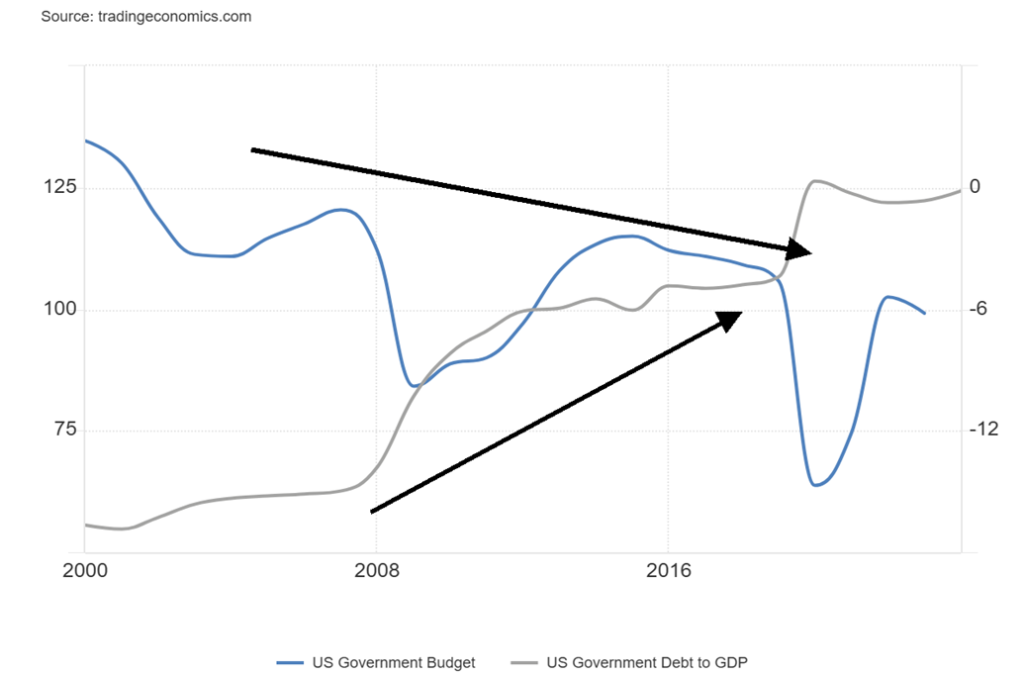
It’s astounding. Since 2000 the U.S. federal debt has not only grown by $31 trillion but the federal debt to GDP has risen from 56% to 124%. The U.S. debt to GDP is now one of the highest in the world although, no, not the highest in the G7. That belongs to Japan. The budget deficit to GDP now stands at 6.2%, the highest in the G7 by far.
Canada is at 1.9%. For the U.S., debt is rising while the budget deficit to GDP is also rising. The big drops were seen during the 2008 financial crisis and the pandemic when the budget deficit to GDP soared to 9.8% and 14.7% respectively. In 2000 there was a budget surplus and the surplus to GDP was 2.3%.
Against this background, inflation is now rising, not falling. The impact of the tariffs is starting to be seen with the release of the July PPI. As we said—gradually, then suddenly. We await the suddenly.
Chart of the Week
Super Bears 1900–2025
| Period | # Days | Decline | What happened |
| June 17, 1901–November 9, 1903 | 875 | 46.1% | Panic of 1901, McKinley assassination |
| January 19, 1906–November 15, 1907 | 665 | 48.5% | Rich man’s panic, global financial crisis |
| November 21, 1916–December 19, 1917 | 393 | 40.1% | WWI crash |
| November 3, 1919–August 24, 1921 | 660 | 46.6% | Post-war depression |
| September 3, 1929–November 13, 1929 | 71 | 47.9% | 1929 stock market crash |
| April 17, 1930–July 8, 1932 | 81 | 86.0% | Great Depression |
| March 10, 1937–March 31, 1938 | 386 | 49.1% | Great Depression part II |
| September 12, 1939–April 28, 1942 | 959 | 40.4% | WWII crash |
| December 3, 1968–May 26, 1970 | 539 | 35.9% | Vietnam War crash, inflation |
| January 1, 1973–December 6, 1974 | 694 | 45.1% | Arab Oil Embargo, Watergate |
| August 25, 1987–October 19, 1987 | 55 | 36.1% | Black Monday, October 19, 1987 crash |
| October 9, 2007–March 9, 2008 | 517 | 53.8% | 2008 global financial crisis |
| February 12, 2020–March 23, 2020 | 40 | 37.1% | COVID pandemic crash |
| Average: | 456 | 47.2% |
Bear markets can be short, swift, and sharp or they can be drawn out and slow—decline, decline, decline. Since 1900 there have been 13 super bears: bear markets that fell more than 35% in one swoop. They have occurred roughly every 8.6 years; however, most of them occurred between 1900 and 1942 when we had eight super bears. We’ve had only five since and there was 26 years between the first group that saw its last one end in 1942 and the second group that saw it start in 1968. It is almost as if we are dividing them into two eras. The second era is our current one that got underway in 1968.
The shortest was the 2020 pandemic collapse, lasting only 40 days, while the longest was the World War II collapse that started in 1939 and didn’t end until 1942. It lasted 959 days. The steepest collapse was the Great
Depression that started in 1930 and ended in 1932 as the Dow Jones Industrials (DJI) fell 86.0%. We normally
think of the Great Depression bear as getting underway in September 1929. However, that does leave out the bull that got underway with the initial low in November 1929, lasting until April 1930 before the long descent got underway. Coincidently, the Smoot-Hawley Tariff Act was passed June 17, 1930. It was a major factor in the subsequent stock market collapse and the Great Depression. Does history repeat itself? Today, tariffs are as high or higher than they were under Smoot-Hawley.
Worth noting in the preceding table is that the high-tech/dot.com bear did not make the list. That’s because that collapse occurred in two parts. The first part lasted from January 2000 to September 2011 and included the 9/11 crash. The DJI fell 29.7%. It was followed by a rebound into February 2002 before the second part got underway. That one lasted until October 2002 as the DJI fell 31.5%. Altogether, it lasted from January 2000 to October 2002 and the DJI fell in two waves 37.8%. Other indices, particularly the NASDAQ, fell more, down 78% during the same period.
We also get super bulls where the stock market goes up over 100%. Since 1900 there have been nine of them. The best bull was the Roaring Twenties bull from March 1923 until September 1929, lasting some 2,138 days and gaining 344.5%. However, that wasn’t even the longest bull. The high-tech/dot.com bull got underway in July 1990 and lasted until the Russian/LTCM collapse of October 1998. That bull lasted 2,836 days and gained 294.8%. As we know, both ended badly. The current bull market got underway with the “Liberation Day” low on April 7, 2025. As we go to print the S&P 500, NASDAQ and now the DJI are all making fresh all-time highs.
The “Liberation Day” bear was short, only 66 days, and saw the DJI lose almost 19%, just shy of an official bear market. The other indices S&P 500 and NASDAQ fell more. The high for the DJI was actually made last December 2024. It was only this past week that the DJI finally made a new all-time high.
Could we have another super bear? Yes, it is possible. But we note previous ones were sparked by either an economic collapse, a banking crisis, or global shocks. We note that the Great Depression was sparked by the trade wars, the 1974 collapse was sparked by the Arab oil embargo and Watergate, while the 2008 collapse was a systemic global financial crisis highlighted by the collapse of Lehman Brothers.
Today we have potential trade wars à la the 1930s as well as a growing authoritarian takeover of the U.S. We also have unresolved wars that could spread further. So far, we have not yet had the systemic shock. Will we? We suspect we would need a financial shock or a geopolitical shock to trigger that. The massive amount of debt outstanding led by the U.S. is what many believe to be a disaster waiting to happen. Unresolved wars (Russia/Ukraine) (Israel/many others) could be flashpoints if things got out of hand, triggering a broader war that has already seen NATO heavily although indirectly involved in the Russia/Ukraine war. Despite accusations of genocide in Gaza the U.S. continues to back Israel even as Israel also spars with Lebanon, Yemen and Iran. Lately even Syria has felt Israel’s wrath.
It seems that every generation experiences its stock market crashes, in particular super bears. We noted that since 1900 a crash has occurred roughly every 8.6 years. Yes, there was the long hiatus between 1942 and 1968 as the world experienced the post-war boom. Since 1968 we’ve seen a super bear roughly every 12 years.
The last one was only five years ago. However, the conditions for a crash are building.
S&P 500
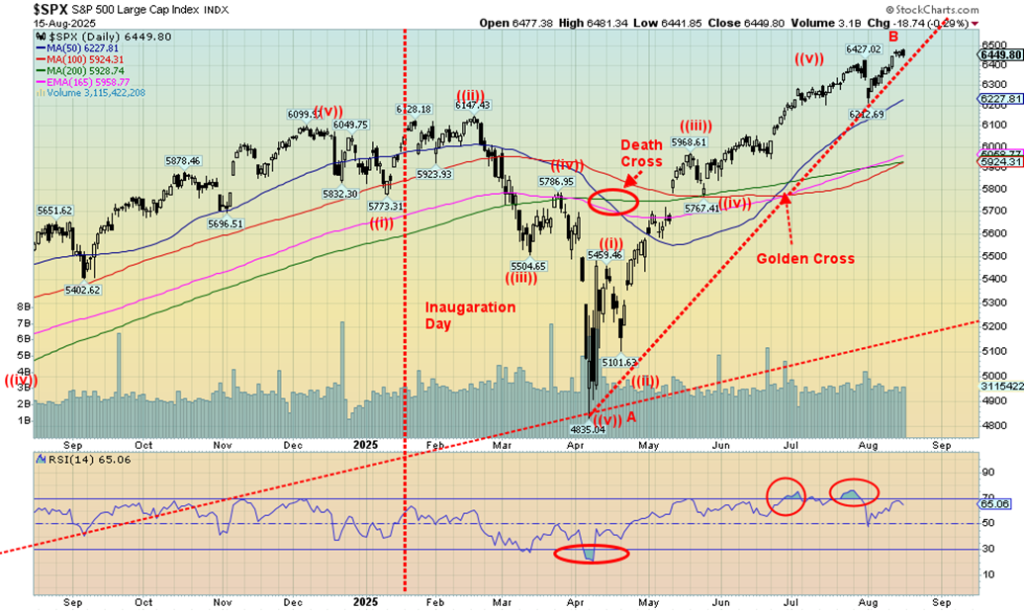
Maybe it’s becoming boring. The stock market just keeps on chugging higher. The records continue to fall. The S&P 500 gained 0.9% this past week, another all-time high. And, surprise, the Dow Jones Industrials (DJI) also finally made new all-time highs, up 1.7%. The Dow Jones Transportation (DJT) may be moving higher, but it severely lags the DJI, a major divergence. The DJT gained 2.1% this past week. The NASDAQ, thanks to the MAG7, made another all-time high, up 1.1%. The S&P 500 Equal Weight Index had a good week, up 1.5%, but is well short of a new all-time high. The NY FANG Index did make all-time highs again, up 0.9%. The S&P 400 (Mid) was up 1.7% and the S&P 600 (Small) gained 3.2%, but both remain well short of all-time highs.
The most interesting was the outside day reversal (key reversal?) that Bitcoin had, although it still managed to gain 0.6% and make that all-time high over $124,000. But Bitcoin closed just over $117,000. In Canada, the TSX Composite continued its all-time high, up 0.5%, and the TSX Venture Exchange (CDNX) also gained 0.5%. Leading the way for the TSX was TSX Health Care (THC), up 12.8%. However, given their small stake in the TSX, it required the Financials (TFS), Metals & Mining (TGM), and Materials (TMT) all making all-time highs to drag the TSX up. Information Technology (TTK) also made all-time highs but reversed and closed down 3.7%. Not a good sign.
As to the MAG7/FAANG stocks, Meta, Nvidia, and Broadcom all made all-time highs. Nvidia makes up about 8% of the S&P 500 and its $4 trillion-plus market cap makes it the fourth largest in the world, behind Germany but ahead of Japan. Germany is in its sights.
In the EU, the London FTSE made all-time highs, up 0.5%, the Paris CAC 40 was up 2.5%, the German DAX gained 0.8%, and the EuroNext gained 2.1%. In Asia, China’s Shanghai Index (SSEC) made new 52-week highs, up 1.2%, Japan’s Nikkei Dow (TKN) made all-time highs again, up 3.7%, and Hong Kong’s Hang Seng (HSI) made 52-week highs, up 1.7%. Stock markets around the world all keep rising.
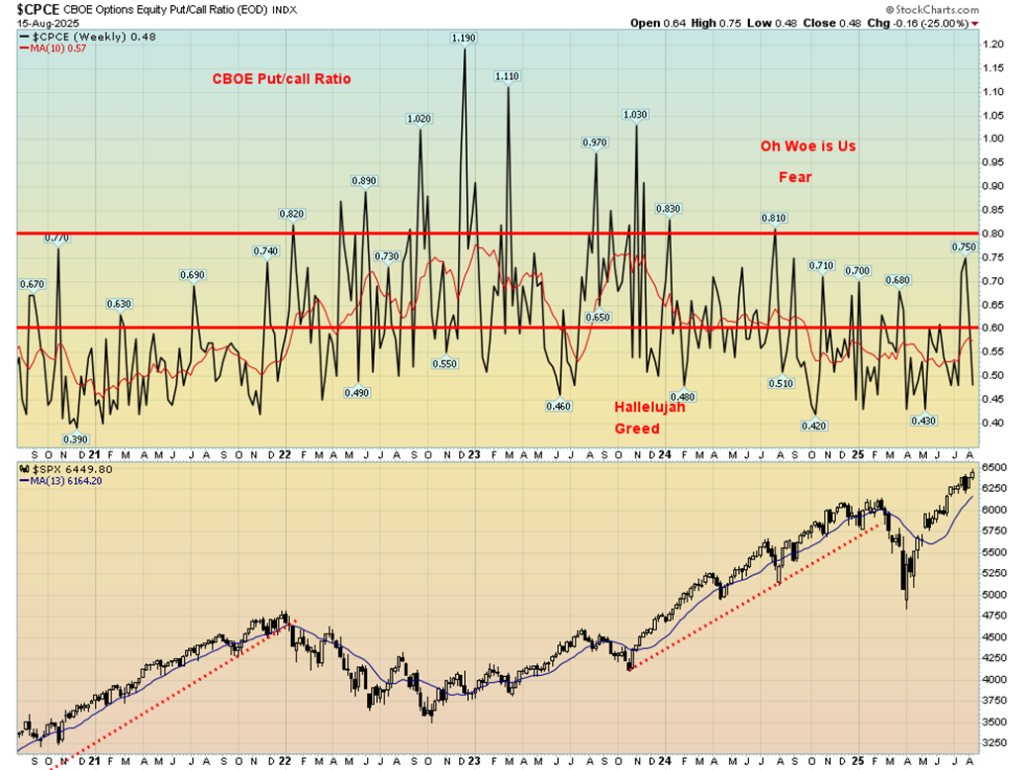
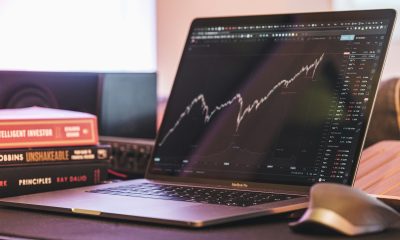
The S&P 500 wiped out that key reversal day seen a couple of weeks ago by once again making all-time highs. But, as a reminder, it is basically about 10 stocks that are doing it while the rest languish. Friday once again saw a reversal day for the S&P 500 as it made all-time highs again but closed down 0.3%. A sign of a top? If we break under 6,200, we’ll know a top is in. Under 5,900 we break the 200-day MA. New highs/new lows badly lag its level seen in November 2021 and again in November 2024. Not a good sign. Other indicators also continue to lag and are diverging with the price action of the S&P 500. The CNN put/call ratio is demonstrating extreme greed. Not good signs as the underlying market continues to deteriorate, even as we make new highs.
It’s all warning signs, but we have to await confirmations as in a break under 6,200. Friday’s action in the S&P 500 was also negative, but we’ll see if there is downside follow-through this coming week. The biggest event of the week is the Jackson Hole symposium where all eyes will be on Fed Chair Jerome Powell as they look for any hints the Fed will cut in September. Or has the PPI spooked them?
CBOE Put/Call Ratio 2020-2025
The Scorecard
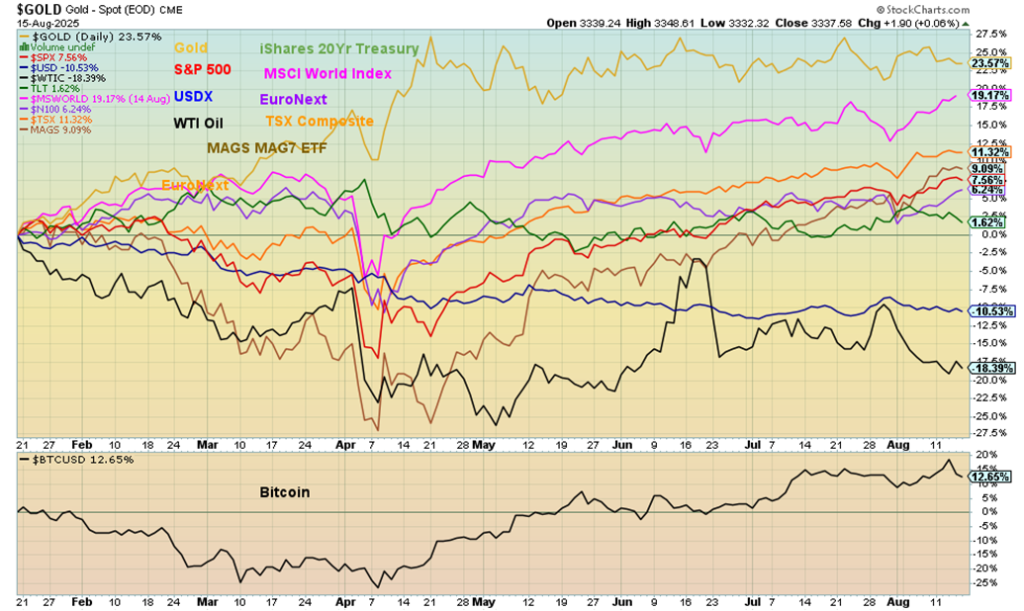
It’s no surprise that gold continues its lead since January 20, 2025, up 23.7% despite a rather flattish/down week. The MSCI World Index (ex USA) remains solidly in second place, up 19.2%. WTI oil remains the worst performer, down 18.4%, with the US$ Index next, down 10.5%. None of the others noted are in negative territory.
Bitcoin
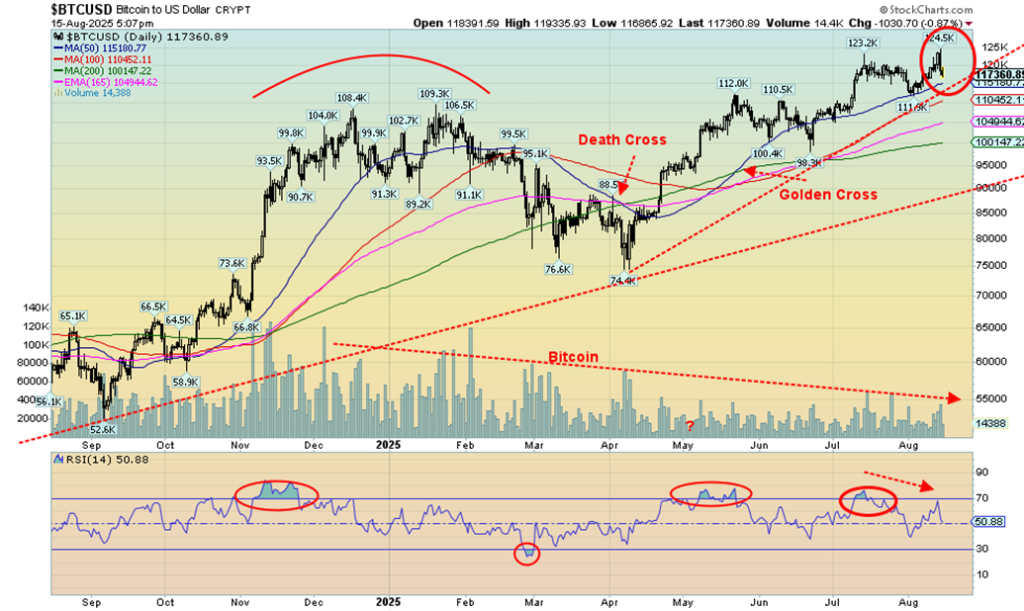
Early warning sign for the market? Bitcoin on Thursday had an outside key reversal day: a higher high than the previous day, new all-time highs, a reversal, a lower low than the previous day, and a lower close. Downside follow-through Friday. Naturally, it needs to be confirmed. That could occur if we break under $114,000. There are numerous negative divergences with the indicators: as Bitcoin makes new highs, the indicators make lower highs. Only new highs eliminate the key reversal day.
U.S. Bonds
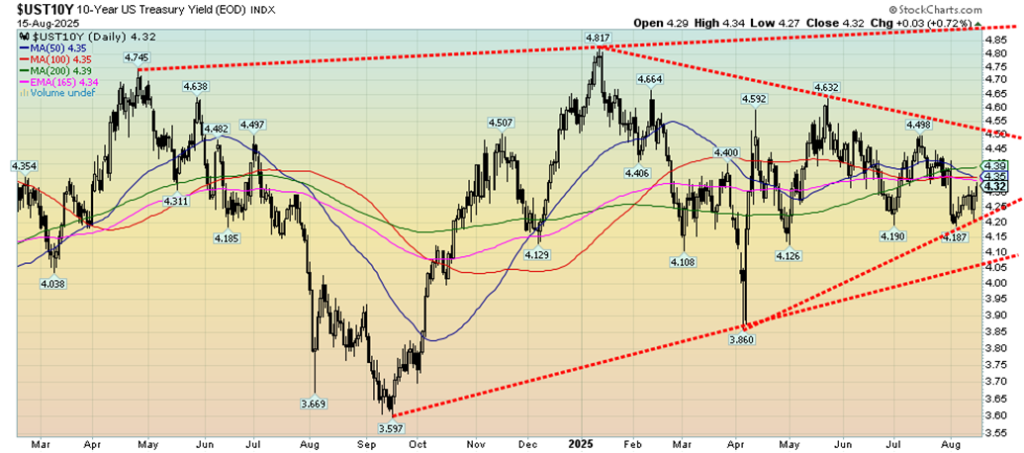
We continue to keep an eye on the 10-year U.S. Treasury note and the symmetrical triangle that’s forming. A breakout above 4.50% projects up to almost 5.50%. The 10-year breaks out even more, above 4.90%. This past week saw the 10-year rise to 4.33% from 4.29%, thanks to the stronger than expected PPI. Instead, do we get a breakdown? It’s possible. Under 4.20% and especially under 4.05% we could fall in theory to 3.10%. Watch the break.
Gold
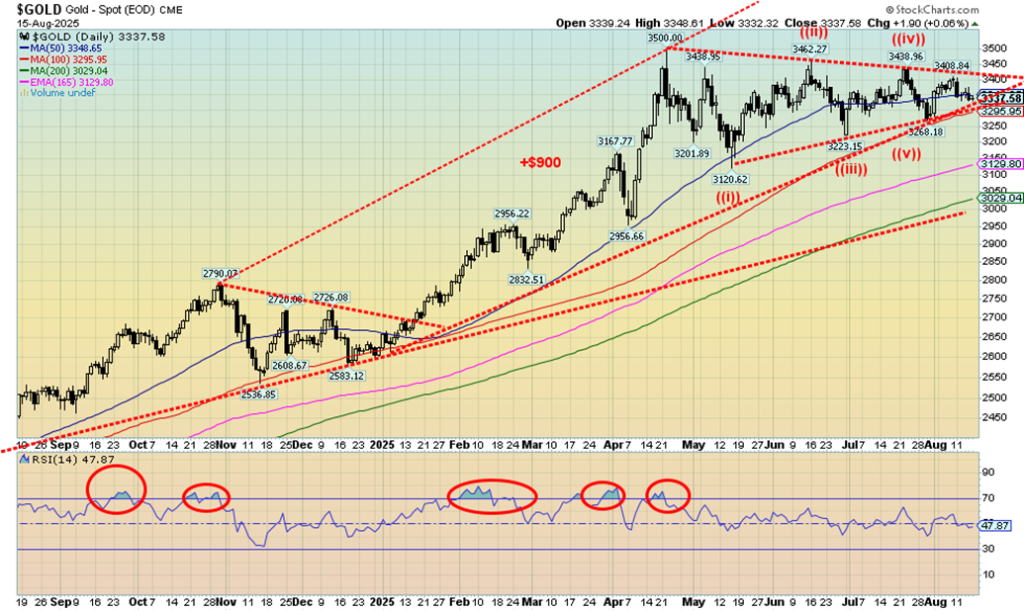
Gold did not do much this past week as it continues to mark time. That triangle is getting tighter as we approach the apex. From these triangles we could either break out above or below. We’ve also seen them waffle through and in the process form a different pattern. We are late in this triangle and the apex is fast approaching. We should be breaking out one way or the other.
On the week, gold fell 1.7% even as the US$ Index also fell, down 0.5%. Silver did better, down only 1.0%. That outperformance by silver bodes well going forward as silver is finally taking some lead. Gold stocks may be the real leader as the Gold Bugs Index (HUI) rose 0.7% this past week while the TSX Gold Index (TGD) was up a more modest 0.3%. But at least they were positive as the TGD continues its record run. As to the other metals, platinum rose 0.6% but palladium fell again, down 1.6%, and copper rose slightly by 0.2%.
Gold doesn’t like higher interest rates and while the CPI was benign the PPI wasn’t, rising above expectations. That puts pressure on the Fed as to what to do next month at the FOMC meeting. The market still expects a rate cut, but the strong PPI has thrown a bit of doubt into that.
With no big news one way or the other on the geopolitical front or domestic political front, gold slipped slightly on safe haven demand. That said, we’re still expecting gold to break out to the upside. The triangle points to targets over $3,800. The breakout point has been lowered to $3,425, but a safer point would be above $3,450. You want a close for at least two or three successive days above that point to confirm any breakout.
Oil prices wobbled again this week with ample supply and no major threats to supply. The Trump/Putin meeting was left unresolved. What’s not known is what will Trump do about tariffs that are threatened against India and others who buy Russian oil. Trump had threatened that if there was no deal he would impose 100% tariffs on countries that buy Russian oil, predominantly China and India. Both have noted if Trump were to do so it could be considered an act of war. WTI oil was down 0.4%, Brent was off 0.1%, natural gas (NG) was down 2.7%, and the EU NG was down 3.8%. The ARCA Oil & Gas Index (XOI) gained 1.0%, but Canada’s TSX Energy Index (TEN) fell 0.5%. WTI oil seems to have considerable support down to $60 but really needs to regain above $70 to even think about higher prices.
With the US$ Index down 0.5%, other currencies rose with the euro up 0.6%, the Swiss franc up 0.2%, the pound sterling gaining 0.8%, and the Japanese yen up 0.4%. Only the Cdn$ fell, off 0.4%.
Markets & Trends
| % Gains (Losses) Trends | ||||||||
| Close Dec 31/24 | Close Aug 15/25 | Week | YTD | Daily (Short Term) | Weekly (Intermediate) | Monthly (Long Term) | ||
| S&P 500 | 5,881.63 | 6,449.80 (new highs) * | 0.9% | 9.7% | up | up | up | |
| Dow Jones Industrials | 42,544.22 | 44,946.12 (new highs) * | 1.7% | 5.7% | up | up | up | |
| Dow Jones Transport | 16,030.66 | 15,662.12 | 2.1% | (1.5)% | neutral | neutral | up | |
| NASDAQ | 19,310.79 | 21,692.28 (new highs) * | 1.1% | 12.3% | up | up | up | |
| S&P/TSX Composite | 24,796.40 | 27,905.49 (new highs) * | 0.5% | 12.9% | up | up | up | |
| S&P/TSX Venture (CDNX) | 597.87 | 790.77 | 0.5% | 32.3% | up | up | up | |
| S&P 600 (small) | 1,408.17 | 1,394.59 | (1.0)% | 3.2% | up (weak) | neutral | up | |
| MSCI World | 2,304.50 | 2,776.42 | 2.0% | 20.5% | up | up | up | |
| Bitcoin | 93,467.13 | 117,161.91 (new highs) * | 0.6% | 25.4% | up | up | up | |
| Gold Mining Stock Indices | ||||||||
| Gold Bugs Index (HUI) | 275.58 | 476.23 | 0.7% | 72.8% | up | up | up | |
| TSX Gold Index (TGD) | 336.87 | 569.03 | 0.3% | 68.9% | up | up | up | |
| % | ||||||||
| U.S. 10-Year Treasury Bond yield | 4.58% | 4.33% | 0.9% | (5.5)% | ||||
| Cdn. 10-Year Bond CGB yield | 3.25% | 3.46% | 2.4% | 6.5% | ||||
| Recession Watch Spreads | ||||||||
| U.S. 2-year 10-year Treasury spread | 0.33% | 0.56% | 7.7% | 69.7% | ||||
| Cdn 2-year 10-year CGB spread | 0.30% | 0.74% | 4.23% | 146.7% | ||||
| Currencies | ||||||||
| US$ Index | 108.44 | 97.82 | (0.5)% | (9.8)% | down | down | down | |
| Canadian $ | 69.49 | 0.7241 | (0.4)% | 4.2% | Up | up | neutral | |
| Euro | 103.54 | 117.10 | 0.6% | 13.1% | up | up | up | |
| Swiss Franc | 110.16 | 124.02 | 0.2% | 12.6% | up | up | up | |
| British Pound | 125.11 | 135.58 | 0.8% | 8.4% | up | up | up | |
| Japanese Yen | 63.57 | 67.93 | 0.4% | 6.9% | up (weak) | neutral | down (weak) | |
| Precious Metals | ||||||||
| Gold | 2,641.00 | 3,337.58 | (1.7)% | 26.4% | up | up | up | |
| Silver | 29.24 | 37.98 | (1.0)% | 29.9% | up | up | up | |
| Platinum | 910.50 | 1,333.80 | 0.6% | 46.5% | up | up | up | |
| Base Metals | ||||||||
| Palladium | 909.80 | 1,099.50 | (1.6)% | 20.9% | up | up | neutral | |
| Copper | 4.03 | 4.47 | 0.2% | 10.9% | down (weak) | up | up | |
| Energy | ||||||||
| WTI Oil | 71.72 | 63.16 | (0.4)% | (11.9)% | down | down | down | |
| Nat Gas | 3.63 | 2.92 | (2.7)% | (19.6)% | down | down | down (weak) | |
__
(Featured image by Kindel Media via Pexels)
DISCLAIMER: This article was written by a third party contributor and does not reflect the opinion of Born2Invest, its management, staff or its associates. Please review our disclaimer for more information.
This article may include forward-looking statements. These forward-looking statements generally are identified by the words “believe,” “project,” “estimate,” “become,” “plan,” “will,” and similar expressions, including with regards to potential earnings in the Empire Flippers affiliate program. These forward-looking statements involve known and unknown risks as well as uncertainties, including those discussed in the following cautionary statements and elsewhere in this article and on this site. Although the Company may believe that its expectations are based on reasonable assumptions, the actual results that the Company may achieve may differ materially from any forward-looking statements, which reflect the opinions of the management of the Company only as of the date hereof. Additionally, please make sure to read these important disclosures.
Copyright David Chapman 2025
David Chapman is not a registered advisory service and is not an exempt market dealer (EMD) nor a licensed financial advisor. He does not and cannot give individualised market advice. David Chapman has worked in the financial industry for over 40 years including large financial corporations, banks, and investment dealers. The information in this newsletter is intended only for informational and educational purposes. It should not be construed as an offer, a solicitation of an offer or sale of any security. Every effort is made to provide accurate and complete information.
However, we cannot guarantee that there will be no errors. We make no claims, promises or guarantees about the accuracy, completeness, or adequacy of the contents of this commentary and expressly disclaim liability for errors and omissions in the contents of this commentary. David Chapman will always use his best efforts to ensure the accuracy and timeliness of all information. The reader assumes all risk when trading in securities and David Chapman advises consulting a licensed professional financial advisor or portfolio manager such as Enriched Investing Incorporated before proceeding with any trade or idea presented in this newsletter.
David Chapman may own shares in companies mentioned in this newsletter. Before making an investment, prospective investors should review each security’s offering documents which summarize the objectives, fees, expenses and associated risks. David Chapman shares his ideas and opinions for informational and educational purposes only and expects the reader to perform due diligence before considering a position in any security. That includes consulting with your own licensed professional financial advisor such as Enriched Investing Incorporated. Performance is not guaranteed, values change frequently, and past performance may not be repeated.


TopRanked.io Weekly Affiliate Digest: What’s Hot in Affiliate Marketing [Bovada Affiliate Program]
This week, we're mashing up 80s tech with 2020s private messaging apps. Why? Because Big Tech just dropped a big...


Euro Stablecoins Struggle to Compete with Dollar Dominance in Crypto Markets
Euro stablecoins remain marginal despite the euro’s global importance, with minimal trading volume compared to dollar rivals like USDT and...


Gilead Sciences Advances Growth Strategy with Focus on HIV, Oncology, and Innovation
Gilead Sciences focuses on developing treatments for HIV, cancer, and inflammatory diseases, driven by blockbuster drugs like Biktarvy. Growth relies...

Casablanca Stock Exchange Profits Surge in 2025 as Growth Momentum Strengthens
In 2025, Casablanca Stock Exchange profits rose 40% to MAD 50.9 billion. Net income grew 22.3%, driven by strong industrial...

Credibur Scales Rapidly: €2 Billion in Structured Debt Facilities in Six Months
Infrastructure fintech Credibur has added over two billion euros in structured debt facilities within six months. Its platform connects lenders,...
 |
|
 |  |
 |
|
-
 Business5 days ago
Markets Volatility, Geopolitics, and Signals of a Potential Trend Shift
-

 Africa2 weeks ago
Fes-Meknes Drives Investment Growth with Diversified Sectors and Industrial Expansion
-
 Impact Investing2 days ago
EU Taxonomy 2025: Progress in ESG Reporting, Gaps in True Sustainability
-

 Africa1 week ago
Bank Al-Maghrib Launches Reforms to Boost Credit via Non-Performing Loan Market