Markets
Market Turmoil Deepens as Confidence Crumbles and Gold Surges
Stock markets fell Friday after tariff announcements, ending a brief rebound. Consumer confidence is collapsing, though employment and GDP lag. March jobs data and weak manufacturing numbers loom. Gold hit record highs but retreated as stocks fell. Value retailers like Dollarama remain resilient. Confidence mirrors early 1980s lows, signaling deeper trouble ahead.

Sadly, we can’t make this stuff up. Tariffs, tariffs, tariffs. Yes, the highly integrated automobile industry is now facing tariffs imposed by U.S. President Trump on vehicles imported into the U.S. but not made there. Except that no vehicles are made exclusively in Canada, the U.S., or Mexico. Cars contain components that come from all three countries.
Parts in particular may cross borders a number of times before being placed in the final product. It is all covered under the USMCA (also referred to as CUSMA), a deal signed by President Trump in 2018. USMCA was a successor to NAFTA, a deal that was made in 1992 and signed in 1994. Before that there was the auto pact between Canada and the U.S, signed in 1965. It is estimated that over $300 billion in automotive trade exists amongst the three countries.
The automotive industry is highly integrated across the three countries as parts and components can cross borders multiple times before being assembled into the final product. Try sorting that one out. The USMCA requires that a certain percentage of auto parts are manufactured in each of the three countries. Final assembly can occur in any of the three.
Yet, here we are with 25% tariffs put on vehicles imported into the U.S., vehicles that contain parts that may have come from any of the three countries. Sort out the parts and tariff the rest. The impact on the automobile industry, both in Canada and the U.S., could be devastating.
In response to this, stock markets tanked while gold rose to a new record high. The tariffs come into effect on April 3, one day after a number of other tariffs are due to start. In the world of Trump with on-again, off-again, on-again, and maybe off-again tariffs, it creates huge uncertainty and ultimately could be quite dislocating for the automobile industry in Canada, the U.S., and Mexico. New plants take years to build and become operative.
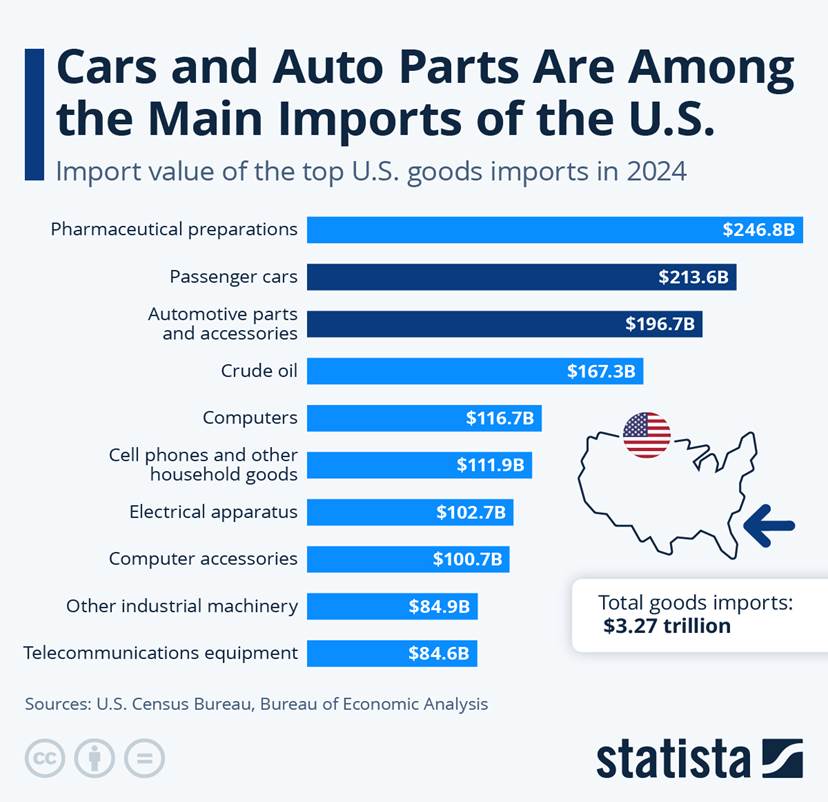
We provide a chart from Statista that shows the $3.3 trillion of goods imported by the U.S. Autos and auto parts dominate. Canada, Mexico and China account for more than 40% of the total. With the integration on the verge of collapse all of those items will become more expensive in the U.S. and job losses will multiply.
Then there is Textgate or Signalgate, whichever “gate” one wishes to call it. It follows a long line of “gates” starting with Watergate, although political scandals are nothing new, with a long tradition. What the fallout will be is to be determined. Did it have any impact on markets?
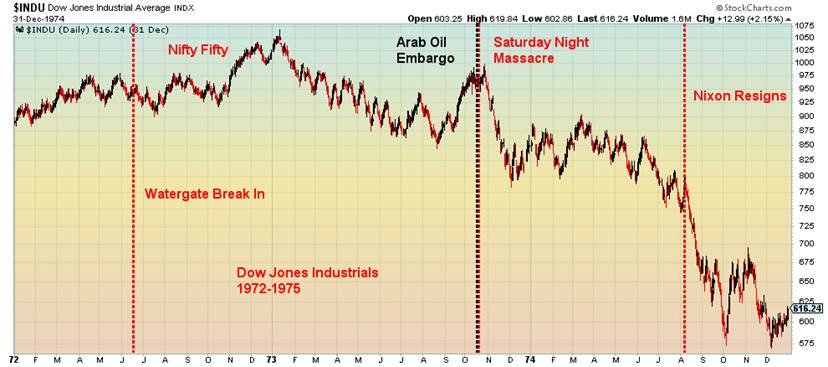
Nothing yet, but remember when Watergate first got underway markets didn’t fall immediately. The Watergate break-in occurred in June 1972. Markets continued to rally into January 1973, thanks to what was known as the Nifty Fifty rally. The real decline in the stocks markets never got underway until the start of the Arab oil embargo on October 17, 1973. Then three days later on October 20, 1973 came the Saturday Night Massacre (firing of special Watergate prosecutor Archibald Cox that triggered more resignations).
Markets tanked. By the time the dust cleared, the Dow Jones Industrials (DJI) had fallen 45.1% from the January 1973 high to a low in December 1974. The collapse was somewhat over when President Richard Nixon resigned in August 1974. It took another four months before the stock market finally bottomed.
We don’t have an Arab oil embargo this time, but tariffs might be the perfect substitute. Where will Signalgate go? It’s too early to tell. But if tariffs and Signalgate aren’t enough, we also have threats against the courts to impeach judges and to even outright eliminate district courts where judges rule against President Donald Trump (Mike Johnson, Republican House Speaker March 25, 2025). This in turn could spark a constitutional crisis that could rip the U.S. apart.
Dow Jones Industrials (DJI) 1972–1975
Tariffs, a political scandal, and threats against the courts. Add in the disturbing pictures of people being snatched off the streets and one realizes there is big growing problem. One is bad enough. But all four?
Markets may not be able to withstand such pressure. And we haven’t even noted the devastation being caused by Elon Musk’s DOGE. Could a panic occur? Yes, many are now believing it could happen. But gold is soaring. In times of geopolitical tensions (note: Gaza, Iran, Russia/Ukraine), economic uncertainty, and loss of faith in government, gold becomes the go-to investment vehicle. Even the talking heads on CNBC, BNN, Bloomberg, and Fox Business Network are noting the rise of gold.
This week, gold has once again made all-time highs and even silver is trying to break through. Copper also made new all-time highs before settling back. Against this backdrop Canada is in the midst of an election campaign, with the election taking place on April 28. The focus, however, is on Trump and tariffs and the attack on Canada’s sovereignty.
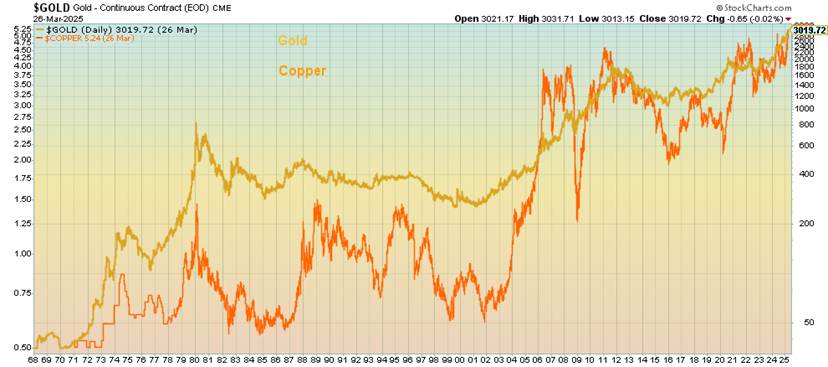
As noted, copper is also making all-time highs. It seems tariffs also impact copper imports. Add in demand, particularly for electric vehicles and green energy, Chinese demand, AI demand, supply constraints, plant issues, particularly in Chile, the world’s largest copper producer, and a falling U.S. dollar—and you have the perfect storm for copper. It is therefore no surprise that gold and copper often go up (and down) together. We also cannot help notice that copper stocks are also catching a bid. Stock market down, gold and copper up.
Gold and Copper 1968–2025
Most chief financial officers and economists now believe a recession will officially get underway in the second half of 2025. They may be optimistic. The Atlanta Fed is already forecasting that Q1 will see GDP growth fall 2.4% annualized. If that’s right, then the second half of 2025 won’t just see the start of a recession—it’ll be in full bloom. Q4 2024 may be the last great GDP rise. The Q4 GDP was 2.4% annualized below the previous forecast of 3.1% but marginally above the expected 2.3%. The last hurrah? We also note the Conference Board Expectations Index is the lowest in 12 years while the Conference Board’s Consumer Confidence Index (see chart of the week) has fallen once again as well.
Meanwhile, inflation expectations remain elevated. That puts the Fed squarely between a rock and hard place with a slowing economy and elevated inflation (stagflation). Note that the Fed’s favourite measure of inflation, the Personal Consumption Expenditures (PCE), came in higher than expected at 0.8% month over month (m-o-m) vs. the expected 0.3%. All this adds to expectations of elevated inflation and a slowing economy. Stagflation.
Recessions occurring early on in a presidential year are not unusual. One of the more famous ones was the 1981–1982 steep recession that characterized the post-election year of President Ronald Reagan. Given the four-year term of presidents, the first year is called the post-election year, the second is the mid-terms year, the third is the pre-election year, and the fourth is the election year.
Since 1950 and the presidency of Dwight D. Eisenhower, there have been 11 named recessions. A recession is defined as two consecutive quarters of negative growth. Given some crossover in presidential years, there were four in the post-election year, six in the mid-term’s year, four in the pre-election year, and five in the election year. This table outlines recession during the presidential cycle. The presidential cycle was noted by Yale Hirsch, the founder of the Stock Trader’s Almanac www.stocktradersalmanac.com in 1967, a virtual bible of information about stock markets. Yale Hirsch passed away in 2021, but the tradition is carried on by his son Jeffery Hirsch. The 2025 edition is the 58th.
Official Recessions – Year of Presidential Cycle 1952–2025
| Recession | Period of recession | President during recession | Year of presidential cycle |
| Recession of 1953 | July 1953–May 1954 | Dwight D. Eisenhower | Post-Election–Mid-Term |
| Recession of 1958 | August 1957–April 1958 | Dwight D. Eisenhower | Mid-Term–Pre-Election |
| Recession of 1960–1961 | April 1960–February 1961* | Dwight D. Eisenhower | Election |
| Recession of 1969–1970 | December 1969–November 1970 | Richard M. Nixon | Post-Election–Mid-Term |
| 1973–1975 Recession | November 1973–March 1975 | Richard M. Nixon/Gerald Ford | Mid Term–Pre-Election |
| 1980 Recession | January–July 1980 | Jimmy Carter | Election |
| 1981–1982 Recession | July 1981–November 1982 | Ronald Reagan | Post-Election–Mid-Term |
| Early 1990s recession | July 1990–March 1991 | George H.W. Bush | Mid Term–Pre-Election |
| Early 2000s Recession | March–November 2001 | George W. Bush | Post-Election |
| Great Recession | December 2007–June 2009** | George W. Bush/Barack Obama | Pre-Election–Election -Post-Election |
| Covid Recession | February–April 2020 | Donald J. Trump | Election |
* John F. Kennedy took over in January 1961 so the 1960–1961 recession ended at the start of his watch
** The Great Recession started under George W. Bush but officially ended in the first few months of Barak Obama’s watch
Of the 11 recessions since 1952, fully 10 of them have occurred under Republican presidents. Given the high probability of another one on the way, make that 11 out of 12. Since we are in the post-election year, it is noteworthy that since 1953 the record is 10 up years and 8 down years. Of those 8 down years, Republicans were in power during 7. Of the 10 up years 7 occurred under Democrat presidents. Is there a pattern?
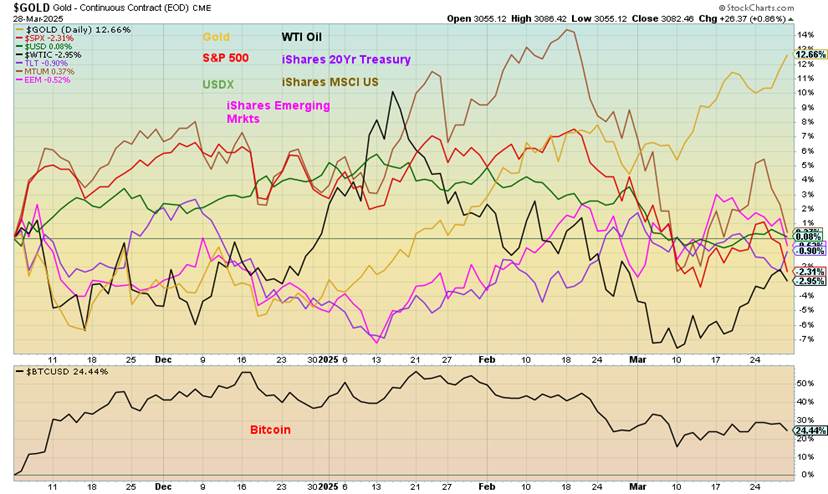
Our scorecard since the election on November 5, 2024 still has gold in the lead. Okay, and Bitcoin too. As to the rest, most are hovering around unchanged, or a bit up or down. Oil is recovering but is still negative.
Scorecard November 5, 2024–Present
We live in interesting times.
Chart of the Week
That consumer confidence has fallen is not a surprise. Inflation, tariffs, DOGE and the chaos surrounding the Trump administration have all created a sense of foreboding and anxiety. That’s irrespective of the fact that the U.S. economy is not as yet showing overall signs of having fallen into a recession. But, as we have often pointed out, things like unemployment are lagging indicators. While we suspect unemployment is rising, we have yet to see clear signs it has. Yes, delinquencies and bankruptcies are on the rise. The Atlanta Fed has indicated the U.S. will have negative growth in Q1. But we don’t start to get Q1 numbers until April, and they are just preliminary.
Q4 final GDP came in up 2.3%. PCE prices were up 2.4%. Durable goods rose 0.9% in February when they expected a decline of 1.2%. Quite a miss. The S&P Global PMI Index was 53.5 in March, above the expected 51.5 and last month’s 51.6. Instead of falling under 50 (recessionary) it improved. Even new home sales were better than expected at 676 thousand units vs. the expected 660 thousand units. However, the Conference Board’s Consumer Confidence Index fell to 92.9, down from 100.1 and below the expected 94.4. The final March 2025 Michigan Consumer Sentiment Index was also down.
So, what is it? Are things really sinking? Or is it merely a perception and an expectation that they will? At this point, it is most likely the latter. And they’ll probably be right. While many are feeling the pinch, for many others things are continuing along in the same way.
As a technical analyst, we look at it a little differently. The Conference Board consumer sentiment appears to have broken down from a symmetrical triangle. That’s not surprising as these patterns usually result in a decline (or rise) in the direction of the triangle which was down. Still, we are not as yet at the lows seen during the pandemic and we are nowhere near where they were in the depths of the 2008 financial crisis.
The reason? Most likely, while things are getting worse and confidence is falling, we just haven’t reached those depths yet. The downside breakdown suggests potential targets down to 40. At that point we are getting close to the lows of 2009.
The March Michigan Sentiment Index (final) also came out this week. As with the Conference Board’s Index, the Michigan Sentiment Index fell further. The reading was 57.0, below February’s 64.7 and below the forecasted 57.9.
Michigan Consumer Sentiment Index 2015–2025
As was the case with the Conference Board’s Confidence Index, the Michigan Sentiment Index broke trendline and triangle support. The break suggests that the index has much further to fall. If we want to be optimistic, the target could be down to 37. That would be a new all-time low, exceeding the pandemic low of 50.
With consumer confidence sliding, it is probably surprising to see that personal income in February jumped 0.8% m-o-m, well above the expected 0.3%, while personal spending was up 0.4% m-o-m, below the expected 0.5% but still decent. Are people getting more pessimistic but still spending? Inflation expectations were 4.1% vs. the expected 3.9% while consumer expectations fell to 52.6, marginally better than the expected 52.4 but below January’s 64. When we look at the two confidence indices, it seems the consumer is becoming more pessimistic, but at the same time he’s maintaining his spending. That could soon change. Eventually spending catches up to sentiment.
Is consumer sentiment the leading indicator? It’s failing. Unemployment and GDP are lagging indicators. Consumer sentiment is leading the way.
Markets & Trends
| % Gains (Losses) Trends | ||||||||
| Close Dec 31/24 | Close Mar 28/25 | Week | YTD | Daily (Short Term) | Weekly (Intermediate) | Monthly (Long Term) | ||
| ne | ||||||||
| S&P 500 | 5,881.63 | 5,580.94 | (1.5)% | (5.1)% | down | down (weak) | up | |
| Dow Jones Industrials | 42,544.22 | 41,583.90 | (1.0)% | (2.3)% | down | neutral | up | |
| Dow Jones Transport | 16,030.66 | 14,592.61 | (0.1)% | (8.2)% | down | down | neutral | |
| NASDAQ | 19,310.79 | 17,322.99 | (2.6) | (10.3)% | down | down | up | |
| S&P/TSX Composite | 24,796.40 | 24,759.15 | (0.8)% | 0.1% | down (weak) | up (weak) | up | |
| S&P/TSX Venture (CDNX) | 597.87 | 633.33 | (0.7)% | 6.0% | up (weak) | up | neutral | |
| S&P 600 (small) | 1,408.17 | 1,271.75 | (1.2)% | (9.7)% | down | down | neutral | |
| MSCI World | 2,304.50 | 2,477.97 | (1.4)% | 7.5% | neutral | up | up | |
| Bitcoin | 93,467.13 | 83,836.25 | (0.2)% | (10.3)% | down | neutral | up | |
| Gold Mining Stock Indices | ||||||||
| Gold Bugs Index (HUI) | 275.58 | 359.27 (new highs) | 2.0% | 30.4% | up | up | up | |
| TSX Gold Index (TGD) | 336.87 | 451.84 (new highs) * | 2.1% | 34.3% | up | up | up | |
| % | ||||||||
| U.S. 10-Year Treasury Bond yield | 4.58% | 4.25% | (0.1)% | (4.1))% | ||||
| Cdn. 10-Year Bond CGB yield | 3.25% | 3.03% | 0.3% | (6.8)% | ||||
| Recession Watch Spreads | ||||||||
| U.S. 2-year 10-year Treasury spread | 0.33% | 0.33% | 17.9% | flat | ||||
| Cdn 2-year 10-year CGB spread | 0.30% | 0.54% | 8.0% | 80.0% | ||||
| Currencies | ||||||||
| US$ Index | 108.44 | 104.01 | (0.1)% | (4.1)% | down | down (weak) | up | |
| Canadian $ | 69.49 | .6984 | 0.2% | 0.5% | neutral | down | down | |
| Euro | 103.54 | 108.25 | 0.1% | 4.6% | up | neutral | down | |
| Swiss Franc | 110.16 | 113.46 | 0.2% | 3.0% | up | neutral | neutral | |
| British Pound | 125.11 | 129.43 | 0.2% | 3.5% | up | neutral | neutral | |
| Japanese Yen | 63.57 | 66.79 | (0.5)% | 5.1% | up | up (weak) | down | |
| Precious Metals | ||||||||
| Gold | 2,641.00 | 3,081.46 (new highs) * | 2.0% | 16.8% | up | up | up | |
| Silver | 29.24 | 34.07 | 3.2% | 16.5% | up | up | up | |
| Platinum | 910.50 | 981.30 | 0.4% | 7.8% | neutral | up | up (weak) | |
| Base Metals | ||||||||
| Palladium | 909.80 | 965.00 | 1.8% | 6.1% | neutral | neutral | down | |
| Copper | 4.03 | 5.12 (new highs) * | 0.2% | 27.1% | up | up | up | |
| Energy | ||||||||
| WTI Oil | 71.72 | 69.92 | 2.7% | (2.5)% | down | down | down | |
| Nat Gas | 3.63 | 4.09 | 3.0% | 12.7% | neutral | up | neutral | |
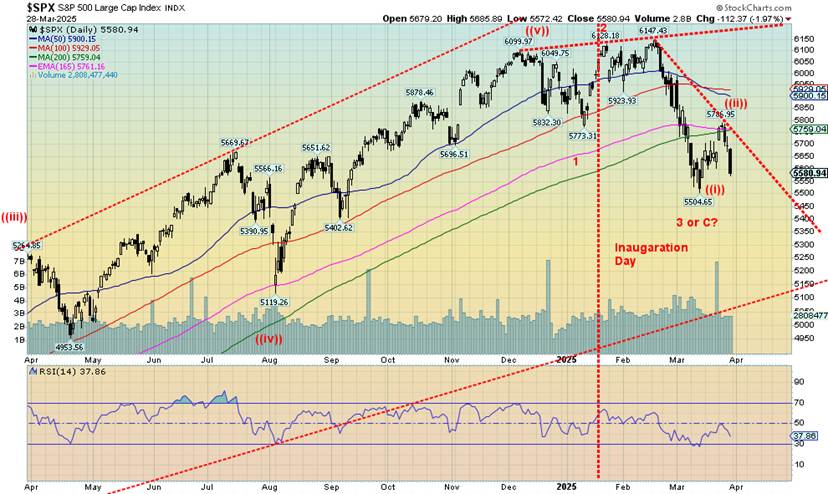
The sharp sell-off on Friday was a statement at the end of the week. Tariffs, tariffs, tariffs. The S&P 500 fell 1.5% on the week, but the NASDAQ dropped 2.6% as the MAG7 and tech stocks were hit. Not to be outdone, the automobile companies, subject of the tariffs, saw Ford Motor fall a rather modest 2.8% while General Motors was hit 6.3%. Not to be outdone, Stellantis fell 6.1%. The only car company that was up was Hyundai. But as a warning, in North America Hyundai only trades on the Pink Sheets. Not the most reputable exchange.
As to everyone else, the Dow Jones Industrials (DJI) fell 1.0%, while the Dow Jones Transportations (DJT) fell a modest 0.1%. The S&P 400 (Mid) was down 1.0% while the S&P 600 (Small) dropped 1.2%. In Canada, the TSX fell only 0.8% and the TSX Venture Exchange (CDNX) dropped 0.7%.
In the EU, the London FTSE was off 0.1%, the Paris CAC 40 was down 1.6% as was the German DAX, while the EuroNext was down 1.2%. In Asia, China’s Shanghai Index (SSEC) fell 0.4%, the Tokyo Nikkei Dow (TKN) fell 1.5%, while Hong Kong’s Hang Seng (HSI) fell 1.8%. It seems no one was spared.
The chaos of tariffs and the ongoing chaos in the U.S. were the catalysts. As we keep thinking, are Trump and his friend Musk trying to deliberately crash the U.S. economy and with it the world economy? We leave one to their own conclusions. The effort is to remake the U.S. in their image or, as it turns out, in the image of Project 2025 where the blueprint is being followed. It seems to us that the 90-year cycle we’ve talked about in the past is potentially alive and well.
The last one bottomed in 1932 with the Great Depression. Before that, the previous 90-year cycle bottomed in 1843, the period known as the Hungry Forties. Both periods ended in war: the Mexican-American War of 1846–1848 and World War II in 1939–1945. Stock market crashes preceded them with the 1835–1837 crash and the 1929–1932 crash. Does history repeat itself? Or just rhyme?
That last low was at 5,500, but the bigger breakdown point and possible crash point come at 5,400. Some analysts are suggesting we could have a crash. That would not be a surprise. Regaining 5,800 would be very helpful, but we are not optimistic and the background turns darker. Be prepared (old boy scout motto).
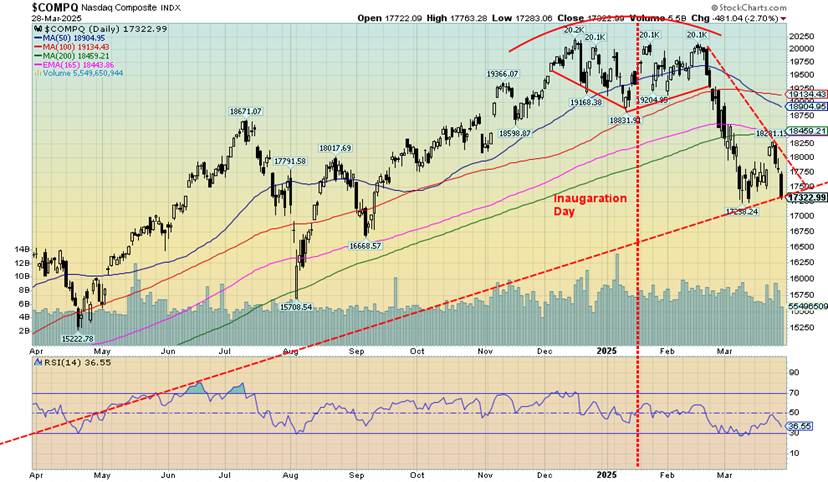
The NASDAQ was hit hard on Friday, down 481 points or 2.7%. Thanks to the rebound earlier in the week, it ended the week down 2.6%. The NY FANG Index fell 4.1%. It’s no surprise there was some shakedown in the MAG7. Google fell 6.1% and Nvidia was down 6.2%. Only Tesla was spared (why, we’re not sure), up 6.0%. We don’t expect that to last. His friend at Trump Media dropped 2.1% and is down 75% from its all-time high.
Tesla is down 46% from its all-time high. Birds of a feather? But the worst one on the week was Broadcom, which was down 11.8%. That’s like a mini-crash. The NASDAQ is holding above a breakdown line, just above 17,000. A break of 17,000 could set off a panic. Right now, only a rebound that takes us above 18,300 is going to save this market, at least temporarily. The NASDAQ remains in correction territory, off 14.3% so far from its all-time high.
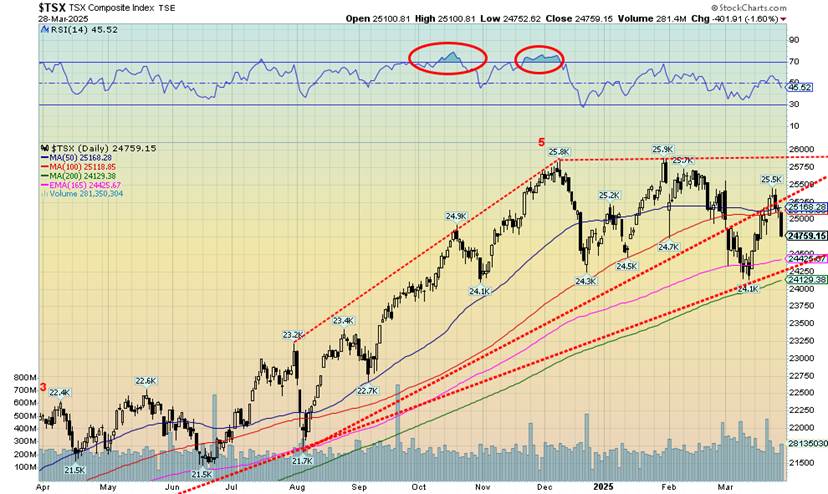
The TSX Composite didn’t escape the sharp reversal on Friday that sent stock prices tumbling. The TSX fell 1.6% on Friday or 402 points. On the week, the TSX fell 0.8%, thanks to some up movement earlier in the week. However, we ran into resistance just above the 50/100-day MA, so down we went. Not even the TSX Venture Exchange (CDNX) escaped the carnage on Friday. The CDNX dropped 0.7% on the week but remains one of the few still in positive territory so far in 2025. Of the 14 sub-indices, six were up and eight were down.
Leading the up was, you guessed it, Gold (TGD), gaining 2.1%. Consumer Staples (TCS), another safe haven, gained 1.5%. To the downside, the big loser was Information Technology (TTK), off 4.8%. Consumer Discretionary (TCD) was down 1.9%. Golds (TGD), Metals (TGM), and Materials (TMT) remain the places to be. Health Care (THC) has been the worst performer this year, followed by Information Technology (TTK) and Consumer Discretionary (TCD). All are down on the year. You know what to avoid and where to invest. The trend should continue.
U.S. 10-year Treasury Note, Canada 10-year Bond CGB
Despite the trade tensions, DOGE, political tensions, and more, the longer end of the U.S. curve was relatively flat all week. The U.S. 10-year treasury note was essentially flat, down 0.2%. The Canadian 10-year Government of Canada bond (CGB) didn’t disappoint as it rose 0.3%. But widening was the 2–10 spread with the U.S. out to 33 bp and Canada up to 54 bp. Both continue to point to an impending recession which may be getting closer.
Stagflation doesn’t appear to bother bond yields yet. PCE prices and GDP were not too much different than expected (both previously noted). Consumer sentiment was positive for interest rates as they fell further. The manufacturing PMI was a bit better than expected and even housing prices and new home sales were up a bit more than expected. So which is it? A slowing economy or one still humming along despite the big drop in consumer sentiment?
Maybe this coming week will do it. We get the Chicago PMI, which has been consistently in recession territory of late. As is the case with the global PMI. The initial weekly claims haven’t been rising as many have anticipated. But this coming week is full of job-related numbers. JOLTS job openings and quits, ADP employment gains expected at 60,000, this week’s initial weekly claims expected at 226,000, barely up from this past week, and the big one on Friday with the release of the March employment numbers.
A drop is expected to 80,000 new jobs. That’s down from 151,000 the month before. The unemployment rate is expected to tick up to 4.2% from 4.1%. In Canada, 25,000 new jobs are expected, but last month only 1,100 new jobs were created so they may be poised to be disappointed again. Canada’s unemployment rate is expected to tick up to 6.7% from 6.6%. All these will be covered in next week’s Scoop.
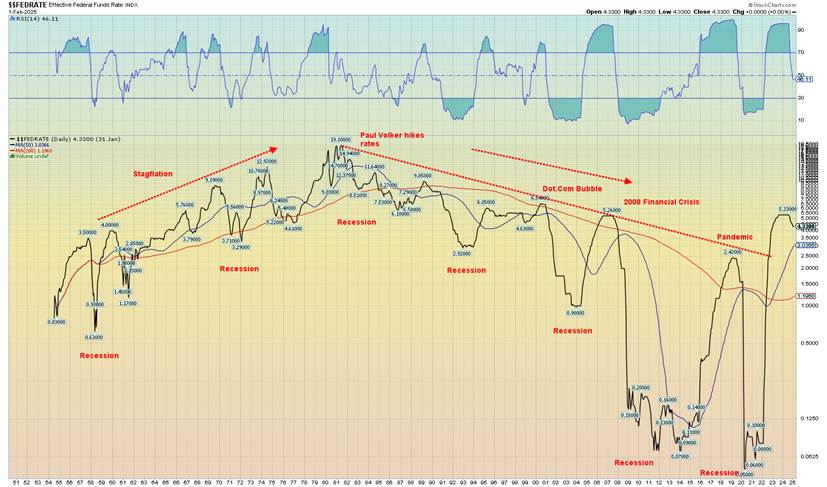
The trend for the long rates is down. But if the U.S. 10-year moved back above 4.40%, then a new upward trend may be underway. We provide a long-term chart of the Fed rate, as follows. What strikes us is that the recent rise in the Fed rate broke a 45-year downtrend. Are we in a new era of higher rates? Stagflation, as we saw in the 1970s, could be the catalyst.
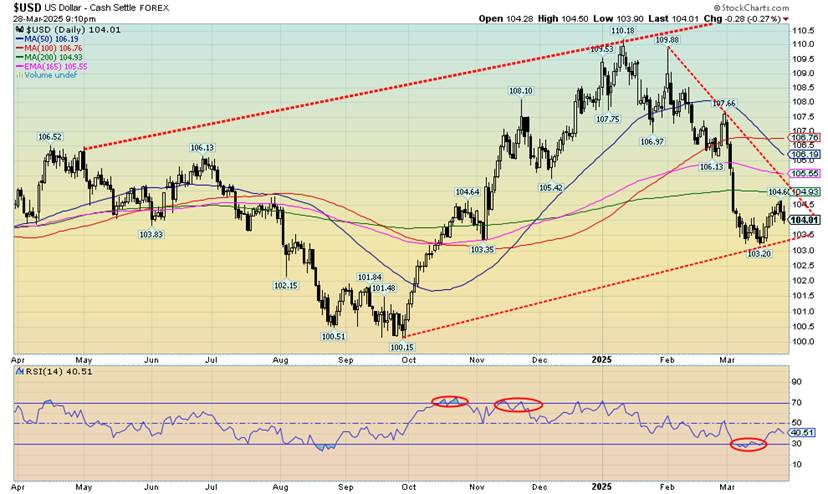
The US$ Index had a rebound rally but by the week’s end, with tariffs again dominating and risk of a recession rising, the US$ Index dropped back. On the week, arguably it was pretty quiet for the currencies with only minor movement. The US$ Index fell 0.1%, the euro was up 0.1%, the Swiss franc up 0.2%, the pound sterling up 0.2%, and the Japanese yen down 0.2%.
Canada kept pace with a rise of 0.2%. All in all a pretty quiet week. We need to watch that 103.50 point as a breakdown under there could start a drop towards 100. This downtrend does not as yet appear over. Resistance was up to 105 and we failed to take it out. The US$ Index is headed lower, with 103.50 the breakdown point.
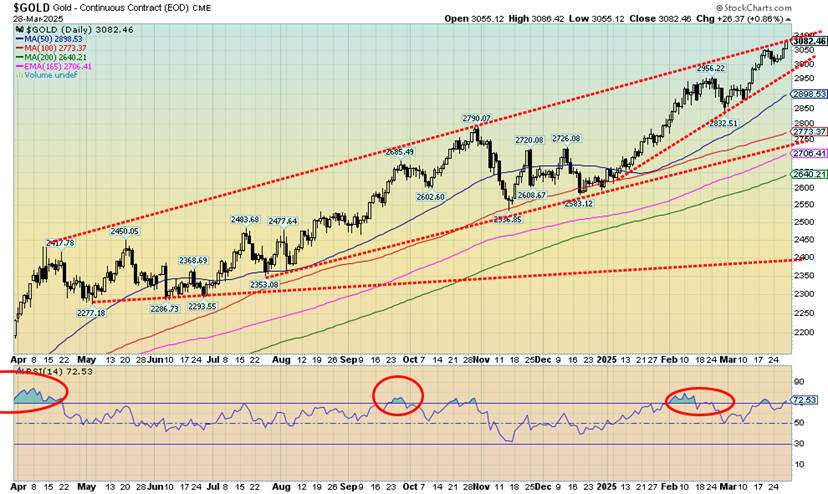
You have to love it. The talking heads at CNBC, BNN, etc. are finally starting to take notice of gold. As the stock market tanks and the MAG7 are imitating themselves only to the downside, gold has been rising. Even if gold had just stood still, it would be easily beating the stock market. But instead, gold is up 16.7% on the year, silver up 16.5%, and the gold stocks are double that. Once again, gold hit new all-time highs but fell short of the next magic number at $3,100. Nonetheless, as we keep saying, gold is the go-to asset in times of geopolitical tensions, economic uncertainty, and loss of faith in government.
Right now, we are getting that in spades. But nobody seems to notice. Well, yes, they do but they are in Asia, especially China and India. And to a lesser extent in Europe that has had its share of geopolitical tensions and government issues numerous times in the past century. North Americans may be waking up. Gold as a percentage of global assets was a mere 0.5% and silver even less at 0.01% of global assets. But that was back in 2015. Is it any better today? Possibly, but not by much.
When we talk of gold (and silver), we are always referring to the metal. Gold stocks are separate and have different issues than the metals themselves. Gold is responding to the expanding trade war. Chaos reigns in the world’s largest economy and that in turn is music to gold’s ears. Trump and trade wars trump everything else. On the week, gold rose 2.0%, silver was up 3.2%, and the badly lagging platinum rose 0.4%. Of the near precious metals, palladium was up 1.8% while copper hit all-time highs but then sold off, finishing up a small 0.2%. That probably signals a short-term top for copper.
But gold also may be at/near a short-term top. Our chart shows gold hitting the top of that bull channel. Lurking below is a disturbing-looking ascending wedge triangle which is normally bearish. Firmly busting through $3,100 would help ease things, but a breakdown under $3,000 now could prove to be the start of a bigger correction. Gold yearly cycles suggest weakness into the May/June/July period before a rebound gets underway. With an RSI that keeps poking its head above 70, taking some short-term profits on gold stocks might not be a bad idea. Just remember it’s a small market, so moves up and down can quickly become exaggerated. Two silver stocks of note were hit hard on Friday: Mag Silver (MAG/TO) and Aya Silver & Gold (AYA/TO). In theory, a break of that ascending wedge triangle could target down to $2,700.
Nonetheless, tariffs, trade wars, geopolitical tensions, and more should keep upward pressure on gold prices. And add in the signs of stagflation. A reminder that in the 1970s it was stagflation and Iran (geopolitical tensions) that helped send gold soaring over $800. Stagflation was giving way to economic uncertainty and loss of faith in the government to solve anything. Only Paul Volcker sending the Fed rate to 21% brought about the collapse of gold prices and the 1981–1982 severe recession.
Rest of page is blank
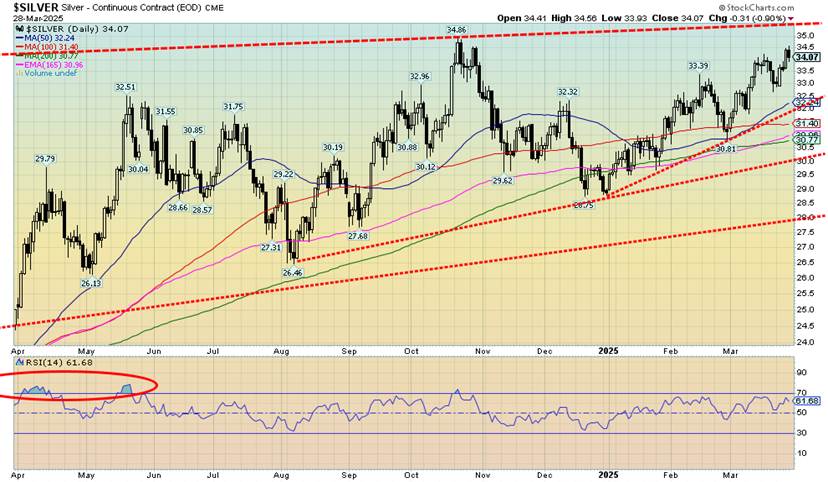
Silver bulls have to be the most masochistic bulls in the world. They have to sit around and watch gold make all-time highs while they remain $16 under their all-time high seen in 1980 and 2011. And that’s just on a nominal basis. Once again as gold made all-time highs this past week, silver fell short of even making fresh 52-week highs. It suggests we should, but we’re still waiting.
The paper silver market is 200 to 300 times the size of the physical market. That suggests for every ounce of physical silver there are 200 to 300 ounces of paper silver. Paper rules. There is supposedly a shortage of physical silver and demand is good, especially for the electrification in the green world, but paper suppresses the price. Possibly because of the high demand and need, it pays to keep the price down. But the bulls talk incessantly of a short squeeze. We’re still waiting. But if it happened, yes, silver could explode to the upside. It might even make Eric Sprott’s prediction of $300 silver a reality.
Silver rose 3.2% this past week and is up 16.5% on the year, but about all it is doing is keeping pace with gold when it should be leading. Nobody talks much about silver. However, it is an important element in our industrial world.
Breakout is still taking out $35, but the reality is we need a move above $35.50 to fully convince us. Targets then could be $40/$41. That’s still short of the 1980/2011 high. To the downside, we would not want a move under $32.50. Under $29, it’s all over and a bear market might ensue.
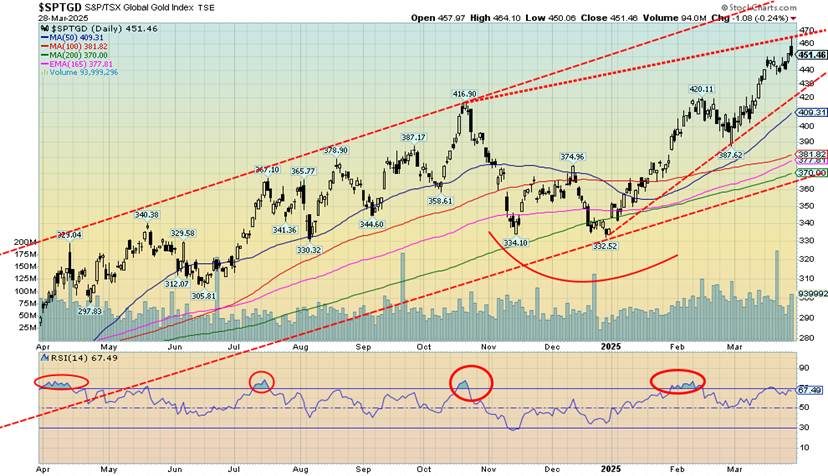
Yes, it finally did it. After 14 years, the TSX Gold Index (TGD) finally took out the 2011 high. Not by much, really. The high on the week was 464 vs. 455 in 2011. Of course, that’s nominal. On an inflation-adjusted basis we still have a way to go. That’s way up at 628, some 39% from current levels. Taking 14 years to get back to break even is not unusual. The DJI took 25 years to regain its 1929 high while the Tokyo Nikkei Dow took 34 years. Gold peaked in 1980 but it then took 28 years to equal that high. All that is on a nominal basis, not inflation- adjusted. Fourteen years is rather quick by comparison. As for the Gold Bugs Index (HUI)? Well, we are still waiting. The HUI is still down 44% from that 2011 high.
Take your victories where you can get them. This past week the TGD rose 2.1% and the HUI was up 2.0%. On the year, they are the big winners with the TGD up 34.1% and the HUI up 30.4%. The HUI at least made 52-week highs this past week. However, both sold off on Friday after initially going up to make those highs. A 700+ drop in the DJI probably leaned on the gold stocks as well. Margin calls? Could be. Or just lousy sentiment towards stocks.
That reversal on Friday may portend another correction in the precious metals. However, we have no expectation of a larger drop or the end of the current bull. We do seem to be forming a potential ascending wedge triangle, so we do have to be mindful of the potential for a steeper drop. For the TGD, the 420 area appears to be support. So, a drop through there would not be welcome. A move above 470 would end discussions of an imminent drop.
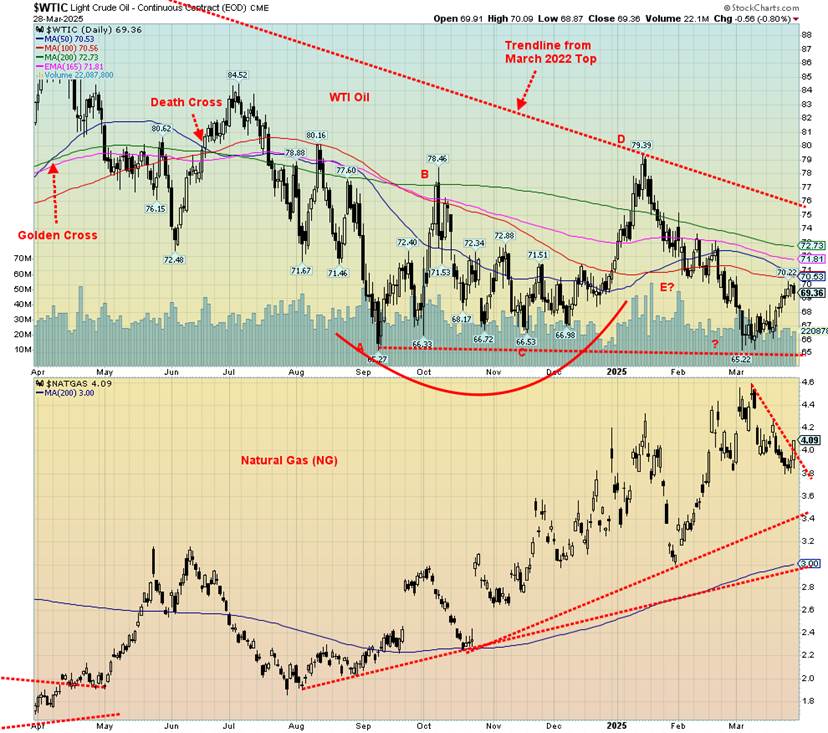
Oil eked a gain this week. The only things keeping it in the news are the potential tariffs against countries that import Venezuelan oil and threats against Iran. The largest importer of Venezuelen oil is China, where the U.S. already has placed a bevy of tariffs. Guess who is the second-largest importer of Venezuelan oil? You guessed it: the U.S.A. We’re still trying to wrap our heads around how the U.S. puts tariffs on itself. What happened to “if it’s good for the goose, it’s good for the gander”?
Still, all WTI oil has done is crawl up to that conglomeration of moving average resistance between $70 and $73. There’s a lot of work to be done to get through $73, then through $76 and break that downtrend line from the 2022 top near $130. Okay, it took it out once before, before it just as quickly succumbed to selling. On the week, WTI oil rose 1.9% while Brent crude was up 1.8%. Nothing much to get excited about. All we can say is, oil continues to make what appears as a big bottom pattern. But it needs a catalyst. Iran? Threats against Iran continue.
Natural gas (NG) at the Henry Hub rose 3.0%, but NG at the EU Dutch Hub fell 4.6%. Both continue in their up/down dance together. It’s odd about the Henry Hub, given the milder weather and a surge in production. At the Dutch Hub, milder weather definitely helped. As to the energy stocks, the ARCA Oil & Gas Index (XOI) was flat on the week while the TSX Energy Index (TEN) rose a smallish 0.6%. Both remain marginally up on the year, even as WTI oil remains down a small 3.3% and Brent is down 1.8%. Yes, NG is up but that’s at the Henry Hub. In the EU it is down. We suppose the good news is that NG broke a small downtrend this past week. However, we are not holding out thoughts we’ll get back to the recent highs near $4.60. The hope of better prices for the stocks is oil. It all depends on Iran. But it would be for all the wrong reasons.
__
(Featured image by Nicholas Cappello via Unsplash)
DISCLAIMER: This article was written by a third party contributor and does not reflect the opinion of Born2Invest, its management, staff or its associates. Please review our disclaimer for more information.
This article may include forward-looking statements. These forward-looking statements generally are identified by the words “believe,” “project,” “estimate,” “become,” “plan,” “will,” and similar expressions, including with regards to potential earnings in the Empire Flippers affiliate program. These forward-looking statements involve known and unknown risks as well as uncertainties, including those discussed in the following cautionary statements and elsewhere in this article and on this site. Although the Company may believe that its expectations are based on reasonable assumptions, the actual results that the Company may achieve may differ materially from any forward-looking statements, which reflect the opinions of the management of the Company only as of the date hereof. Additionally, please make sure to read these important disclosures.
Copyright David Chapman 2025
David Chapman is not a registered advisory service and is not an exempt market dealer (EMD) nor a licensed financial advisor. He does not and cannot give individualised market advice. David Chapman has worked in the financial industry for over 40 years including large financial corporations, banks, and investment dealers. The information in this newsletter is intended only for informational and educational purposes. It should not be construed as an offer, a solicitation of an offer or sale of any security. Every effort is made to provide accurate and complete information.
However, we cannot guarantee that there will be no errors. We make no claims, promises or guarantees about the accuracy, completeness, or adequacy of the contents of this commentary and expressly disclaim liability for errors and omissions in the contents of this commentary. David Chapman will always use his best efforts to ensure the accuracy and timeliness of all information. The reader assumes all risk when trading in securities and David Chapman advises consulting a licensed professional financial advisor or portfolio manager such as Enriched Investing Incorporated before proceeding with any trade or idea presented in this newsletter.
David Chapman may own shares in companies mentioned in this newsletter. Before making an investment, prospective investors should review each security’s offering documents which summarize the objectives, fees, expenses and associated risks. David Chapman shares his ideas and opinions for informational and educational purposes only and expects the reader to perform due diligence before considering a position in any security. That includes consulting with your own licensed professional financial advisor such as Enriched Investing Incorporated. Performance is not guaranteed, values change frequently, and past performance may not be repeated.


Bitcoin Strong as Market Sentiment Turns Bullish Amid Industry Developments
Bitcoin holds above $78,000 despite geopolitical tensions, supported by strong ETF inflows. A documentary suggests Hal Finney and Len Sassaman...


Cannabis Stocks Show Signs of Rebound as Policy Shift Sparks Optimism
Cannabis stocks, including Tilray, plunged after a 2021 speculative peak, remaining in long-term decline. Momentum may shift as U.S. authorities...


Record State Funding Strengthens Support for Moroccan Associations in 2024
State support for associations reached a record in 2024, exceeding 5.6 billion dirhams, reflecting strong government commitment to development through...


AI and Innovation Transform Clinical Practice in Spanish Hospitals, Despite Ongoing Challenges
Spanish hospitals are applying AI, deep learning, and digital tools to improve diagnosis, predict disease demand, and enhance prevention. Projects...


Italy Confronts Rising Youth Isolation with Nationwide Crowdfunding Initiative
Around 200,000 young people in Italy face voluntary social isolation, with cases rising sharply, especially among girls aged 13 to...
 |
|
 |  |
 |
|
-

 Crypto3 days ago
Bitcoin Holds Steady as Institutions Move In and Crypto Markets Stay Neutral
-

 Business2 weeks ago
The TopRanked.io Weekly Digest: What’s Hot in Affiliate Marketing [LiveChat Affiliates Review]
-

 Africa1 week ago
Agadir Expands Transport Network with Major Underpass and Coastal Road Extension
-

 Biotech3 days ago
Saxony Bets on Biotech Growth Through Investment and Innovation