Markets
Market Volatility, Gold’s Surge, and Economic Uncertainty Ahead
Market turbulence continues as stocks appear to top, reacting to deregulation hopes. U.S. job data disappointed, while Canada’s surprised. Gold hit new highs near $2,900, but silver lags. London’s gold market faces pressure. Oil declines on policy fears, yet energy remains favored. Key U.S. economic data ahead amid ongoing political uncertainty.

Week three of chaos emanating from the U.S. Sometimes it is difficult to know where to start. Tariffs are on, then off, or is the right word “delayed”? It’s interesting, since the so-called stand-downs to Trump’s demands were signaled weeks ago by both Canada and Mexico while Biden was still president. Still, the threat remains and no one knows what demands Trump might have in store in a month’s time. Fear of tariffs caused the market to sell off. When the tariffs didn’t happen, the stock markets bounced back. Volatility reigns. Gold, meanwhile, continues its upward march as it is now threatening to go over $2,900.
Possibly the real story of the week is Elon Musk’s attempt to take over the U.S. Treasury and USAID (United States Agency for International Development). Elon Musk is the world’s richest man, worth over $400 billion. The problem is, it is uncertain as to what extent he may actually control either one of these departments/agencies. Is this legal? Congress has not approved his actions. Lawsuits and protests are on the rise.
Temporary orders to restrict Musk are now in place. Reports that the takeover is limited to read-only access did not quell protests that it was a takeover of the U.S.’s financial systems and could release considerable private data of U.S. citizens. The U.S. Treasury manages the U.S.’s federal finances by collecting taxes, paying bills, and managing the currency, government accounts, and the debt. The department has over 100,000 employees.
The U.S. Treasury is responsible for all federal spending. That includes the big ones of Social Security, health care (which includes Medicare/Medicaid), defense, and paying the interest on the debt. In other words, the U.S. Treasury is responsible for most payments made to individuals and others in the U.S. Other areas that receive payments from the U.S. Treasury include veterans’ benefits, education and training, natural resources, and transportation.
Disbursements are carried out through numerous departments, including Health & Human Resources, Social Security Administration, Defense, Veterans Affairs, Agriculture, Homeland Security, Transportation, plus others.
Just four payment areas—Social Security ($1.5 trillion), Medicare/Medicaid ($1.7 trillion), defense ($0.9 trillion), and interest on the debt ($1.0 trillion)—make up over 70% of all U.S. spending. Much of the rest are mandatory payments approved by Congress. The U.S. spends an estimated $7.2 trillion annually. The deficit (revenues from individual, corporate, payroll, and excise taxes, less spending) currently creates an annual deficit of at least $2 trillion.
It is all funded by issuing debt that includes treasury bills, treasury notes, and treasury bonds. The U.S. deficit has been on the rise since the financial crisis of 2008 and continuing past the COVID pandemic of 2020.
The size of the current deficit is not surprising, given that deficits have averaged $0.9 trillion annually since 2000. All presidents since 2000 have added to the debt and deficits. According to Investopedia (www.investopedia.com), George W. Bush added $4.2 trillion, Barack Obama added $7.7 trillion in dealing with the after-effects of the 2008 financial crisis, Donald Trump added $6.7 trillion, which included costs related to the COVID pandemic, while Joe Biden added $4.7 trillion, also dealing with the after-effects of the pandemic.
Percentage-wise, the biggest debt increases came under wartime presidents Franklin Roosevelt and Woodrow Wilson. Ronald Reagan came third with huge deficits during the Cold War period that also featured tax cuts.
It is unknown what the current Donald Trump presidency could add to the debt and deficits over the next four years. U.S. Debt Clock (www.usdebtclock.org) estimates that U.S. federal debt could rise by $10.7 trillion in the next four years, based off projections from the Office of Management and Budget (OMB). Annual deficits could reach $2.9 trillion. If that’s correct, it would be the biggest increase ever.
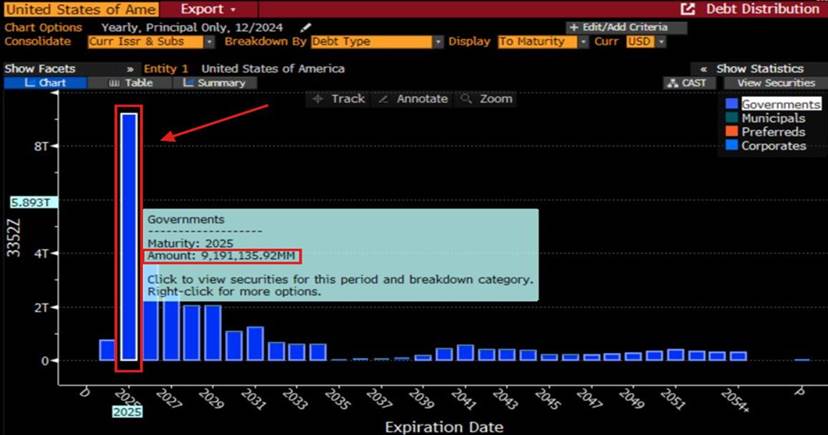
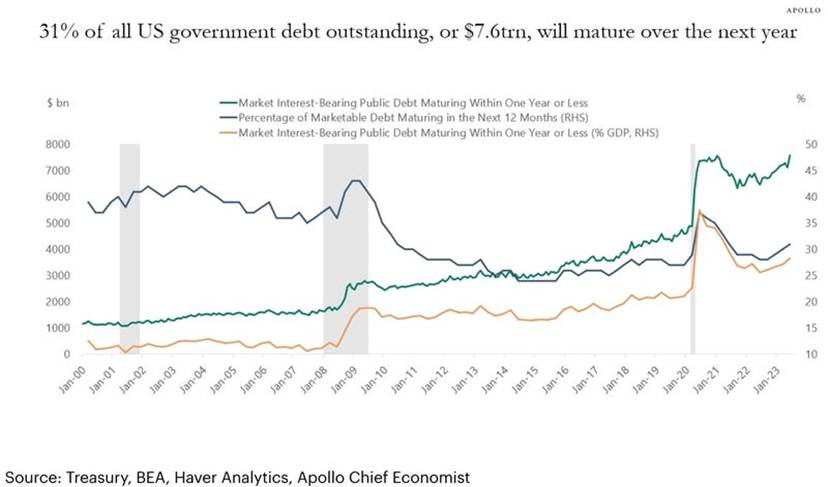
Not surprisingly, that is raising some concerns. In 2025, the U.S. needs to refund $7.6 trillion of maturing debt (or possibly $9.2 trillion, according to some reports). After that, there is at least $3–4 trillion maturing every year until 2028. They note that some $28 trillion of U.S. federal debt comes due over the next four years. That’s over 75% of the U.S. debt. The question becomes, will they put further strain on debt markets that are already strained with over $350 trillion of global debt? The U.S. (governments, corporations, and individuals) holds a good one-third of global debt.
Maturity Cycle of U.S. Debt 2025-2054
Federal Debt, All Debt Securities 2000–2024
Expenditures have been rising. We note in the next chart that interest payments on the debt now surpass what is being spent on defense. Notably, on the defense expenditures, it does not include “black ops” that may or may not be legal. All expenditures are approved by Congress. The U.S. Treasury is governed by U.S. law and, like all departments and agencies, it is audited.
Federal Government Expenditures – Interest on Debt, Defense, Social Benefits 2000–2024
USAID has also been seized by Musk and is now under the U.S. State Department, headed by Marco Rubio. Again, there are lawsuits and protests questioning the legality of seizing an agency created by federal law and funded by Congress. USAID is an independent agency for civilian foreign aid and development assistance. It is one of the largest aid organizations in the world, disbursing to over 130 countries, primarily in Africa, Asia, Latin America, the Middle East, and Eastern Europe.
The U.S. provides some 47% of all aid. USAID has over 10,000 employees, of which two-thirds are overseas, and an annual budget in excess of $50 billion, less than 1% of the budget. It centers on disaster relief, poverty relief, global issues, the environment, and bilateral interests. It is a form of soft power for the U.S. in the world. Lately, the largest recipient of aid has been Ukraine. There are numerous accusations of waste and fraud aimed at the agency.
Into the midst of all of this comes the need for Congress to enact the fiscal 2025 spending agreement. This must be done by March 14 or the risk is at least a partial shutdown of the federal government. However, all this has been upended by the order to freeze funding for U.S. federal programs, along with the conflict with U.S. Treasury. Buyout offers have been offered to thousands of civil servants, of which about between 20,000 and 60,000 depending on who is counting have accepted the offer.
Threats of firings have sparked widespread confusion and chaos. Lawsuits have been launched questioning the legality. Court orders have declared it illegal. The offer of buyouts appears to also spread to government departments and agencies, including the CIA.
Still looming is a potential battle between the Trump administration and the Federal Reserve. Any attempts to control the Federal Reserve would be highly negative and could spark a sell-off of U.S. treasuries and the U.S. dollar. The Federal Reserve is independent and owned by the banks. It does not report to nor is it controlled by the federal government. Another concern is: what about government agencies such as the Bureau of Economic Analysis (BEA), the Bureau of Labour Statistics (BLS), and the Census Bureau? All of these, plus others are responsible for gathering and disseminating the statistics that help analyze the state of the U.S. economy.
It’s only week three, and chaos and confusion continue with rising lawsuits and protests that have so far remained peaceful. But that could change. It is clear that, given the rapidity with which these orders are being executed, considerable planning went into it before the November election. So far, it has not sparked much consternation in the stock market, which continues to focus on Trump’s potential actions on regulation and tax cuts, which could be positive for the stock market. Gold has been rising as a result of the chaos and confusion (see also our comments for gold and growing shortages of physical bullion).
We continue to monitor performance since November 5, 2024, the day of the election. As before, the iShares MSCI US Momentum Shares ETF (MTUM) continues to lead. Gold has been rising slowly, with the best rise coming since inauguration day on January 20, 2025.
We live in interesting but destabilizing times.
Performance Selected Assets November 5, 2024–present
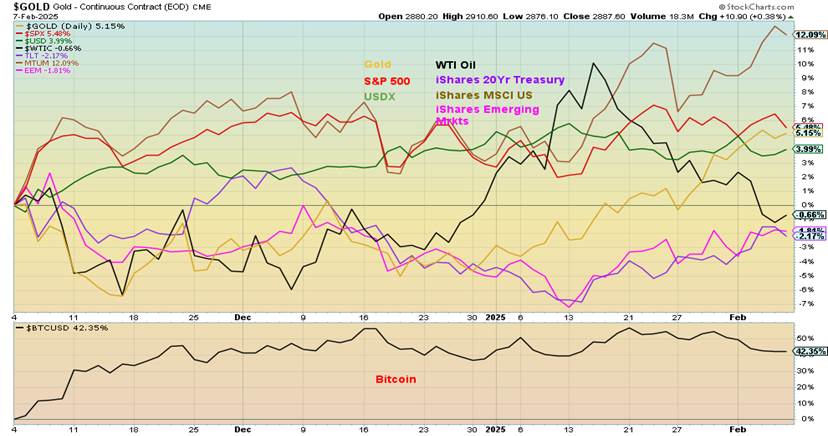
Chart of the Week
U.S. Job Numbers
Is the U.S. economy weakening? The January nonfarm payrolls (establishment survey) came in at 143,000, below the expected 170,000 and well below December’s upwardly revised 307,000. Annual revisions also came out and the monthly average for nonfarm payrolls was 166,000, down from 186,000 in the previous month. The unemployment rate (U3) fell to 4.0% from 4.1% while the U6 unemployment rate (total unemployed, plus all persons marginally attached to the labour force, plus total employed part-time for economic reasons, as a percent of the civilian labour force plus all persons marginally attached to the labour force) was unchanged at 7.5%.
The civilian labour force leaped by 2,197,000, a seemingly big number. But it was due to a higher new census estimate, which underestimates immigration. That also impacted the employment level, which was up 2,234,000, and coincides with the population increase of 3,047,000. These numbers will most likely confuse many; however, these adjustments/revisions are not unusual.
There was even a big jump in not in the labour force from 979,000 to 102,871,000. Of that, 414,000 was due to a jump in the 65 and older category (retirees). The not in labour force no disability category for men jumped 313,000. The not in labour force with a disability category actually fell 235,000.
The labour force participation rate rose to 62.6% from 62.5%, while the employment population ratio was 60.1% vs. 60.0%. More people were working. Full-time employment rose 2,386,000 while part-time employment fell 17,000. The unemployment level (related to U3) was down 37,000. The weekly initial claims came in at 219,000, up from 208,000 the previous week and above the expected 215,000.
The big story for some was the upwardly revised nonfarm payrolls for December. For January, the job gains were seen in health care, retail, social assistance, and government (even as they try to cut government employment). Apparently, the wildfires in LA had no discernible impact on employment.
Average hourly earnings were up 4.1% year over year (y-o-y), above the expected 3.9%. The percentage of people holding two jobs rose to 5.3% from 5.2%. The average number of weeks unemployed fell to 22.0 from 23.7, while the average number unemployed 27 weeks or longer was up a small 21,000. The median number of weeks unemployed fell to 9.1 weeks from 9.8 weeks. The average work week slipped to 34.1 hours from 34.3 hours. Wage growth has been above expectations, which conflicts with the drop in the average work week.
Despite the lower nonfarm number, the stock market slipped while bond yields rose and the US$ Index was also reasonably flat. Gold was up on the weaker number. Expectations continue that the Fed will cut only twice in 2025. There was nothing in this report that would help the Fed cut more. This coming week we get the inflation numbers (CPI, PPI).
The Trump administration naturally claims that the jobs report was a disaster. However, economists would tend to disagree. The Goldilocks economy?
While the labour market continues to hang in, it is interesting to note that consumer confidence is flagging. The first reading of the Michigan Consumer Sentiment Index for February came in at 67.8, below last month’s 71.1 and below the forecast of 71.1. The Michigan Consumer Expectations Index dropped to 67.3 from 69.3 while current economic conditions fell to 68.7 from 74. Inflation expectations soared to 4.3% from 3.3% while longer-term inflation expectations ticked up to 3.3% from 3.2%. Sentiment down, inflation expectations up. Not a good sign.
The jobs market is a lagging indicator. But from what we are seeing, we expect that job growth could weaken in the months ahead. We are still on target for a recession, later this year.
Michigan Consumer Sentiment Index, Michigan 5-year Inflation expectations 2020–2025
Canada Job Numbers
Canada’s job numbers continue to surprise. In January, Canada added 76,000 jobs, well above the expected 25,000 and up for the sixth consecutive month. Canada broken? Doesn’t appear that way. The unemployment rate fell to 6.6%, down from 6.7% and below the expected 6.8%. Part-time work dominated as it added 40,900 while full-time work added only 35,200. Jobs came primarily in manufacturing, professional services, construction, and food services.
Ontario and British Columbia were the biggest recipients. Where there might be concern is that the R8 unemployment number that adds discouraged workers, waiting groups, and some part-time involuntary workers rose to 9.4% from 8.3%. The R8 unemployment rate is the highest reported by Statistics Canada.
Average hourly earnings were steady, up 3.7% y-o-y which was as expected. The labour force participation rate rose to 65.5%, up from 65%. All this has come before any expected tariffs from Donald Trump. The report has to be viewed as a gangbuster one. While other areas were up this past month, it was noted that the number of government workers fell by 8,400.
Does Canada have a Goldilocks economy? It’s hard to say, given that Canada is awaiting tariffs that may or may not come. The prime minister has also noted that Trump is apparently serious about annexing Canada, as he wants to control Canada’s minerals (and water). Bond yields ticked higher while the Cdn$ rose, given the stronger than expected numbers. Given the strong numbers, the expectation now is that the BofC will hold off on any rate hike next month.
Markets & Trends
| % Gains (Losses) Trends | ||||||||
| Close Dec 31/24 | Close Feb 7/25 | Week | YTD | Daily (Short Term) | Weekly (Intermediate) | Monthly (Long Term) | ||
| Stock Market Indices | ||||||||
| S&P 500 | 5,881.63 | 6,025.99 | (0.2)% | 2.5% | up | up | up | |
| Dow Jones Industrials | 42,544.22 | 44,403.40 | (0.5)% | 4.1% | up | up | up | |
| Dow Jones Transport | 16,030.66 | 16,147.19 | (1.0)% | 1.6% | down (weak) | up | up | |
| NASDAQ | 19,310.79 | 19,523.40 | (0.5)% | 1.1% | neutral | up | up | |
| S&P/TSX Composite | 24,796.40 | 25,442.91 | (0.4)% | 2.9% | up | up | up | |
| S&P/TSX Venture (CDNX) | 597.87 | 639.28 (new highs) | 2.5% | 6.9% | up | up | neutral | |
| S&P 600 (small) | 1,408.17 | 1,431.31 | (1.2)% | 1.6% | neutral | up | up | |
| MSCI World | 2,304.50 | 2,434.70 | 0.6% | 5.7% | up | up | up | |
| Bitcoin | 93,467.13 | 96,034.23 | (5.7)% | 2.8% | down (weak) | up | up | |
| Gold Mining Stock Indices | ||||||||
| Gold Bugs Index (HUI) | 275.58 | 327.29 | 4.7% | 18.8% | up | up | up | |
| TSX Gold Index (TGD) | 336.87 | 405.84 | 3.8% | 20.5% | up | up | up | |
| % | ||||||||
| U.S. 10-Year Treasury Bond yield | 4.58% | 4.49% | (1.1)% | (2.0)% | ||||
| Cdn. 10-Year Bond CGB yield | 3.25% | 3.10% | 0.3% | (4.6)% | ||||
| Recession Watch Spreads | ||||||||
| U.S. 2-year 10-year Treasury spread | 0.33% | 0.20% | (41.2)% | (39.4)% | ||||
| Cdn 2-year 10-year CGB spread | 0.30% | 0.39% | (9.3)% | 30.0% | ||||
| Currencies | ||||||||
| US$ Index | 108.44 | 107.93 | (0.3)% | (0.5)% | neutral | up | up | |
| Canadian $ | 69.49 | .7001 | 2.6% | 0.8% | up | down | down | |
| Euro | 103.54 | 103.29 | (0.4)% | (0.2)% | down (weak) | down | down | |
| Swiss Franc | 110.16 | 109.94 | 0.1% | (0.2)% | down | down | neutral | |
| British Pound | 125.11 | 124.09 | 0.1% | (0.8)% | neutral | down | neutral | |
| Japanese Yen | 63.57 | 66.10 | 2.5% | 4.0% | up | neutral | down | |
| Precious Metals | ||||||||
| Gold | 2,641.00 | 2,887.60 (new highs)* | 1.9% | 9.3% | up | up | up | |
| Silver | 29.24 | 32.44 | 0.6% | 10.9% | up | up | up | |
| Platinum | 910.50 | 1,020.80 | (2.2)% | 12.1% | up | up | up (weak) | |
| Base Metals | ||||||||
| Palladium | 909.80 | 982.40 | (8.3)% | 8.0% | up (weak) | up (weak) | down | |
| Copper | 4.03 | 4.59 | 7.2% | 13.9% | up | up (weak) | up (weak) | |
| Energy | ||||||||
| WTI Oil | 71.72 | 70.00 | (2.1)% | (1.0)% | down | down (weak) | down | |
| Nat Gas | 3.63 | 3.31 | 7.5% | (8.8)% | down | up | neutral | |
Week three of chaos continues and stock markets reacted negatively. Fear of tariffs, the chaos in the U.S. government with threats to fire two million employees or at least a chunk of them, lawsuits, protests, judicial rulings that correctly point out that Congress controls the U.S. Treasury and USAID not DOGE. On the week, markets shivered and tumbled. But so far not in a big way as the belief remains that Trump’s focus should be tax cuts and de-regulation that would be positive for the stock market.
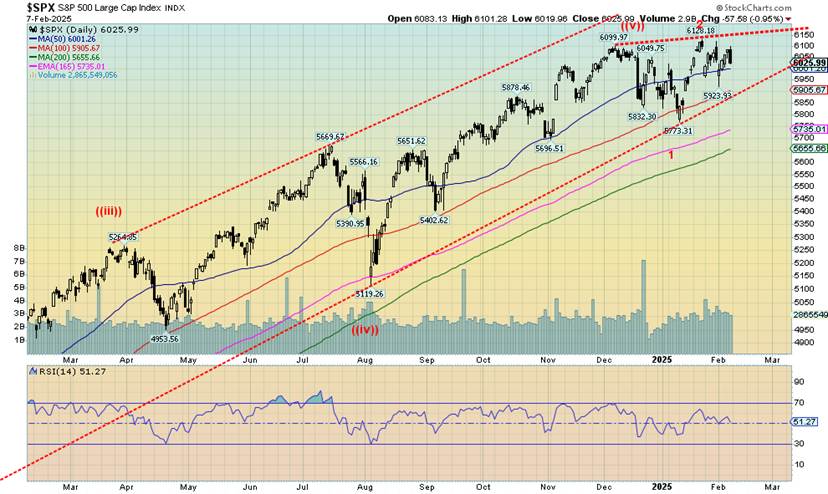
On the week, the S&P 500 (SPX) fell 0.2%, the Dow Jones Industrials (DJI) was off 0.5%, the Dow Jones Transportations (DJT) fell 1.0% while the NASDAQ dropped 0.5%. The S&P 500 Equal Weight Index fell 0.6% while some all-time highs from MAG7 stocks helped the NY FANG Index eke out a 0.5% gain. The S&P 400 (Mid) fell 1.0% while the S&P 600 (Small) dropped 1.2%. Are the days of all-time highs over? Can’t say yet.
In Canada, the TSX Composite was off 0.4% while the TSX Venture Exchange (CDNX) gained 2.5%. In the EU, the London FTSE made all-time highs, up 0.9%, as did the German DAX, up 0.3%, while the Paris CAC 40 rose 0.3% and the EuroNext was up 0.5%. In Asia, China’s Shanghai Index (SSEC) rose 1.6%, the Tokyo Nikkei Dow (TKN) fell 2.2%, while Hong Kong’s Hang Seng (HSI) rose 4.5%. The MSCI World Index was up 0.6%. Bitcoin fell 5.7% and continues to make what appears as a topping pattern.
A falling stock market (and Bitcoin) would be a vote against the Trump administration. But as long as the market thinks tax cuts and deregulation are coming, they might continue to hang in and even recover to new all-time highs. There is now a roof up there and the SPX needs to break out over 6,200 to confirm a move to new all-time highs. If, however, the SPX breaks down under 5,900, then the opposite could happen and we’d fall, with projections down to 5,500. That’s below the 200-day MA at 5,655. On the other hand, an upside breakout could project up to 6,500. Indicators continue to look bearish.
The pattern still looks bearish with a high in November, barely a new high in January, and lower highs since. Beware the downside break. Chaos reigns.
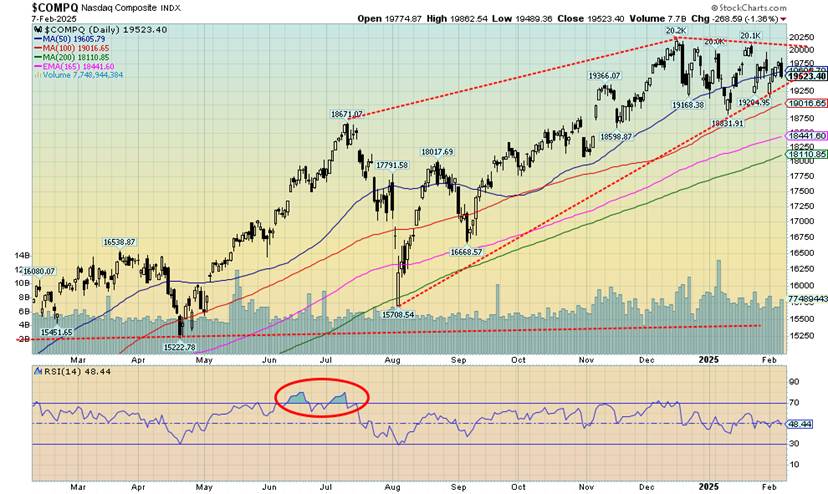
The NASDAQ continues to show signs of rolling over and failing. Led by the MAG7, the NASDAQ was the best performer of 2024. But so far in 2025 it is the weakest performer, despite being up 1.1%. However, that could fail. A break of 19,250 would likely do the trick. The 200-day MA is down at 18,110. The MAG7 took us higher, but it could also take us lower. Still, three of the MAG7 made all-time highs this past week, including Meta, Google, and Amazon. Also making all-time highs was Netflix.
However, Amazon and Google made their all-time highs, then reversed and closed lower on the week. Amazon fell 3.6% and Google dropped 8.9%. But the big MAG7 loser was Tesla, down 10.7% and looking even lower. Nvidia was a big winner, up 8.2% this past week. However, this looks like a correction not the start of new up leg. The NASDAQ almost appears to be making a bearish diamond pattern top. That’s rare. But a break of 19,250 would confirm a top and project down to 17,150, at least. Heed the warnings.
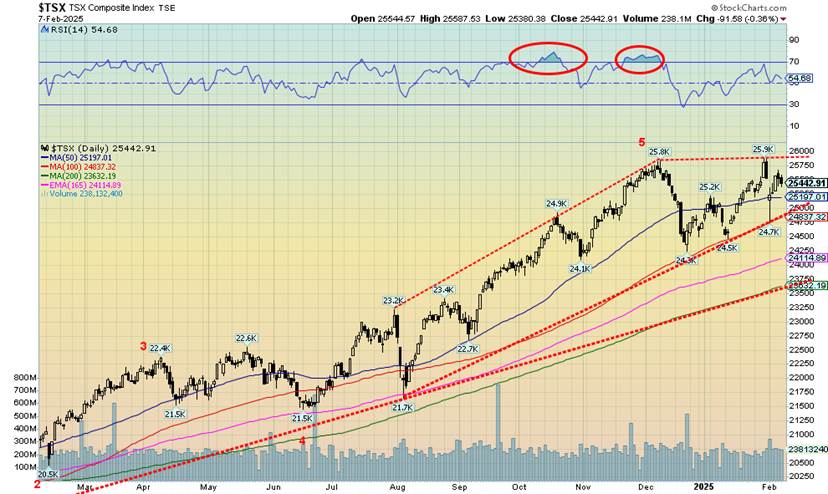
The TSX Composite didn’t buck the trend of falling stock markets this past week, but the loss was a small 0.4%. The TSX Venture Exchange (CDNX) did buck the trend, rising 2.5% to fresh 52-week highs. Despite the rise, the CDNX remains well off its most recent high of 1,114 seen in early 2021. Currently, the index is at 639. Over 50% of the CDNX is junior gold mining and mining stocks. We are seeing some movment in that market. On the week, seven sub-indices were up and seven were down. Leading the march down was Health Care (THC), off 4.2%. But the sector makes up only a small proportion of the index.
More significantly, the largest component Financials (TFS) fell 1.3%. Of the winners, the biggest was Golds (TGD), up 3.8%, followed by Metals & Mining (TGM) up 2.7% and Materials (TMT), also up 2.7%. These three sectors, along with Energy (TEN), remain our sectors to be in for 2025. At up 20.5% in 2025, TGD remains the best performer. As for the TSX, it now looks quite shaky. Yes, we made a slight new all-time high recently, but it was short-lived. There is a potential failure setup. A break now of 24,800 could send the TSX lower to that lower line near 23,500. The 200-day MA is at 23,632. Only new highs could change that scenario.
U.S. 10-year Treasury Note, Canada 10-year Bond CGB
Interest rates backed up slightly this past week, despite weaker job numbers and weaker consumer confidence. Fear of tariffs, which could be inflationary, won out. But that was at the end of the week, as earlier in the week yields fell. On the week, the U.S. 10-year treasury yield fell 5 bp to 4.49%. In Canada, strong job numbers helped push the Government of Canada 10-year bond (CGB) up to 3.10% or 1 bp. Surprisingly, the 2–10 spread fell back as inflationary fears drove the 2-year note higher. In the U.S., the 2–10 spread fell 14 bp to 0.2%, again because of fear of rising inflation, while in Canada the 2–10 spread fell 4 bp to 0.39%. Nonetheless, the 2–10 spreads remain in recession territory.
Interestingly, word came from the White House that, yes, they want lower interest rates, but they’ve switched from Powell bashing to bond market bashing. The Fed (and the BofC) control the short end of the market through Fed funds and the bank rate. But the long end is the purview of the bond market. The market for U.S. treasuries is huge, with some $28.3 trillion of outstanding T-bills, notes, and bonds. Of that, T-bills are $5.8 trillion, notes $14.0 trillion, and bonds $4.6 trillion.
There are also $2.0 trillion of inflation-protected notes (TIPS), and $570 billion of floating rate notes (FRNs), as of May 2024. The ratio is probably still the same with the current outstanding of $28.3 trillion of publically-traded securities. The remainder is held by intragovernmental departments, such as Social Security. Of the outstanding public securities, some $8.6 trillion is held by foreigners, of which Japan is the largest holder with $1.1 trillion. However, that is down slightly over the past year. A formerly large buyer was China. Today, they hold $768.6 billion, but that’s down from $782 billion a year ago.
Trump wants bond rates lower. Corporate bonds and mortgages are just two which set their rates at spreads above U.S. treasuries. But the bond market is huge, diverse, and international in size. The bond market does not respond to political pressure. They respond to inflation pressure or are guided by higher rates by the Fed and other central banks. Since the Fed began cutting rates they have lowered them by 1%, but longer dated bonds represented by the 10-year treasury note have, instead, gone the opposite way, rising roughly 1%.
If the Trump administration tries to meddle with the Fed or place tariffs, the bond market might react the opposite way they want it to. They’d sell U.S. securities and that in turn would raise rates, not lower them. The bond market is an Achilles heal as it is too big and too diverse. One cannot just say they want lower interest rates when they are doing things that would raise, not lower them. Chaos.
Bond yields could rise going forward.
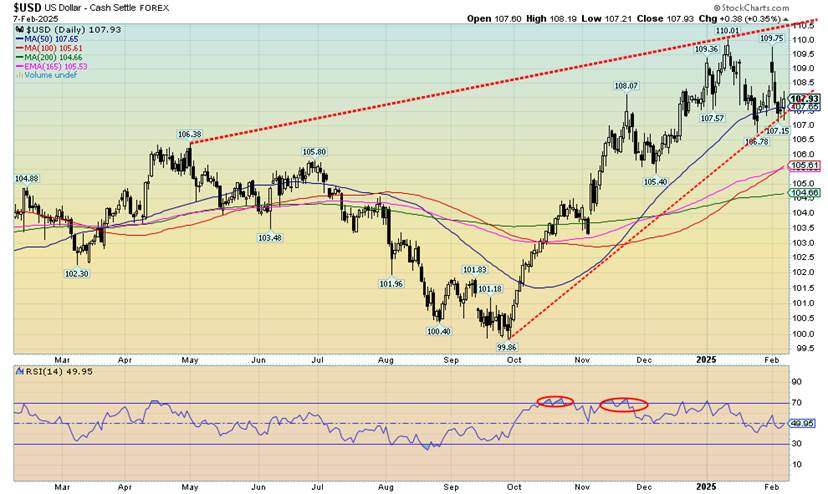
The US$ Index may have topped; however, we have not as yet broken down. We still need a firm break under 107/107.50 to suggest the top is in. However, we see a high, then a lower high, which usually signals that the next move should be down. A swing-down target could be 103.50. Note the 200-day MA support is at 104.66. On the week, the US$ Index was down 0.3%, the euro fell 0.4%, the Swiss franc was up a small 0.1%, the pound sterling gained 0.1% as well, while the Japanese yen, thanks to threats of higher interest rates, gained 2.5%.
The big winner on the week was the Cdn$, up 2.6% as the strong job numbers for January sparked a short covering rally for Cdn$. Overall, we remain negative on the U.S. dollar because of the current chaos in the U.S. Tariffs could perversely spark the US$ Index to rise.
Another week, another record high for gold prices. The gold bugs are happy. But silver bugs remained baffled as silver continues to be in the doldrums, well off its 1980 and 2011 high near $50 ($175 and $67 in inflation- adjusted dollars). In inflation-adjusted dollars, gold still hasn’t exceeded that 1980 high. Gold needs to get over $3,300 to achieve that. Still gold’s run has been impressive, now up 9.3% on the year, including 1.9% this past week. Silver impresses as well, up 10.9% so far but only a feeble 0.6% this past week. The gold stocks continue to rise with the Gold Bugs Index (HUI) up 4.7% and the TSX Gold Index (TGD) gaining 3.8%.
Other precious metals and near precious metals also have been rising, but not so much this past week. Platinum fell 2.2% while palladium was down 8.3%. However, copper broke out, rising 7.2% (see chart and commentary that follows).
We are seeing numerous recommendations from mainstream brokers and business writers to hold gold. Gold has caught all their attention. By that we mean physical gold in coins, bars, etc. Gold has no liability; however, gold stocks leveraged to gold prices do have liability. ETFs hold gold, but one needs to check how the fund operates as some may also hold stock. Gold, unlike Bitcoin, is real as you can touch it. As a monetary metal, gold has been around for 5,000 years and has acted as currency.
The collapse of the London Gold Pool in 1968 led to the U.S., under President Nixon, ending the gold standard due to calls on U.S. gold that would have left the U.S.’s vaults empty. At the time, U.S. dollars were convertible into gold at $35/ounce. Following the collapse of the London gold pool a two tiered market developed with the official rate still $35 while in the other market gold began to trade higher setting the stage for the end of the gold standard. We then entered the world of fiat currencies, where we have been ever since.
Gold is rising because of fear of tariffs and escalating trade tensions between the U.S. and China, and just about anybody. Gold, as we have so often stated, is a safe haven in times of geopolitical, domestic-political, and financial uncertainty. Today we have that in spades. Chaos and volatilty remain our themes for 2025.
London vaults are being cleaned out of gold (and silver). The amount of gold held in London fell a sharp 4.9 million troy ounces in January—a record. Traders, instead of rolling over futures contracts or cashing out have increasingly been asking for physical. They then take the physical and transfer it to vaults in the U.S. Fear of tariffs is driving the move. There is also increased demand from Asia. London still has a lot of gold, but supplies are dwindling.
Lease rates (borrowing costs) are rising, but discounts are being seen for gold stored there. The same thing has been happening with silver. This outflow is reminder of similarities that sparked the collapse of the London gold pool in 1968. All this is occuring despite no word from the Trump administration that gold and silver would be subject to tariffs.
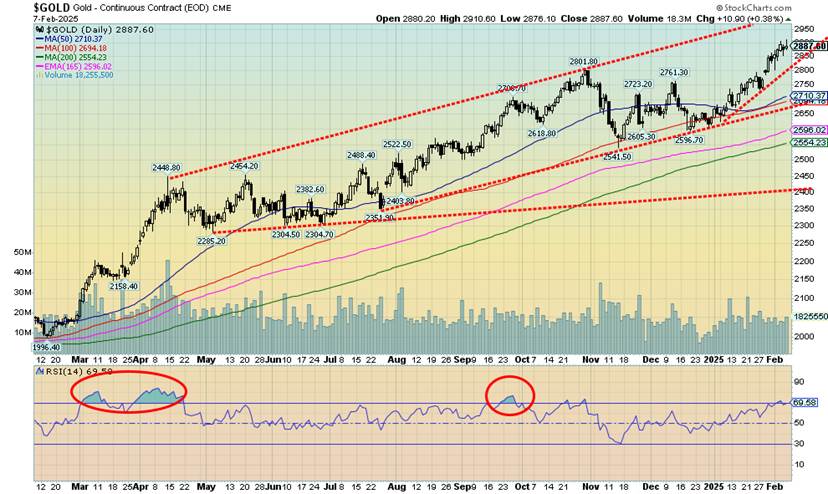
Gold is still rising in that channel that could take us up to $3,000 or higher. We are encountering some resistance at $2,900 and more might occur once we hit $3,000. That’s not unusual. Support is now $2,800. A breakdown under $2,700 could signal more losses. Under $2,500 we could be headed for $2,400. However, we believe, given the strong fundamentals for gold, the odds of a breakdown are low. Even in a stock market crash gold outperforms. Not so much the gold stocks.
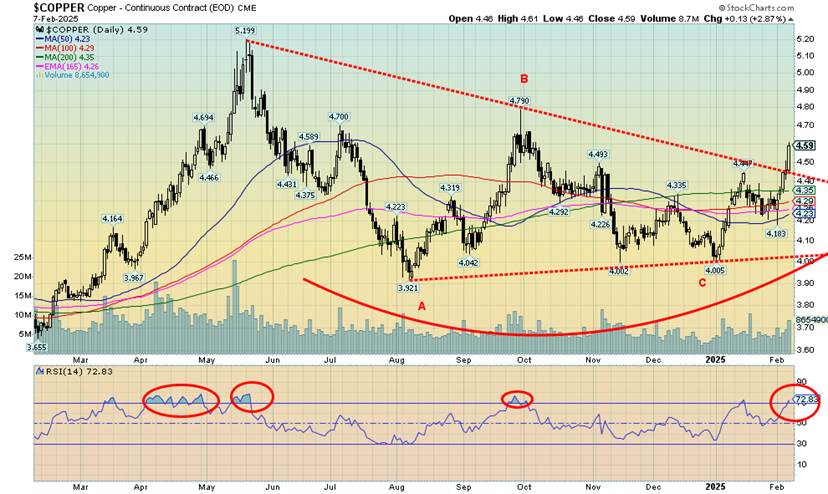
Copper has broken out. The downward correction that started with the top at $5.20 back in May 2024 appears to over. The correction unfolded in a good ABC-type correction. The correction formed a symmetrical triangle. With the breakout, the potential targets are up to $5.70. There is resistance at $4.70/$4.80. Once over $5.00, new highs become highly probable. The leading copper producer is Freeport McMoran (FCX), while Chile is the country with the largest copper production with some 27% of global production.
Chile also holds the largest reserves, estimated at roughly 19% of global reserves. We are currently entering overbought territory (RSI 72.4), but we note that overbought as a condition can remain for some time as we saw back in April/May 2024. Volume has picked up. We view copper as a leading indicator for gold. Copper is considered a near precious metal as coins in the past were made of copper. Copper with zinc is brass while copper with tin is bronze. Both brass and bronze are predominantly copper.

Frustratingly, silver still lags gold by a considerable margin. The gold/silver ratio sits at 89. In October 2024 it did fall to 78, but since then gold has been outperforming. The all-time low for the gold/silver ratio was 14.6, set at the height of the late 1970s frenzy. At the other end, the high was 131.4 set during the 2020 pandemic crash. Since that high, we appear to be forming a potential symmetrical triangle top.
We need to break under 75 to tell us that the next move should show silver outperforming gold. Near term, a break under 85 could confirm a top. Silver continues making what appears as a symmetrical triangle. But we need a firm breakout over $34 to suggest we’ll make new highs above $35.07. Targets could be up to $39/$40. A breakdown under $31 would be negative and could project down to $25. We don’t expect that, but do note it.
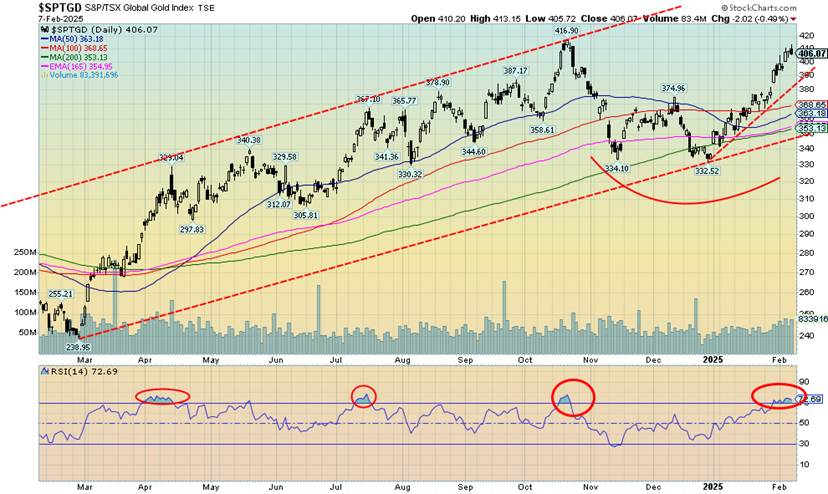
The upward march for the gold stocks continues. This past week the ARCA Gold Bugs Index (HUI) gained 4.7% while the TSX Gold Index (TGD) jumped 3.8%. What’s important was that the TGD exceeded 400, suggesting to us that we should see new highs above the October high of 417. The all-time high set in 2011 remains still away at 455. But that’s better than the HUI, which is still down 49% from its 2011 high.
Some of the key gold stocks have been making not only 52-week highs but new all-time highs. That bodes well going forward. We are also seeing some movement in the junior gold mining market, many of which trade on the TSX Venture Exchange (CDNX). On the year, the TGD is up 20.5% while the HUI is up 18.8%. So far, they have been the best- performing sectors. A break of 390 would be negative for the near term, but under 350 would start a bear market. The correction from the October unfolded nicely in ABC fashion.
It was another not so good week for oil. However, natural gas (NG) perked up. The threat of trade wars between U.S./China and U.S./just about anybody played on the market. As a result, the previous gains were soon given up and we were right back where we started in the year. Potential trade wars dampened the market. But further sanctions on Iran could, in theory, tighten the market. Sanctions were applied to individuals and tankers that Iran uses to send oil to China.
This comes on top of attempts to sanction Russian ghost tankers. The trouble with all this is there is starting to be a sense that many are fed up with sanctions. Iran, as head of OPEC, given that they are taking over the rotating presidency, is urging members to defy the U.S. Will they do so? It’s possible. Then how would the U.S. respond?
Trump wants lower prices and higher production. The trouble is, that doesn’t fit with his “drill, baby, drill” agenda. Oil executives have claimed that “drill, baby, drill” would primarily only be done in environmentally challenging locations such as Alaska. They need higher oil prices, not lower oil prices. But so far, the call for lower prices is winning out. However, we don’t see oil prices falling much more from here.
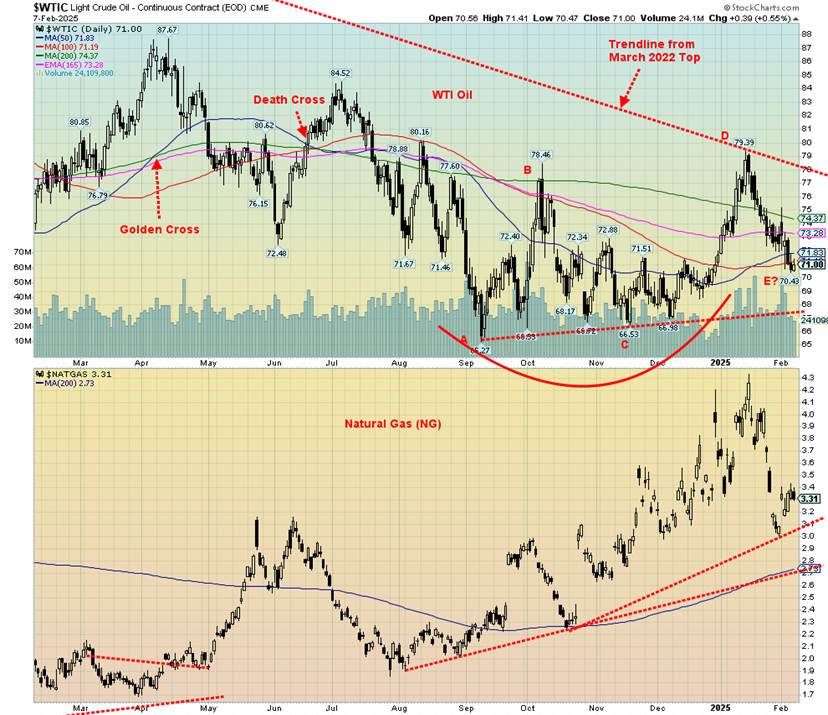
On the week, WTI oil fell 2.1% while Brent crude was off 2.3%. Natural gas (NG) perked up as the Henry Hub NG rose 7.5% and the EU Dutch Hub was up 4.4%, making new 52-week highs in the process. Colder weather and reduced gas reserves in the EU were driving NG price increases. As for stocks, the ARCA Oil & Gas Index (XOI) was up 0.9% while the TSX Energy Index (TEN) gained 0.4%.
Despite everything, we continue to see oil prices as forming a bottom. Initially, we appeared to break that downtrend from the 2022 Russia/Ukraine war high, but then we pulled back. The trendline is still viable, only this time we have to break over $78, preferably over $80. To the downside, we would not want to see a break of $68 as that could signal new lows ahead. Any breakdown could project down to at least the $54 zone.
Overall, we remain positive on the energy sector. However, we need to see a firm breakout above $80. A potential catalyst would be any outbreak of war between Iran and the U.S. Something that cannot be dismissed in the current environment.
__
(Featured image by Stevebidmead via Pixabay)
DISCLAIMER: This article was written by a third party contributor and does not reflect the opinion of Born2Invest, its management, staff or its associates. Please review our disclaimer for more information.
This article may include forward-looking statements. These forward-looking statements generally are identified by the words “believe,” “project,” “estimate,” “become,” “plan,” “will,” and similar expressions, including with regards to potential earnings in the Empire Flippers affiliate program. These forward-looking statements involve known and unknown risks as well as uncertainties, including those discussed in the following cautionary statements and elsewhere in this article and on this site. Although the Company may believe that its expectations are based on reasonable assumptions, the actual results that the Company may achieve may differ materially from any forward-looking statements, which reflect the opinions of the management of the Company only as of the date hereof. Additionally, please make sure to read these important disclosures.
Copyright David Chapman 2025
David Chapman is not a registered advisory service and is not an exempt market dealer (EMD) nor a licensed financial advisor. He does not and cannot give individualised market advice. David Chapman has worked in the financial industry for over 40 years including large financial corporations, banks, and investment dealers. The information in this newsletter is intended only for informational and educational purposes. It should not be construed as an offer, a solicitation of an offer or sale of any security.
Every effort is made to provide accurate and complete information. However, we cannot guarantee that there will be no errors. We make no claims, promises or guarantees about the accuracy, completeness, or adequacy of the contents of this commentary and expressly disclaim liability for errors and omissions in the contents of this commentary. David Chapman will always use his best efforts to ensure the accuracy and timeliness of all information. The reader assumes all risk when trading in securities and David Chapman advises consulting a licensed professional financial advisor or portfolio manager such as Enriched Investing Incorporated before proceeding with any trade or idea presented in this newsletter.
David Chapman may own shares in companies mentioned in this newsletter. Before making an investment, prospective investors should review each security’s offering documents which summarize the objectives, fees, expenses and associated risks. David Chapman shares his ideas and opinions for informational and educational purposes only and expects the reader to perform due diligence before considering a position in any security. That includes consulting with your own licensed professional financial advisor such as Enriched Investing Incorporated. Performance is not guaranteed, values change frequently, and past performance may not be repeated.


The TopRanked.io Weekly Digest: What’s Hot in Affiliate Marketing [LiveChat Affiliates Review]
Quick Disclosure: We’re about to tell you how LiveChat Affiliates run a top-notch affiliate program. And we really mean it....


German SMEs Face Tighter Bank Lending, Turn to Alternatives
Access to bank loans for German SMEs is tightening despite strong financing needs. About 37.8 percent face restrictive lending, driven...


Bitcoin Stalls as Geopolitical Risks and Crypto Industry Tensions Persist
Bitcoin is moving sideways near $72,000 amid ongoing Iran tensions, while ETF inflows remain strong. Quantum security debates continue. Ethereum...


Geopolitical Tensions and Trade Disruptions Reshape Global Commodities Markets
Geopolitical tensions and disrupted trade routes, especially around the Strait of Hormuz, are reshaping global commodities markets. Agriculture faces supply...


Germany Sees 413 Cannabis Cultivation Clubs Two Years After Partial Legalization
Two years after partial cannabis legalization in Germany, 413 cultivation clubs have been established nationwide. Lower Saxony leads in clubs...
 |
|
 |  |
 |
|
-

 Crypto4 days ago
Bitcoin Leads Crypto Rally as Iran Ceasefire Boosts Markets
-

 Africa2 weeks ago
Casablanca Climbs the Global Financial Ranks
-

 Business7 days ago
Dow Jones Rebounds as Markets Shrug Off Iran Conflict
-

 Impact Investing4 days ago
Switzerland Aligns Corporate Sustainability Rules with EU Standards