Featured
Markets Appeared To Be Prepping for a Summer Rally
What could a summer rally look like? Gold and silver look the best they have been in the past few months with sentiment almost at rock bottom lows. But how high can they get when even bigger losses potentially look into 2023. The same with the stock market that looks poised only to put in a rebound rally until a third wave down occurs later this year or into 2023.
If one thinks that inflation and recession are the only looming problems, one should probably think again. People do not like to think the worst is coming. It’s better to hear sunny news rather than bad news, or gloomy news, or just plain depressing news. But, every day, we seem to be getting a steady diet of the latter. Whether it is higher than expected inflation, central banks hiking interest rates, a war that drags on, yet another mass shooting, or an outage by a major telecom company, the headlines in the business section are anything but upbeat. Okay, we can always find one tucked away somewhere.
An expression we’ve seen a number of times recently from analysts is we’re not headed for a recession—we’re headed for the “Greater Depression”. “Greater Depression”? What? Is this something from the famous Dr. Doom, Marc Faber author of the Gloom Boom and Doom report? Or Dr. Gloom Peter Schiff, CEO of Euro Pacific Capital? Actually, they may just be the latest Dr. Doom and Dr. Gloom. We still remember the 1970s when Dr. Doom was Henry Kaufman, Chief Economist of Salomon Brothers and Dr. Gloom was Albert Wojnilower, Chief Economist of Credit Suisse First Boston. Apparently, Dr. Fauci was nicknamed Dr. Doom and Gloom by Donald Trump, but that’s a different story. Also carrying the mantle of Dr. Gloom is economist Nouriel Roubini. Many others might aspire. Cassandras can be popular, but not necessarily for politicians, business leaders, and the heads of central banks. Faber, Schiff, and Roubini had become noteworthy earlier by predicting things like the housing sub-prime collapse that led to the Great Recession.
Still, the “Greater Depression” is not some dark fairy tale. As we watch events unfold, it could become reality. Even Goldman Sachs has gotten in on the gloom with their call that “the world is on the brink of a rather severe recession.” During the Great Depression of 1929–1939, the U.S. stock market fell 89% during 1929–1932 (Dow Jones Industrials (DJI)), U.S. unemployment soared to 25% at its peak in 1933, and the U.S. economy contracted 26.7% at its worst. The Great Depression also lasted throughout the 1930s, although officially it was two depressions: from 1929–1933, lasting 3 years 7 months, followed by the 1937–1938 recession, which lasted one year and one month.
Would it get that bad? Probably not, although the brief pandemic recession of 2020 saw unemployment soar to 14.7% and an economic contraction of 19.2%. Officially, however, the recession lasted only two months as it was being bailed out by trillions of dollars of QE, zero-percent interest rates, and billions more in assistance for those displaced.
The Great Depression was worldwide. It helped lead to World War II: the period saw the rise of nationalism, including the rise of the Nazi party in Germany (1933), and also included the rising nationalism of Italy and Japan. The Western economies at the time were not immune as the period saw the rise of numerous populous leaders whose policies did not differ substantially from Germany’s Nazi party. Few if any, however, gained power.
So, what about today? Economist Nouriel Roubini (Dr. Gloom?) has warned us before that we face a number of rising problems (The Guardian, April 29, 2020). All of what he noted then has only intensified. All of these rising problems have been noted here in this column, but it appears they constantly need refreshing as we head into what might be the most difficult decade we’ve ever experienced. This is just a summary, but they definitely need to be kept in mind.
- Debt: global debt now surpasses $300 trillion, and is more than twice as high as it was in 2008 at the time of the sub-prime financial crisis. Numerous sovereign countries are either in complete debt collapse or on the brink. We can’t list them all as they are quite numerous, but headlining the list is the recent debt collapse of Sri Lanka and the forced debt default of Russia. However, others are wavering or are already cup-in-hand to the IMF: Pakistan, Egypt, Argentina, Ukraine, El Salvador, Ghana, and Ethiopia are amongst the biggest at risk. Russia was forced into an artificial default due to sanctions and the refusal of the U.S. to allow Russia the use of the global payments system SWIFT. There are many other countries whose finances are stressed out. Corporate and consumer debt are at risk as well and the dangers there may be higher than with countries. With 57% of U.S. corporate bonds at BBB, the lowest investment grade, it wouldn’t take much to push a number of them over the edge into junk bond status. The recent collapse of the cryptocurrency market—along with numerous crypto platforms and now some large hedge funds—is, we believe, but the tip of the iceberg. Even Quebec’s Caisse de dépôt, a public manager of pension funds, was caught with a $400 million investment in the recently bankrupt Celsius, the giant crypto loan company that declared bankruptcy this past week with some $4.7 billion at risk of default. Consumer debt is vulnerable to a housing downturn and job losses. Canada, for example, has one of the highest household debt to income and GDP in the world. Debt to income alone is at 180%, the fourth highest in the world, behind only Norway, Denmark, and the Netherlands.
- Inflation/deflation/stagflation: with the recent rise in U.S. inflation to 9.1% year over year (y-o-y), all the talk now is turning to the Fed hiking interest rates at the July 26–27 meeting. The Bank of Canada (BofC) shocked everyone by hiking the bank rate 1% at its July 13 meeting. The market had expected only a 75 bp hike. Officials are saying that the rate hikes are necessary to bring down the high rate of inflation. The expectation (hope?) is that it causes only a mild recession, the proverbial soft landing. But the reality is that they can’t really say anything else without sparking a panic. The stock market has been predicting a recession for some time with most stock market indices now down 20% or more from their highs in a mere six months. The yield curve is inverting, a move that is usually seen up to six months before an official recession is announced. Debt collapse is deflationary. The collapse of the cryptocurrency market, along with the recent sharp drops in commodity prices, all could conspire to bring bankruptcies and more as we move deeper into the coming financial crisis. Stagflation comes as a result of high inflation accompanied by a slowing or recessionary economy, a condition that existed throughout the 1970s with high inflation accompanied by steep recessions in 1970, 1974–1975, and 1980–1982. During that period stock markets were stagnant but commodities soared. It is interesting to note that the 1970s saw a war between the Arab World and Israel. That helped to trigger the Arab oil embargo, sparking a sharp rise in the price of oil and long line-ups at the pumps. Later, we had the Iranian hostage crisis that sparked another sharp rise in the price of oil, pushing inflation and eventually interest rates to unheard-of levels. Today, it’s the Ukraine war coupled with sanctions against Russia that helped spark a huge run-up in the price of oil, contributing to the rate of inflation and high interest rates we are faced with today.
- Demographics: Roubini sites the ageing populations of the advanced economies (G7) as a risk because of the growing need for expenditures on health care and social security. Yet, looking at the balance sheet of the U.S., we discover that they have unfunded liabilities of $170 trillion related to Medicare and Social Security. No word on how this will be funded. People 65 and older could constitute some 25% of the population of the Western economies as we move further into the decade and towards 2050. This has the potential to put enormous strain on the health care systems, something we are already seeing.
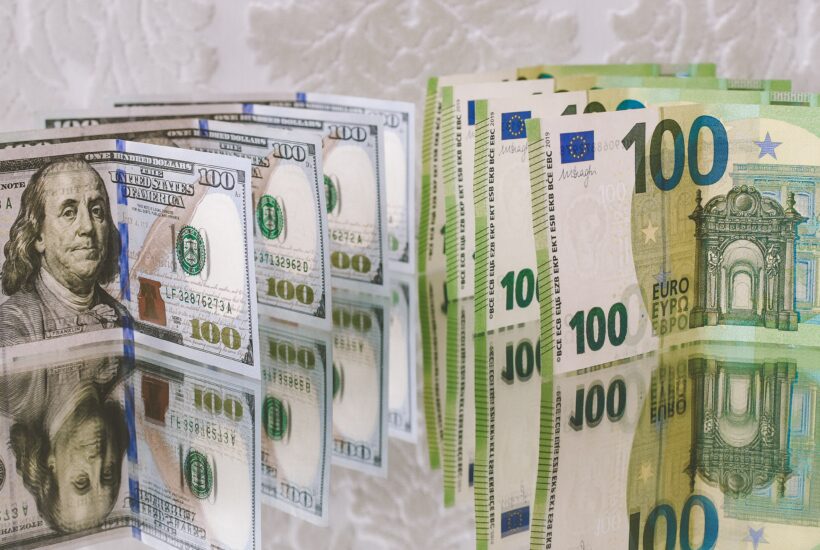
- Currency debasement: with the sharply rising U.S. dollar, that means other currencies are falling in value. The euro is now at par with the U.S. dollar and the pound sterling could soon join it. But the real risk of currency debasement and collapse lies with emerging economies in Africa, Asia, and Latin America. Massive amounts of debt and sharply expansionary monetary policy could help unleash a wave of sovereign debt defaults, especially for those who borrowed in U.S. dollars. One can monetize the debt for only so long. The emerging market economies are very vulnerable, considering high borrowings in U.S. dollars and their revenues in the devaluing home currency. What it means is that it requires more and more to service their debt until it becomes unsustainable.
- Supply disruption and deglobalization: the pandemic accelerated trends of balkanization and fragmentation that were already underway. The U.S. and China are the most obvious, but their
decoupling threatens the global economy. While many are calling for bringing all that offshore manufacturing back onshore, that could be a false premise as it could speed up instead the trend towards automation. Robots are cheaper and don’t go on strike. Trade wars, sanctions, and more are what helped push the world into the Great Depression. Is this just history repeating itself? Yes and no. It is more like history could be rhyming, but the end result could be the same—another Great Depression.
- Rising nationalism and populism: if one thought that nationalism and populism couldn’t appear in Canada and the U.S., think again. The rise of MAGA in the U.S.—culminating in an attempted overthrow of the recent election which ultimately would result in the overthrow of the U.S. government itself on January 6, 2021—is the starkest evidence. In Canada, there was the occupation of Ottawa for a three-week period that started on January 28, 2022 and ended on February 20, 2022 by a group billing themselves as the “Freedom Convoy”, where one of its expressed purposes was the overthrow of the government of Canada. There were other blockades across the country at some key border crossings. It required the never before used “Emergencies Act” to be invoked to end the occupation. These putsches failed. However, a reminder that the “Munich Putsch” in Germany in 1923 also failed but didn’t stop the rise of Adolf Hitler and the Nazi Party. Once again, does history rhyme?
- The stand-off between the U.S., China and Russia: the current war in Ukraine may be the most visible part of this stand-off. The U.S. is on record saying they want to weaken Russia, and that the war in Ukraine is the proxy. NATO and the U.S. have heavily armed Ukraine to fight Russia, risking in turn for this to be an attack on NATO itself. China is consistently viewed as the biggest threat to U.S. global hegemony through the building of its Belt & Road Initiative (BRI), attempts to build an alternative system to U.S.-dominated institutions such as the World Bank, the IMF, and the global payments system SWIFT, plus an attempt to move away from the U.S. dollar as the world’s reserve currency. Some believe that this stand-off, which could be called the new “Cold War”, could turn into a real “Hot War”. Economist Martin Armstrong (www.armstrongeconomics.com) has consistently predicted (according to his “cycles of war”) that the world is headed into a new global war that will intensify over the next decade. There is, so far, little evidence to suggest that he might be wrong. World War III with nuclear weapons?
- Environmental disruption: this could wreak more damage than a financial crisis. Epidemics, climate change, hunger, and poverty are all largely man-made, although evidence does support that the world does go through periods of climate change, resulting in extreme periods of either warming or freezing. Except the world did not have 7.8 billion people in previous periods. Severe epidemics in the past wiped out, in some cases, one-third to one-half of the population (Black Death 1346–1353). Grant you, they did not have today’s medicine and vaccines to combat the epidemic. The belief is that the current period of global warming is exacerbated by man through industrialization. We have seen a sharp rise in the frequency and severity of storms, heat waves, droughts, floods, tornados, hurricanes, volcanic eruptions, tsunamis, plus man-made destruction of habitat leading to mass extinctions. All of these have caused death and destruction with losses running into the billions, even trillions.
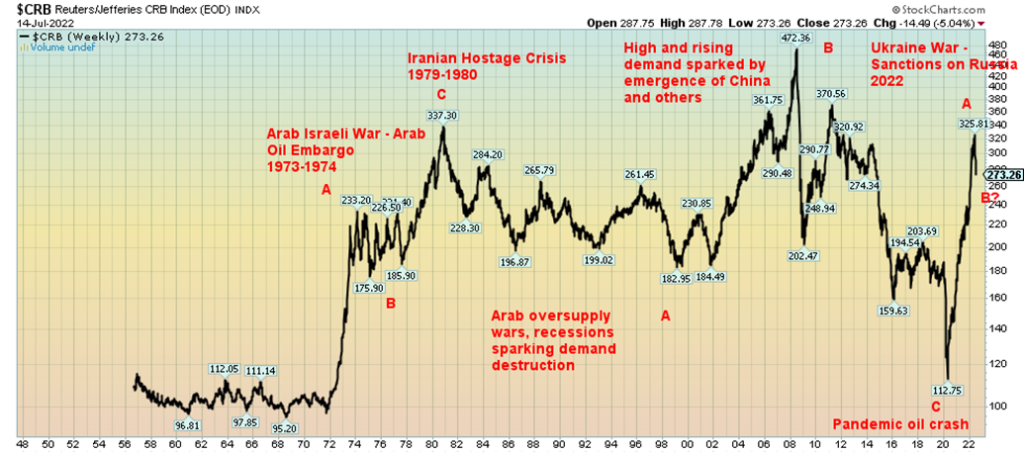
Our long-term chart of the CRB Index shows the sharp rise in commodity prices led by energy (constitutes upwards of 40% of the CRB Index) during the 1970s. Sharply rising commodity prices, especially energy, contributed to the sharp rise in inflation during the 1970s. Our labeling highlights the rise in energy prices but the rise in commodities overall, including the record run for gold, also contributed to the inflationary 1970s. Record high interest rates brought down the rate of inflation and eventually the price of commodities through the 1980s and 1990s. But the high interest rates also sparked the deep recession of 1980–1982 when U.S. unemployment soared to about 11% (official unemployment) and the economy contracted by upwards of 3%.
Stock markets performed poorly throughout the 1970s but soared during the 1980s and 1990s as inflation fell sharply. Oil prices soared again during the 2000s as demand increased sharply, thanks to the emergence of China and other Asian countries. Stock markets also performed poorly during this period. However, when commodity prices once fell sharply during the 2010s, culminating in the pandemic crash of March 2020, stock markets once again soared. However, with oil prices and commodities rising sharply once again, inflation is soaring and stock markets once again are wavering and most likely will go through a difficult period, not unlike 1966–1982 and 2000–2009. The CRB Index has recently pulled back from the highs, so a period not unlike 1975–1977 may follow before commodity prices soar once again.
A Big-Picture Review of Markets
Performance Selected U.S. and Canadian Markets: Year to date, 5 years, 10 years, and 20 years
| Index/ETF | Year to Date 2022 Performance Gain/Loss % | 5-Year Performance 2017–2022 Gain/Loss % | 10-Year Performance 2012–2022 Gain/Loss % | 20-Year Performance 2002–2022 Gain/Loss % |
| Canadian Market | ||||
| TSX Composite | 12.5% | 23.1% | 62.8% | 170.8% |
| TSX Venture Exchange (CDNX) | 36.5% | 21.3% | 49.3% | 47.6% |
| TSX Financials (TFS) | 14.3% | 21.2% | 101.2% | 230.6% |
| TSX Technologies (TTK) | 39.8% | 109.6% | 492.0% | 683.4% |
| TSX Energy (TEN) | 28.5% | 23.6% | 8.8% | 71.4% |
| TSX Golds (TGD) | 10.7% | 39.6% | 8.2% | 34.3% |
| Short Term Bond Index (XSB/T) | 4.6% | 4.5% | 12.5% | 80.0% |
| Universe Long Term Bond Index (XBB/T) | 11.9% | 1.8% | 15.9% | 114.6% |
| Premium Money Market (CMR/T) | 0.3% | 4.2% | 7.5% | 12.4% |
| Gold in Cdn$ | 3.0% | 45.0% | 39.7% | 363.5% |
| U.S. Market | ||||
| S&P 500 | 20.6% | 55.2% | 184.6% | 309.0% |
| NASDAQ | 28.8% | 79.0% | 291.7% | 715.5% |
| Russell 2000 (IWM) | 23.4% | 28.0% | 147.9% | 434.6% |
| S&P Financials | 20.3% | 25.0% | 169.3% | 63.5% |
| ARCA Oil & Gas Index (XOI) | 19.4% | 26.4% | 21.7% | 177.2% |
| Gold Bugs Index (HUI) | 16.6% | 17.4% | 46.2% | 58.3% |
| 10-Year U.S. treasury note (UST) | 9.0% | 5.2% | 11.4% | 9.0% |
| 30-Year US Treasury Bond (USB) | 13.8% | 8.3% | 8.7% | 33.7% |
| Short Treasury Bond ETF (SHV) | 0.2% | 5.0% | 5.8% | 14.6% |
| Gold | 4.9% | 41.7% | 9.6% | 443.1% |
Amidst all of the turmoil in markets, it is sometimes good to look at the big picture to see where we are. Our table above shows the performance for a select number of markets for 5, 10, and 20 years as well as 2022 to date. We highlighted the biggest winner and loser for each period.
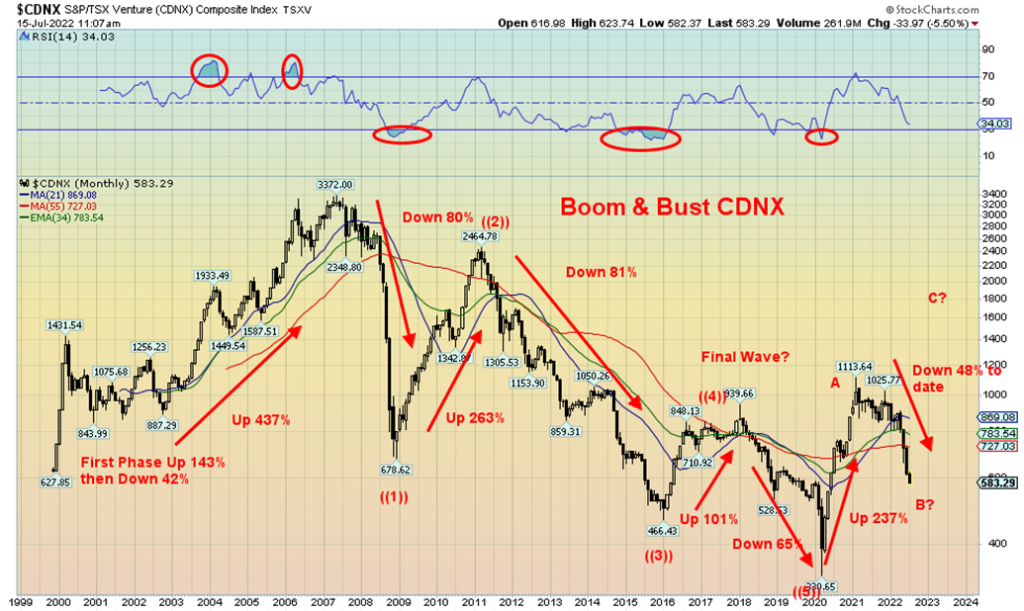
From the table, it appears as if the TSX Venture Exchange (CDNX) has been an utter disaster as the biggest loser for 5, 10 and 20 years and the second biggest loser so far in 2022. The CDNX can have some wild rides up and down. A massive 280% gain from 2002 to 2007 was followed by a massive collapse of 80% into 2008. The rebound into 2011 was a 265% gain, but once again it was followed by an 82% drop into 2016, another 100% gain into 2018, and yet another collapse of 65% into the March 2020 pandemic low. Another 236% gain was seen in 2020 to 2021 before the current drop got underway, shedding 48% so far. Catching those up-swings is key. So far, we see a possible A wave up and we are currently working on what may be a B wave. To come would be a powerful C wave up. However, we don’t know when it will start or how high it might get yet. But the signs are positive going forward, if not immediately. Timing is possibly starting in 2023?
Below is a monthly chart of the S&P 500 (will act as a proxy for all the major indices) dating back to 1998. It highlights the high-tech/dot.com crash of 2000–2002 as well as the Sub-Prime Financial Crisis of 2007–2009. The sub-prime crash was, we believe, a historic 6-year (previous 2002), 18-year (previous 1987 & 1990), 36-year (previous 1974), and 72-year cycle low (previous 1932). The next 6-year cycle low (range 5–8 years) is due sometime now into early 2024 but quite possibly earlier. The March 2020 low was, we suspect, a 9-year (half cycle of 18-years) as its range is 7–11 years and it came 9 years after the March 2009 low. The next 18-year cycle low is due ideally in 2026–2029. That low could also be a blow for the little-seen or understood 90-year cycle. The last one was 1932 during the Great Depression. It would be fitting if this was the Greater Depression low. But what’s interesting is we can see considerable support for the S&P 500 down to that uptrend line currently near 3,000.
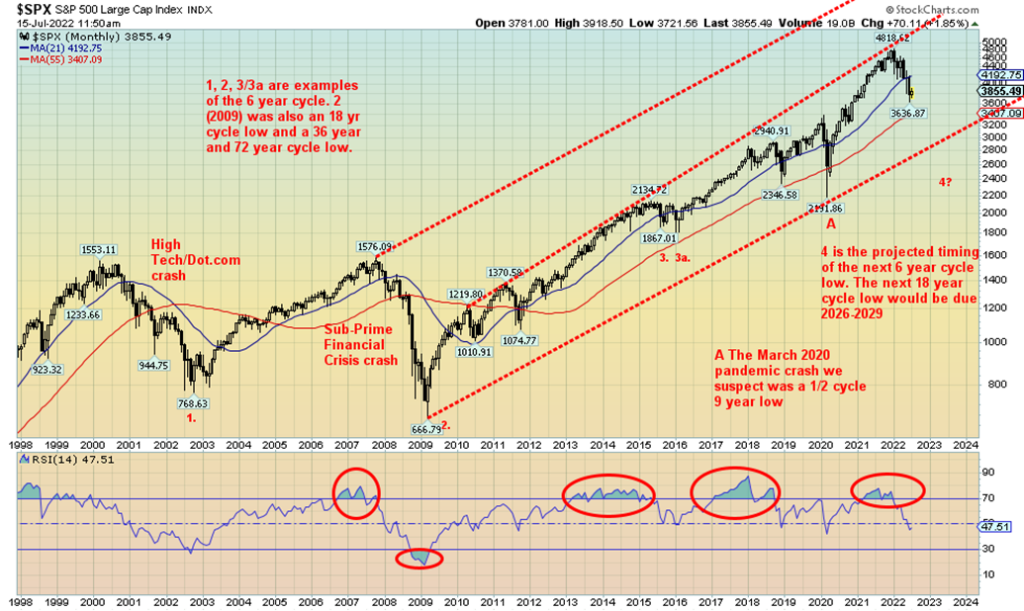
It is very possible that the January 4, 2022 top for the S&P 500 was also the top of the current 18-year cycle. That doesn’t mean we go straight down for the next 4–7 years. There could well be some good rebound rallies in between. But as long as the S&P 500 holds that uptrend line from the March 2009 low, the uptrend remains intact. It’s important to keep that in mind as we go forward and despite the pain that has been inflicted over the past six months. Bear markets typically last at least a year to two years. By that definition we are at best half-way through this one and could be only a third of the way through. Signs continue to point to a possible rebound rally starting now or later in the month or early August.
Our chart below of gold and silver shows that they both broke out of long bases that had run from 2011 to 2019/2020. Gold broke out in 2019 while silver followed in 2020. Gold soared to new all-time highs above the $1,924 high seen in September 2011. Silver has come nowhere near its high near $50 made in April 2011. That is a significant divergence with gold. Since then, both gold and silver have been forming what many believe is the handle of a multi-year cup and handle pattern. But is it complete? Or is the pattern actually valid?
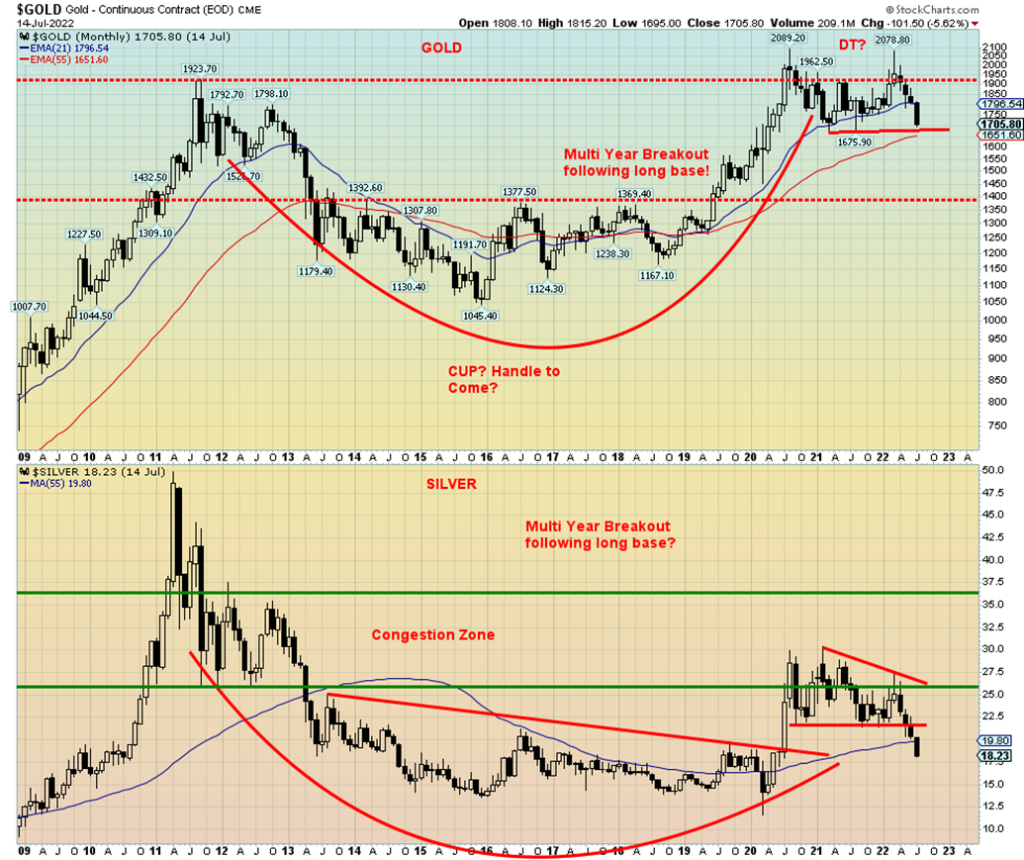
If the pattern remains true as a cup and handle, it is becoming an awkward-looking handle with a downward hook tilt. Doesn’t mean it’s wrong, but it is suggesting to us that the pattern is not yet complete. Gold has made what appears as a double top in August 2020 at $2,089 and again in March 2022 at $2,079. Silver has come nowhere near its former high. Silver’s high for this move was seen in February 2021 at $30.35. Since then, it has been on a downward slant.
If the double top for gold is correct, the neckline is the 2021 lows seen in March and August near $1,675. That becomes our neckline. Silver’s downward slant is taking on the shape of a descending triangle with lower highs and a relatively flat series of lows near $21.40. Silver has now broken down under its triangle support and has also clearly taken out the 55-month exponential moving average (EMA). Targets for silver’s triangle pattern are down around $12.50. Silver has also been making new lows while gold has not. Another potential divergence.
The double top on gold with a neckline around $1,675 suggests that once that neckline breaks, potential targets could be down to $1,260 with minimum objectives down to $1,500. That would be below the current 55-month EMA at $1,650. Overall, this is not a pretty picture. But declines to those levels, which we cannot rule out, could help set up our major cycle lows of the 7.83-year cycle last seen in December 2015 and the 23–25-year cycle last seen in 1999/2001. We have also noted the 31.3-month cycle that last bottomed with the March 2021 and August 2021 low near $1,675. According to cycles analyst Ray Merriman (www.mmacycles.com), the ideal time for all three cycles to overlap is anywhere from September 2022 through to March 2023. We say that, even though the ideal overlap for both the 7.83-year and 23–25-year cycles is October 2023 to April 2024. It is possible we get double bottoms through that period.
This is a bit of kill-joy for the gold bugs. But the reality is the U.S. dollar has been strong with the US$ Index recently making new highs. The US$ Index has been on the rise now for some 14 years. We are very late in the cycle of what Merriman believes is a 15-year cycle. This, most likely, is the blow-off phase. High U.S. interest rates (over both Japan and the EU) plus the war in Ukraine and a faltering banking system in China are seeing capital flee those zones for the supposed safety of U.S. treasury securities. A rising U.S. dollar is not friendly for gold. Gold in U.S. dollars has fallen now 18.4% from its August 2020 high. But gold in euros is down only 11%, gold in Japanese yen is down 12%, while gold in pound sterling is down just under 18% from their respective all-time highs. Gold in Cdn$ is down roughly 14% from its all-time high seen in August 2020.
Of bigger concern are the gold stocks. The Gold Bugs Index (HUI) has fallen 45.6% from its August 2020 high while the TSX Gold Index (TGD) is down 41.1% from its August 2020 high. Both have firmly broken down under the 55-month EMA and have recently been making fresh 52-week lows. However, both are in what appears to be a bear channel and currently, both are near the bottom of the channel. With the Gold Miners Bullish Percent Index BPGDM currently at 10.3, not much above where it was in March 2020, there is potential for at least a short-term bottom. Sentiment overall for gold and silver is extremely low and the recent commercial COT is at its best level we’ve seen in months. All of this suggests we should see a rebound rally soon. How high the rebound rally can get we don’t yet know; however, we are unlikely to see new highs. Gold would have considerable resistance up around $1,900. Precious metals investors should be wary of this rally and be prepared to raise some cash as a precaution against a potentially bigger drop later into 2023.
As our chart of WTI oil shows, it has broken out of a huge multi-year pattern that had been forming since the historic 2008 high near $147. It’s a disturbing chart in that, in theory, could be pointing to an eventual rise for WTI oil to over $200. That is not difficult to imagine if the current Ukraine war took even more dangerous twists, resulting in attempts to bury Russia that backfire on the West. Sanctions on Russia have already seen the price of oil soar almost 50% since the beginning of 2022. Yet Russia still sells its oil as the West teeters on the brink of recession, partly because of inflation sparked by high oil prices. As well, rumors have swirled about an attack on alleged Iranian nuclear facilities. That in turn could trigger a Middle Eastern crisis for the world’s biggest oil chokepoint, the Straits of Hormuz, where 21% of the global supply of oil flows through.
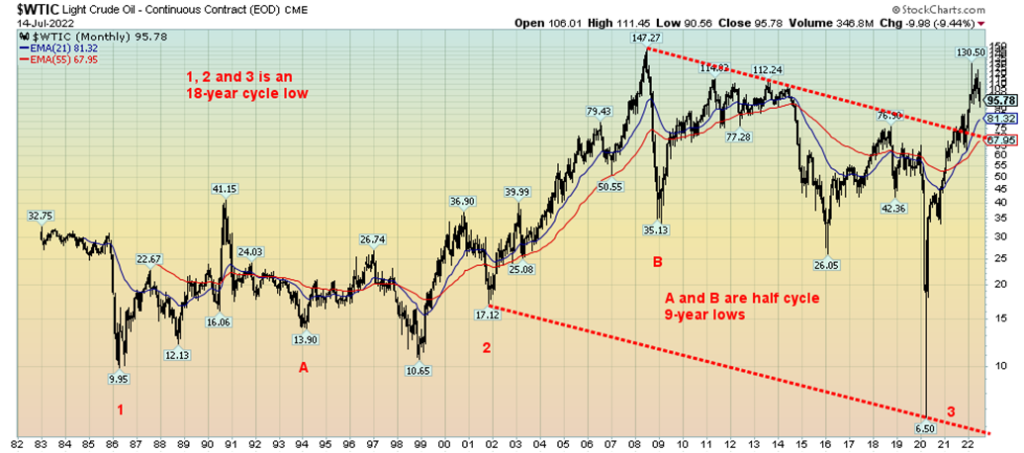
Short-term oil prices could see more downward movement. This chart doesn’t really show it but the daily charts are showing a potential double top at $130.50 in March 2022 and again at $123.68 in June 2022. Since then, WTI oil has broken down below what might be the neckline near $103.00. Potential targets are down to $65 with minimum objectives down to $88.50/$89.00. With a low thus far of $90.56 we are getting close.
Interest rates have been on the rise. For years, central banks of the world have kept interest rates artificially low in the hopes of stirring the economy into growth and helping to prevent a steep recession. Central banks of the world started becoming more accommodating after the 1987 stock market crash, hoping to prevent a repeat of the 1970s that saw two steep recessions in 1974–1975 and 1980–1982. The accommodation only heightened following more events in the 1990s of the Mexican peso crisis (1994), the Asian contagion (1997), and the Russian default/LTCM debacle of 1998. Each time it was more of the same: lower interest rates and flooding the financial system with liquidity. Then came the 2000s with the high-tech/dot.com crash and the 9/11 crisis, followed by the 2007–2009 sub-prime housing crash and financial crisis.
Each time central banks lowered interest rates to zero (or even sub-zero as they did in some eurozone countries and Japan) and flood the system with liquidity to prevent the markets and the economy from imploding. Add in the March 2020 pandemic panic and the central banks were operating on steroids, bailing out everyone. Governments added to a massive injection of money with support programs for businesses and individuals. It saved the economy from falling into what potentially could have been a very steep recession but at the cost of injecting so much money, it has helped feed the current inflation as demand soared following the lifting of mandates once the COVID eased.
The Fed used to focus on the economy and borrowings. Now they focus on interest rates. The result of all of this was it fed the speculative bubbles—the 1990s high-tech/dot.com bubble, the early 2000s housing bubble, and the 2010s everything bubble. And now that too is imploding. Having left interest rates too low for too long, the central banks are now scrambling to put a lid on the inflation sparked the massive liquidity injected into the financial system (M1 (money supply) in the U.S. up 1,360% since 2008 and M2 up 162%), by supply-disruptions and the war in Ukraine that resulted in sanctions on Russia, sending the price of oil soaring. The U.S. reported a 9.1% y-o-y gain in the CPI and rumors are swirling that the Fed will hike 1% at its July 26–27 meeting. The Fed has also been trying to cut back on credit excesses. The long periods of low-interest rates have encouraged borrowing by governments, corporations, and households, reaching excessive levels. U.S. federal debt is up almost 200% since 2008 over $20 trillion, household debt is up 37% or roughly $7 trillion, while corporate debt (financial and non-financial) is up 63% or $15 trillion. Households in the U.S. are actually in better shape today then they were in 2008. However, in Canada, they are not.
While Fed officials believe all this will cause only a mild recession, pundits are saying the exact opposite. It could cause a steep recession (Goldman Sachs) or worse (Nouriel Roubini). While long-term rates have come down, they have not as yet shown that they might be poised to go sharply lower. With the Fed hiking rates, the short-rates have been rising sharply and now the yield curve is inverting. Or at least the 2–10 yield curve has inverted in the U.S. and Canada, but the 3-month–10-year yield curve is still positive. Inverted yield curves have shown in the past that a recession usually follows 4–6 months later. That many believe we are already in a recession is beside the point. Officially, it is still not recognized.
With the yield curve inverting, it puts banks in the difficult position of potentially blowing up their normal strategy of borrow short, lend long. No wonder they are so slow to hike interest rates on deposits, but move quickly to raise the cost of loans and mortgages.

See two interesting charts next
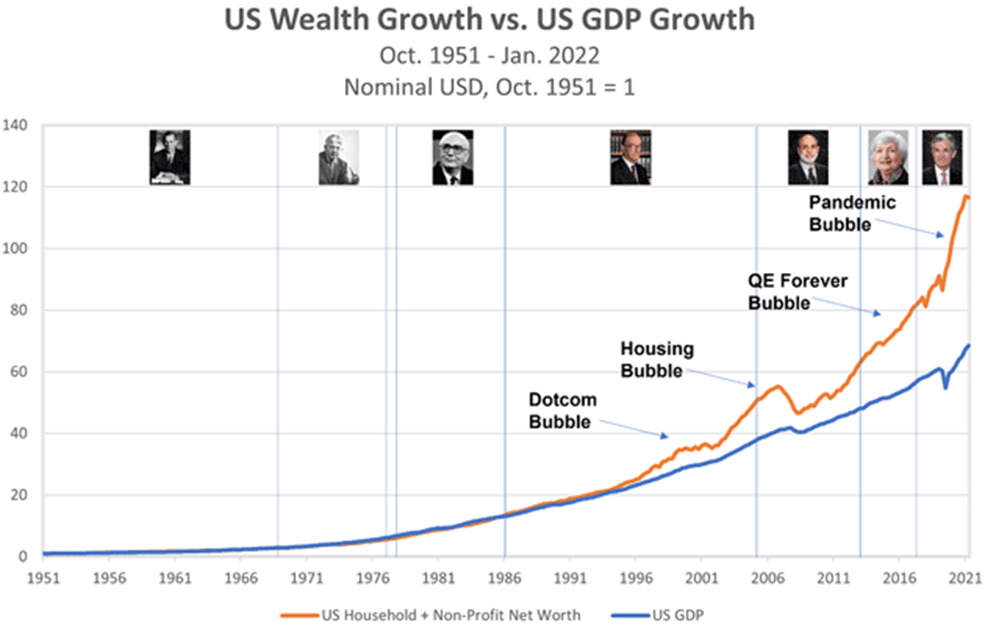
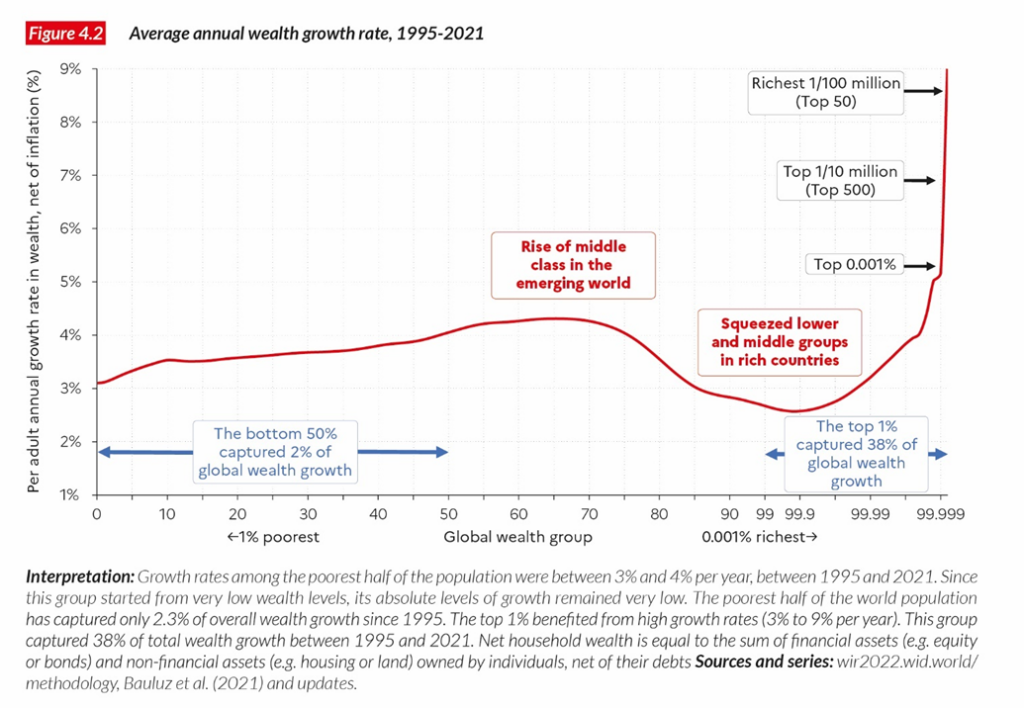
We leave you with charts that touch on one of the other big risks we face: the huge growth in wealth inequality. Rarely has there been a period where wealth inequality has become more blatant. This difference has helped fuel the resentment that drives many extreme right-wing parties as they attack the so-called elites. But the reality is, extreme inequality has in the past triggered revolutions. Think France 1789 or Russia 1917. These were upheavals that not only shook those countries but also the world.
Central banks have played a considerable role in the creation of wealth inequality. Add in the rush to cut taxes that often only benefits the highest earners and you have the potential makings of an upheaval. The economy has now been financialized beyond the growth of GDP. Much of this gain is only on paper. When stock markets fall, there begins the process of wealth destruction. Ultimately, those at the bottom of the rung pay the biggest price as they move from surviving into poverty. And then the seeds of the revolution are planted.
Markets & Trends
| % Gains (Losses) Trends | ||||||||
| Close Dec 31/21 | Close Jul 15/22 | Week | YTD | Daily (Short Term) | Weekly (Intermediate) | Monthly (Long Term) | ||
| Stock Market Indices | ||||||||
| S&P 500 | 4,766.18 | 3,863.16 | (0.9)% | (19.0)% | down (weak) | down | neutral | |
| Dow Jones Industrials | 36,333.30 | 31,288.26 | (0.2)% | (13.9)% | down (weak) | down | neutral | |
| Dow Jones Transports | 16,478.26 | 13,212.21 | (1.4)% | (19.8)% | down | down | neutral | |
| NASDAQ | 15,644.97 | 11,452.42 | (1.6)% | (26.8)% | down (weak) | down | neutral | |
| S&P/TSX Composite | 21,222.84 | 18,394.45 (new lows) | (3.3)% | (13.3)% | down | down | neutral | |
| S&P/TSX Venture (CDNX) | 939.18 | 584.43 (new lows) | (5.0)% | (37.8)% | down | down | down | |
| S&P 600 | 1,401.71 | 1,137.14 | (0.6)% | (18.9)% | down | down | neutral | |
| MSCI World Index | 2,354.17 | 1,816.99 (new lows) | (3.3)% | (22.8)% | down | down | down | |
| NYSE Bitcoin Index | 47,907.71 | 20,954.29 | 4.3% | (56.3)% | down | down | neutral | |
| Gold Mining Stock Indices | ||||||||
| Gold Bugs Index (HUI) | 258.87 | 203.56 (new lows) | (6.1)% | (21.4)% | down | down | down | |
| TSX Gold Index (TGD) | 292.16 | 245.45 (new lows) | (5.6)% | (16.0)% | down | down | down | |
| Fixed Income Yields/Spreads | ||||||||
| U.S. 10-Year Treasury Bond yield | 1.52% | 2.93% | (4.9)% | 92.8% | ||||
| Cdn. 10-Year Bond CGB yield | 1.43% | 3.07% | (7.0)% | 114.7% | ||||
| Recession Watch Spreads | ||||||||
| U.S. 2-year 10-year Treasury spread | 0.79% | (0.20)% | (566.7)% | (125.32)% | ||||
| Cdn 2-year 10-year CGB spread | 0.48% | (0.16)% | (633.3)% | (133.3)% | ||||
| Currencies | ||||||||
| US$ Index | 95.59 | 107.91 (new highs) | 2.9% | 12.9% | up | up | up | |
| Canadian $ | .7905 | 0.7628 (new lows) | (1.2)% | (3.5)% | down | down | neutral | |
| Euro | 113.74 | 100.86 (new lows) | (0.9)% | (11.3)% | down | down | down | |
| Swiss Franc | 109.77 | 102.40 | Unch | (6.7)% | down (weak) | down | down | |
| British Pound | 135.45 | 118.62 (new lows) | (1.4)% | (12.4)% | down | down | down | |
| Japanese Yen | 86.85 | 72.18 (new lows) | (1.8)% | (16.9)% | down | down | down | |
| Precious Metals | ||||||||
| Gold | 1,828.60 | 1,705.80 | (2.1)% | (6.7)% | down | down | neutral | |
| Silver | 23.35 | 18.23 (new lows) | (5.3)% | (21.9)% | down | down | down | |
| Platinum | 966.20 | 817.30 (new lows) | (7.4)% | (15.4)% | down | down | down | |
| Base Metals | ||||||||
| Palladium | 1,912.10 | 1,898.10 | (12.0)% | (0.7)% | down (weak) | down (weak) | down (weak) | |
| Copper | 4.46 | 3.21 (new lows) | (8.8)% | (28.1)% | down | down | neutral | |
| Energy | ||||||||
| WTI Oil | 75.21 | 95.78 | (8.6)% | 27.4% | down | neutral | up | |
| Nat Gas | 3.73 | 6.60 | 9.5% | 76.9% | down | up (weak) | up | |
New highs/lows refer to new 52-week highs/lows and, in some cases, all-time highs.
__
(Featured image by Ibrahim Boran via Unsplash)
DISCLAIMER: This article was written by a third party contributor and does not reflect the opinion of Born2Invest, its management, staff or its associates. Please review our disclaimer for more information.
This article may include forward-looking statements. These forward-looking statements generally are identified by the words “believe,” “project,” “estimate,” “become,” “plan,” “will,” and similar expressions. These forward-looking statements involve known and unknown risks as well as uncertainties, including those discussed in the following cautionary statements and elsewhere in this article and on this site. Although the Company may believe that its expectations are based on reasonable assumptions, the actual results that the Company may achieve may differ materially from any forward-looking statements, which reflect the opinions of the management of the Company only as of the date hereof. Additionally, please make sure to read these important disclosures
David Chapman is not a registered advisory service and is not an exempt market dealer (EMD) nor a licensed financial advisor. He does not and cannot give individualised market advice. David Chapman has worked in the financial industry for over 40 years including large financial corporations, banks, and investment dealers. The information in this newsletter is intended only for informational and educational purposes. It should not be construed as an offer, a solicitation of an offer or sale of any security. Every effort is made to provide accurate and complete information. However, we cannot guarantee that there will be no errors. We make no claims, promises or guarantees about the accuracy, completeness, or adequacy of the contents of this commentary and expressly disclaim liability for errors and omissions in the contents of this commentary. David Chapman will always use his best efforts to ensure the accuracy and timeliness of all information. The reader assumes all risk when trading in securities and David Chapman advises consulting a licensed professional financial advisor or portfolio manager such as Enriched Investing Incorporated before proceeding with any trade or idea presented in this newsletter. David Chapman may own shares in companies mentioned in this newsletter. Before making an investment, prospective investors should review each security’s offering documents which summarize the objectives, fees, expenses and associated risks. David Chapman shares his ideas and opinions for informational and educational purposes only and expects the reader to perform due diligence before considering a position in any security. That includes consulting with your own licensed professional financial advisor such as Enriched Investing Incorporated. Performance is not guaranteed, values change frequently, and past performance may not be repeated.


Morocco’s Budget Execution June 2026: Deficit Narrows to 20.2 MMDH
Morocco’s Finance Law execution at end-June 2026 shows a reduced budget deficit of 20.2 billion dirhams, down from 24.9 billion...

Tilray Brands Hits Multi-Year Lows as Cannabis Investors Await Regulatory Clarity
Tilray Brands shares have fallen 57% this year amid cannabis sector weakness and uncertainty over US regulatory reform. While potential...


Ethereum Between ETF Inflows, Price Risks and a Strong July
Ethereum faces mixed signals as ETF inflows and a strong July performance support recovery, while technical resistance and downside risks...


Mercedes-Benz Accelerates EV Decarbonization With Recycled Aluminum
Mercedes-Benz expands its partnership with Hydro to accelerate supply chain decarbonization. Future electric vehicles will use Hydro CIRCAL aluminum containing...

Evotec and BioGaia Boost Biotech, while Vitrolife Disappoints
European stocks moved on earnings and broker actions. Evotec, BioGaia, Plus500, Pharming, Inwido, Amundi and Julius Baer rallied on upgrades,...
 |
|
 |  |
 |
|
-

 Cannabis6 days ago
Namibia Cannabis Activists Seek Political Path After Legal Setbacks
-
 Crypto2 weeks ago
Bitcoin, and Ethereum Rise, While Cardano Enters Transition
-

 Crowdfunding3 days ago
Urbanitae Drives Spain’s Real Estate Crowdfunding Boom with Record Growth and Investor Returns
-

 Impact Investing1 week ago
Swisscanto Launches Catastrophe Bond Fund for Portfolio Diversification