Markets
Markets Ignore Chaos as Gold Soars and Stocks Hit New Highs
Markets shrugged off global chaos: street violence, geopolitical threats, tariff hikes, and Fed attacks. Stocks hit new highs as transports caught up. Gold and silver surged to records, echoing historic bull markets. Bond yields rose, oil whipsawed on Iran rhetoric, and upcoming GDP and inflation data loom amid nonstop uncertainty for investors worldwide this week.

The financial story of the week has been the unprecedented criminal investigation into the Federal Reserve and the Fed Chairman Jerome Powell. Grand jury subpoenas have been issued that threaten indictment, but no formal charges have been filed. There has been considerable backlash to the probe from bankers, bond dealers, and other central banks, but so far, the stock markets has largely shrugged it off, although gold and silver responded with another run to the upside.
The investigation centres on Powell’s testimony before the Senate Banking Committee in June 2025 about the Federal Reserve’s $2.5 billion renovation of its Washington headquarters — specifically, whether he made false or misleading statements about costs and management of that project. Prosecutors are reviewing his testimony and internal documents.
Powell says he and the Fed fully disclosed information to Congress and that any cost overruns were due to inflation, tariffs, and unforeseen issues. The Federal Reserve is legally independent from the executive branch — meaning, presidents can’t direct its interest rate decisions or fire the chair without “cause,” as defined by law. A criminal probe of the Fed’s head over testimony is extraordinary and unprecedented in modern U.S. history.
All this reminds us of Canada’s Coyne affair way back in 1961 when there was a major dust-up between the Governor of the Bank of Canada James Coyne and Prime Minister John Diefenbaker (https://todayinottawashistory.wordpress.com/2014/11/29/the-coyne-affair/). But there was no criminal investigation.
The story of a criminal investigation had to compete with Iran, Venezuela, and ICE. But the financial world noted that the loss of independence for the Federal Reserve would be, in a word, “catastrophic” for the global banking system and the global economy. The Federal Reserve is the central bank of the U.S., but its preeminence amongst other central banks makes it the global leader.
There are numerous arguments as to why we should not have or don’t need a central bank. A central bank has been at the center of the financial world since Sverige’s Riksbank (or just Riksbank) was founded in 1668 as the central bank of Sweden. The Bank of England was founded in 1694. The Federal Reserve was founded in 1913 after several years of stock market crashes in 1901 and 1907 and steep recessions in 1902–1904, 1907–1908, and 1910–1912.
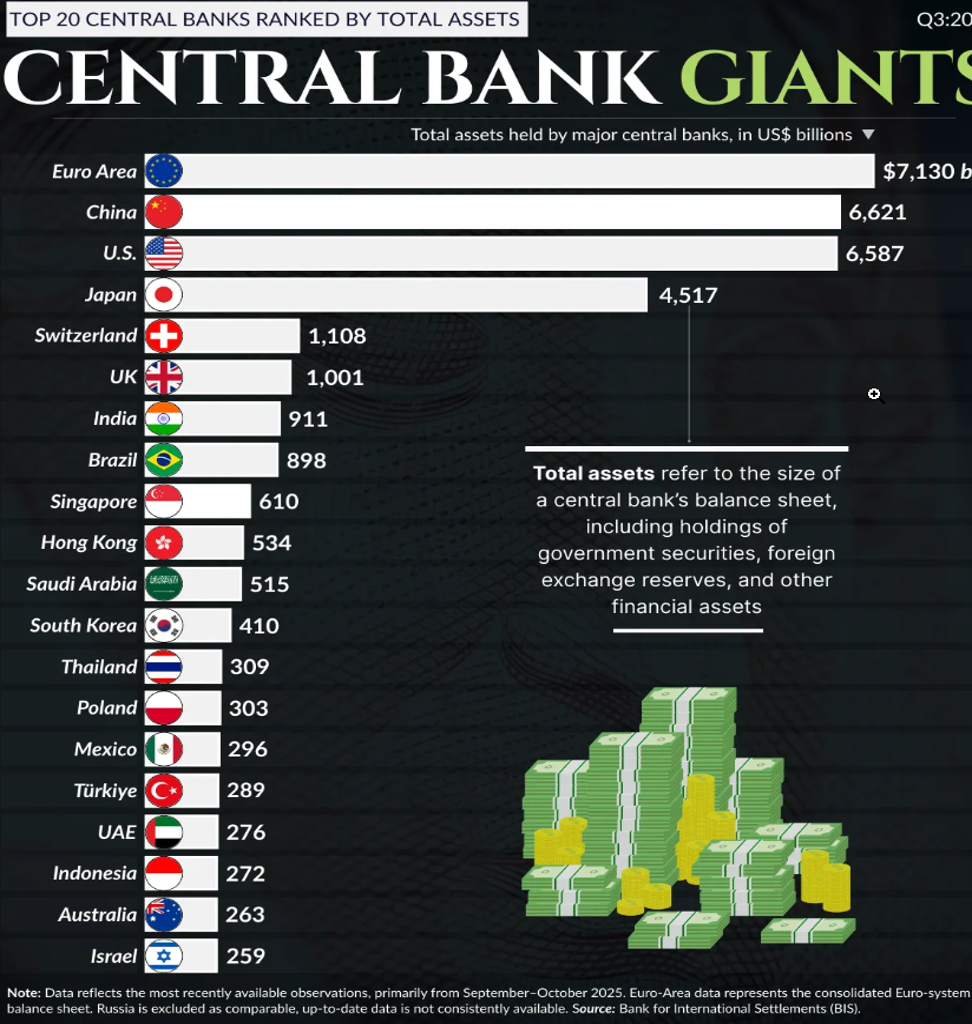
The formation of the central bank was pushed by the large money center banks in response to the crashes and steep recessions. The Federal Reserve (“The Fed”) is the third largest central bank in the world in terms of assets, preceded by the People’s Bank of China (PBOC) and the European Central Bank (ECB).
President Trump has repeatedly berated Jerome Powell because he won’t cut interest rates to levels he wants. There have been repeated attacks to lower interest rates and attacks on Powell’s integrity and leadership. A compliant Fed Chair would make Trump happy. As many have pointed out, there is questionable legal basis for the case. Instead, it’s a pretext for the Fed to do what the president wants. Many have spoken out against this, including former Fed Chairs Alan Greenspan, Ben Bernanke, and Janet Yellen. Bankers have also spoken out against this, notably Jamie Dimon of JPMorgan Chase.
The Fed acts and has always acted on the basis of evidence and economic data. No doubt there have been periods where they have made mistakes (even big ones?), such as keeping interest rates too low in the 1970s. This resulted in Fed Chair Paul Volcker hiking interest rates to unheard-of levels to cool things in 1980, which triggered, during 1980–1982, the steepest recession since the Great Depression.
The period 2008–2022 when interest rates were also kept too low for too long resulted in the sharp rise in the stock markets from 2009 to the present with a few interuptions in 2015–2016, 2018, 2020, and 2022. Low interest rates were in combo with quantititative easing (QE), flooding the financial system with too much money as money supply and debt exploded. That also aided the inflation explosion of 2022, although there were other reasons why that happened, such as the Russia/Ukraine war.
The following chart shows the rankings of the top 20 central banks in the world. The ECB tops the list, followed by PBOC, then the Fed. At any time, the Fed could leap back in the lead if QE programs are elevated. Irrespective of the Fed’s position as to assets, the Fed’s position amongst central banks is unassailable. The Fed is the most preeminent central bank.
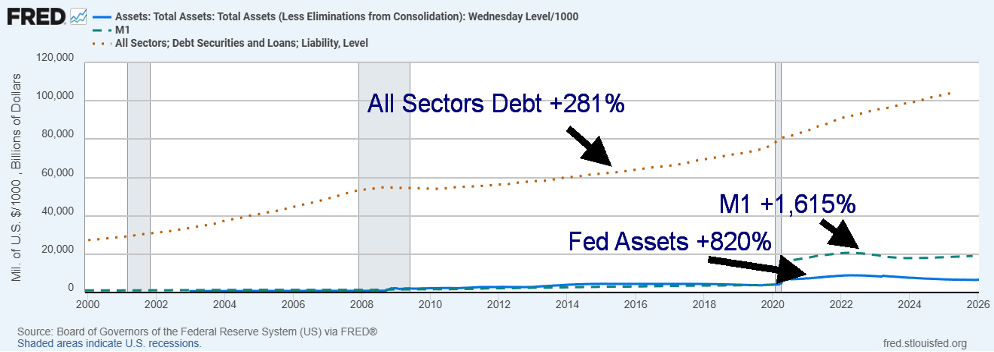
While the Fed’s assets have grown 820% since around 2000, their growth has been dwarfed by the rise in money supply with M1 up 1,615% since 2000. The growth for both the Fed’s assets and M1 have come after the 2008 financial crisis and the pandemic. For all sectors (government, corporate, consumer), debt is up only 281% in the same period. But again, its fastest growth occurred after the 2008 financial crisis and the pandemic. (A chart showing this follows the central bank chart).
Fed Assets vs. Money Supply M1, All Sectors Debt (government, corporate, consumer) 2000–2026
Finally, the inflation rate came out this past week at 2.7%, which was largely as expected. It remains above the Fed target of 2%. The core inflation rate (ex-food and energy) came out at 2.6%, again largely as expected. Interest rates remain above the rate of inflation. As noted, we show the Fed rate plus the bank prime lending rate and the 30-year mortgage rate. This is what we call a normal curve or positive curve with interest rates above the rate of inflation, giving a real return rather than a negative return as was the case for years.
This Fed/Jerome Powell episode is viewed — by critics on both sides of the political spectrum — as a test of institutional norms in the United States, raising these questions:
• How strong is the independence of the Federal Reserve?
• Can monetary policy decisions be insulated from political pressures?
• What constitutes legitimate oversight versus political coercion?
Even if Powell is not ultimately charged, the situation has already triggered debate about the role of politics in U.S. economic governance — with potential implications for markets, inflation expectations, and confidence in U.S. institutions. A new Fed governor is coming. His confirmation could be difficult to achieve if there is a perception that the new governor is just there to follow Trump’s orders. Even if confirmed, a strong possibility considering the Senate remains controlled by the Republicans, markets may perceive the appointment negatively. That in turn could have ramifications for the stock market, the bond market, and gold and silver, the latter which may respond positively.
Why this matters: central bank independence is the bedrock of global financial stability. If monetary policy becomes a political tool, the rules of the game change for everyone – from Wall Street to Main Street. In an interesting twist, Jerome Powell’s term ends in May 2026. But Powell can remain as a Fed governor for another two years. Powell could then continue to help shape Fed policy and be a challenge to any incoming Fed chair.
Who the incoming chair might be remains a mystery. The top candidate, Kevin Hassett Trump’s director of the National Economic Council has now been eliminated as a candidate by Trump. Another possibility is Kevin Warsh who did serve as a Fed governor 2006-2011. Both would be considered interest rate doves which fit with Trump’s desires.
Powell’s message is clear: is the Fed driven by data or intimidation?
Inflation Rate (CPI) vs. Fed Rate, Bank Prime Rate, 30-year Mortgage Rate 2016–2026
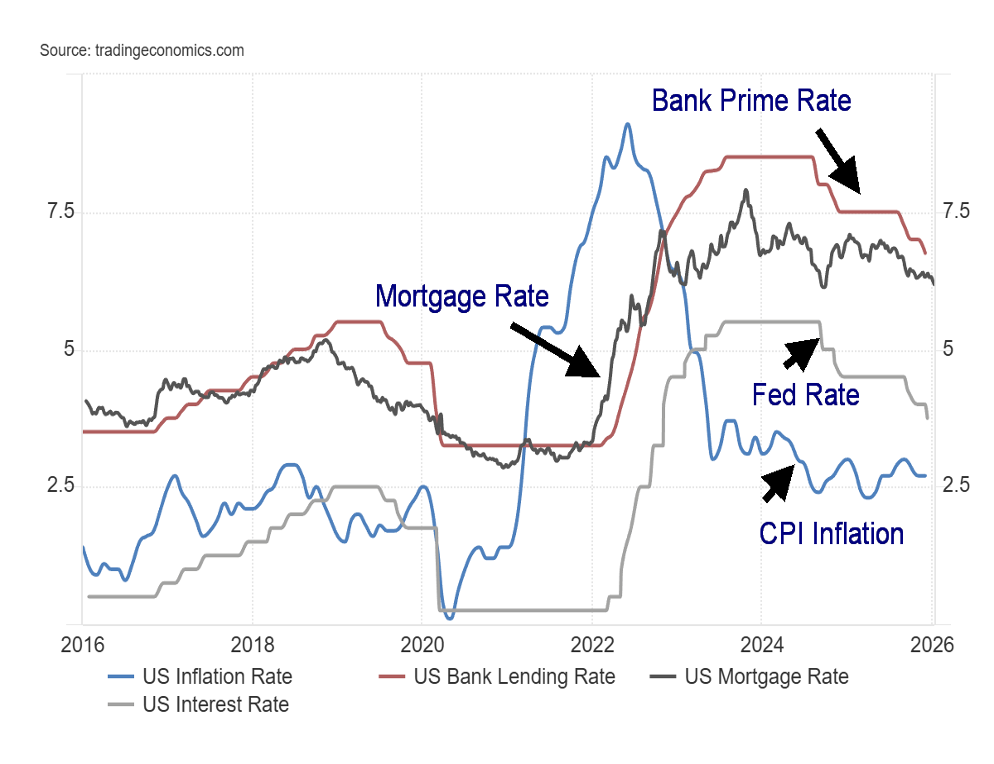
Chart of the Week
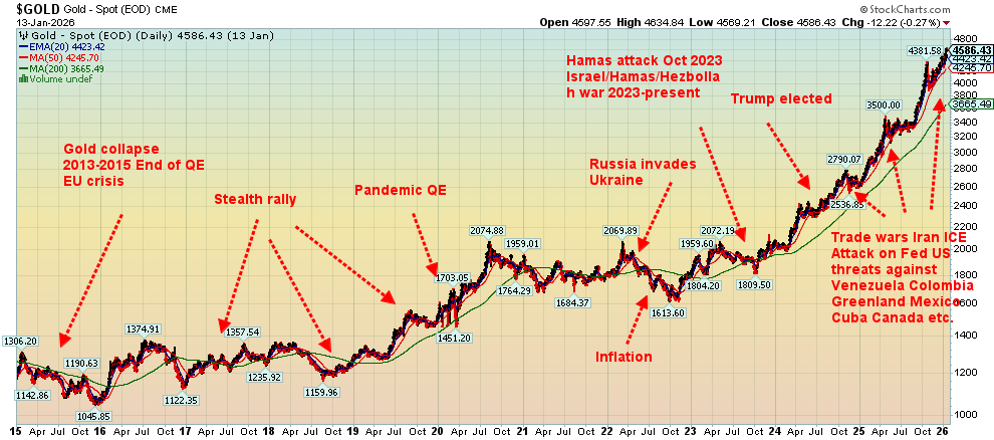
Gold has been on a remarkable run, particularly since a low in September 2022. But the run really started after the low of December 2015. Those first few years from 2015–2019 were what we call a stealth rally. Events driving gold during that period were the rise in U.S. debt, particularly from 2017 on and early Trump trade wars and instability. Then came the pandemic of 2020 and the unleashing of QE that paled the QE after the 2008 financial crisis.
The election of Trump in November 2024 started another gold rally because of threats by Trump to unleash a trade war. That became a reality in April 2025. Since then, we have seen a series of events that continue to drive gold higher.
Those events amongst others include: the failure of any peace agreement between Russia and Ukraine; the escalation and ongoing war between Israel/Hamas/Hezbollah with no end in sight; the unrest in Iran against the Islamic government; the illegal seizure of Maduro in Venezuela and claim that the U.S. now controls Venezuela; ongoing threats against Colombia, Cuba, Mexico, Greenland, and even Canada; and the deterioration on the streets of America as ICE was unleashed to round up illegals and deport them. We might add the unprecedented attack on Fed Chairman Jerome Powell with a criminal indictment.
Gold has gone up by 338% since that low in December 2015 or over $3,500. It seems remarkable. Based on the rise in dollars it has been remarkable. Percentagewise? Not as good. Not only has gold gone up, making ongoing record highs in U.S. dollars, but the same has happened in Cdn$, Japanese yen, euros, Swiss francs, pound sterling, and every other currency in the world. Currency debasement, rising fears, geopolitical and domestic political tensions, trade wars, debt, and more have all no doubt played a role.
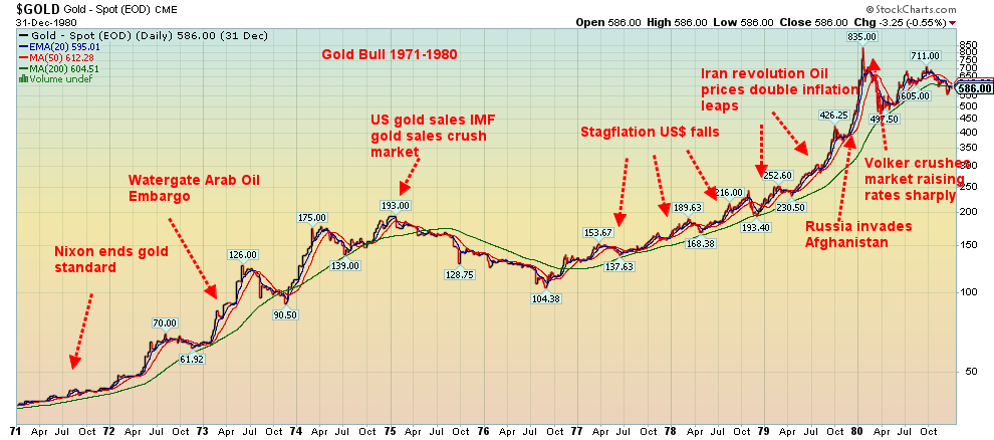
In terms of percentage rise, remarkable has it has been, the bull market from 1971–1980 far surpasses the current bull. Dollar-wise, it was only about $800. But percentagewise it was a mind-boggling 2,300%. Okay, we started from a much lower base. But if the same thing happened today, gold could rise to over $23,000.
Yes, there was also the 2001–2011 bull market that saw gold rise 668% or about $1,670. Even a move like that today would take gold to over $6,900. But what today’s gold bull feels like is more the 1971–1980 bull than the 2001–2011 bull. Here, geopolitical events and even some domestic political events helped drive the market. A sinking U.S. dollar and the end of the gold standard in 1971 were significant events, along with rising inflation and then stagflation. Geopolitical events included the Arab oil embargo (1973), the Iranian revolution (1979), and the Russian invasion of Afghanistan. All helped push up oil prices, contributing significantly to inflation.
Domestically, there was the Watergate scandal resulting in the resignation of President Richard Nixon in August 1974. That and the Arab oil embargo helped bring about the stock market bear of 1973–1974. There is so much more, but the emphasis here is how geopolitics, domestic politics, rising debt, and debased currencies helped trigger the rise in gold – the ultimate safe haven. Are we ending in a mania as we did in 1979? It’s hard to say, but geopolitical events and inflation drove that rise. Today, we have so much more helping to drive the price of gold higher, and to date we see little evidence of the end of it. No expectation of a Volcker interest rate hike, or the end of QE, which appears to be underway once again.
Markets and Trends
| % Gains (Losses) Trends | ||||||||
| Close Dec 31/25 | Close Jan 16/26 | Week | YTD | Daily (Short Term) | Weekly (Intermediate) | Monthly (Long Term) | ||
| S&P 500 | 6,845.50 | 6,940.01 (new highs) * | (0.4)% | 1.4% | up | up | up | |
| Dow Jones Industrials | 48,063.29 | 49,359.33 (new highs) * | (0.3)% | 2.7% | up | up | up | |
| Dow Jones Transport | 17,357.19 | 18,245.42 (new highs) * | 0.3% | 5.1% | up | up | up | |
| NASDAQ | 23,241.99 | 23,515.39 | (0.7)% | 1.2% | up | up | up | |
| S&P/TSX Composite | 31,712.76 | 33,040.55 (new highs) * | 1.3% | 4.2% | up | up | up | |
| S&P/TSX Venture (CDNX) | 987.74 | 1,091.13 (new highs) | 3.7% | 10.5% | up | up | up | |
| S&P 600 (small) | 1,467.76 | 1,569.62 (new highs) * | 1.7% | 6.9% | up | up | up | |
| ACWX MSCI World x US | 67.18 | 69.89 (new highs) * | 0.9% | 4.0% | up | up | up | |
| Bitcoin | 87,576.98 | 95,384.14 | 5.6% | 8.9% | up | down | up | |
| Gold Mining Stock Indices | ||||||||
| Gold Bugs Index (HUI) | 701.49 | 802.13 (new highs) * | 5.1% | 14.4% | up | up | up | |
| TSX Gold Index (TGD) | 817.76 | 940.55 (new highs) * | 4.8% | 15.0% | up | up | up | |
| % | ||||||||
| U.S. 10-Year Treasury Bond yield | 4.17% | 4.23% | 1.4% | 1.4% | ||||
| Cdn. 10-Year Bond CGB yield | 3.44% | 3.38% | (0.3)% | (1.7)% | ||||
| Recession Watch Spreads | ||||||||
| U.S. 2-year 10-year Treasury spread | 0.69% | 0.62% | (1.6)% | (10.1)% | ||||
| Cdn 2-year 10-year CGB spread | 0.85% | 0.82% | (2.4)% | (3.5)% | ||||
| Currencies | ||||||||
| US$ Index | 98.26 | 99.36 | 0.2% | 1.1% | up | up (weak) | down | |
| Canadian $ | 72.87 | 0.7185 | flat | (1.4)% | down (weak) | down (weak) | down (weak) | |
| Euro | 117.48 | 116.03 | (0.3)% | (1.2)% | down | neutral | up | |
| Swiss Franc | 126.21 | 124.53 | (0.3)% | (1.3)% | down (weak) | up (weak) | up | |
| British Pound | 134.78 | 133.82 | (0.2)% | (0.7)% | down (weak) | neutral | up | |
| Japanese Yen | 63.83 | 63.25 (new lows) | (0.1)% | (0.9)% | down | down | down | |
| Precious Metals | ||||||||
| Gold | 4,311.97 | 4,591.40 (new highs) * | 1.8% | 6.5% | up | up | up | |
| Silver | 71.16 | 89.62 (new highs) * | 13.0% | 25.9% | up | up | up | |
| Platinum | 124.81 | 2,233.33 | 2.4% | 14.0% | up | up | up | |
| Base Metals | ||||||||
| Palladium | 1,619.50 | 1,842.00 | (1.7)% | 13.7% | up | up | up | |
| Copper | 5.64 | 5.85 (new highs) * | 0.2% | 3.7% | up | up | up | |
| Energy | ||||||||
| WTI Oil | 57.44 | 58.45 | 1.1% | 3.5% | up (weak) | down | down | |
| Nat Gas | 3.71 | 3.11 | (1.6)% | (16.2)% | down | down | neutral | |
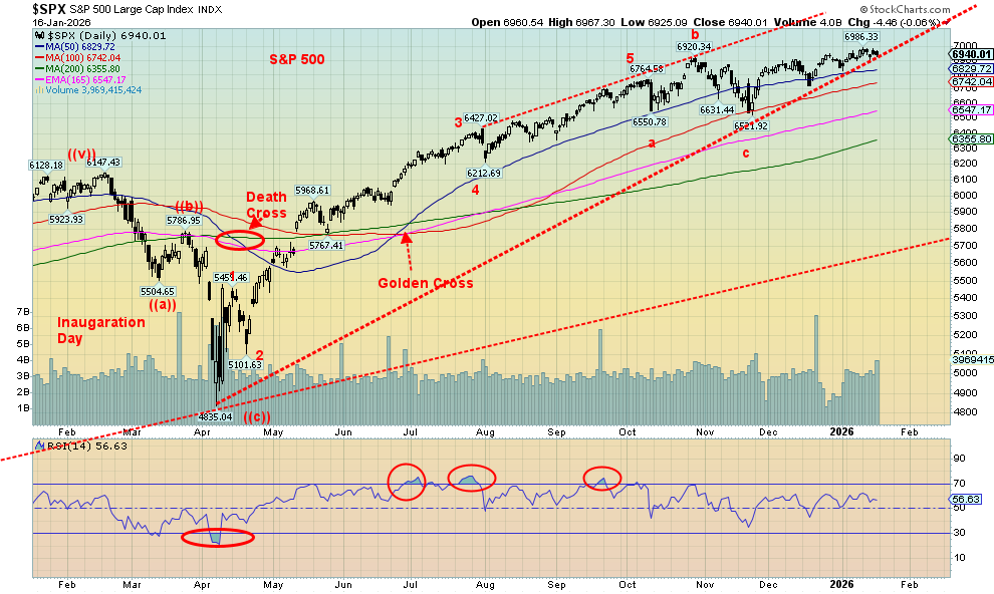
Neither the threat to bomb Iran, chaos on the streets of Minneapolis and elsewhere, or criminal investigations of the Fed have managed to shake the stock markets. Well, not much anyway. Yes, the S&P 500 (SPX) fell 0.4% on the week but not before another all-time high. The Dow Jones Industrials (DJI) also made all-time highs but fell 0.3%. Congratulations, however, goes out to the Dow Jones Transportations (DJT), which finally made all-time highs over the 2021 high, thus confirming the all-time high in the DJI. The indices now agree with each other, a potentially bullish sign for the markets. The DJT was up 0.3% on the week and leads up 5.1% on the year. The NASDAQ continues to struggle, down 0.7%.
The small and mid-cap joined the party with the S&P 400 (Mid) up 1.3% and the S&P 600 (Small) up 1.7%, both to all-time highs. The NY FANG Index actually fell 1.9%, suggesting the leaders are faltering but others appear to be taking their place. The S&P 500 Equal Weight Index made all-time highs, up 0.7%. Bitcoin gained 5.6% but remains well below its all-time high. With all the indices making all-time highs, signs are positive that this bull market should continue, despite all the noise in the background. Just don’t get complacent. Indicators are showing greed.
In Canada, the TSX Composite continues its all-time run, up 1.3%, and the TSX Venture Exchange (CDNX) made 52-week highs, up 3.7%. The EU also saw more all-time highs with the London FTSE up 1.0%, the Paris CAC 40 falling 1.2% despite all-time highs, the German DAX up 0.1%, and the EuroNext up 0.5%. There were also all-time highs in Asia as the Tokyo Nikkei Dow (TKN) was up 3.8% but China’s Shanghai Index (SSEC) fell 0.4%, despite making fresh 52-week highs. Hong Kong’s Hang Seng (HSI) rose 2.3% but did not make new highs. India’s Nifty Fifty was flat.
It’s noteworthy that the S&P 500 continues to hug to that uptrend line. So, a break is close. Under 6,800 is sign of a pullback. Under 6,500 a top is confirmed. Under 6,200 a more serious breakdown could be underway. A breakout over 6,700 signals the bull remains in force and damned be the noise elsewhere.
Selected Performance since Inauguration Day, January 20, 2025
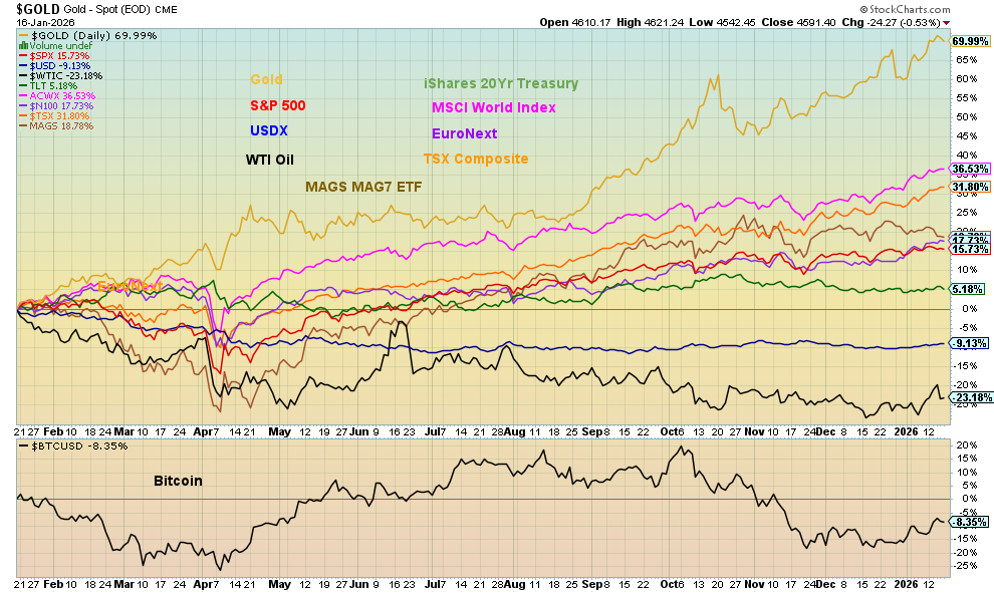
Another week and nothing has changed. Gold remains firmly in the lead, up 70% since the election of Trump in November 2024. The MSCI World Index (ex USA) ETF is a distant second, up 36.5%. The cellar is still owned by WTI oil, down 23.2%. The only other two down are Bitcoin, off 8.4%, and the US$ Index, down 9.1%. Notably, the TSX Composite is in third place, up 31.8%, thanks to its domination in the materials sector.
Fear & Greed Index
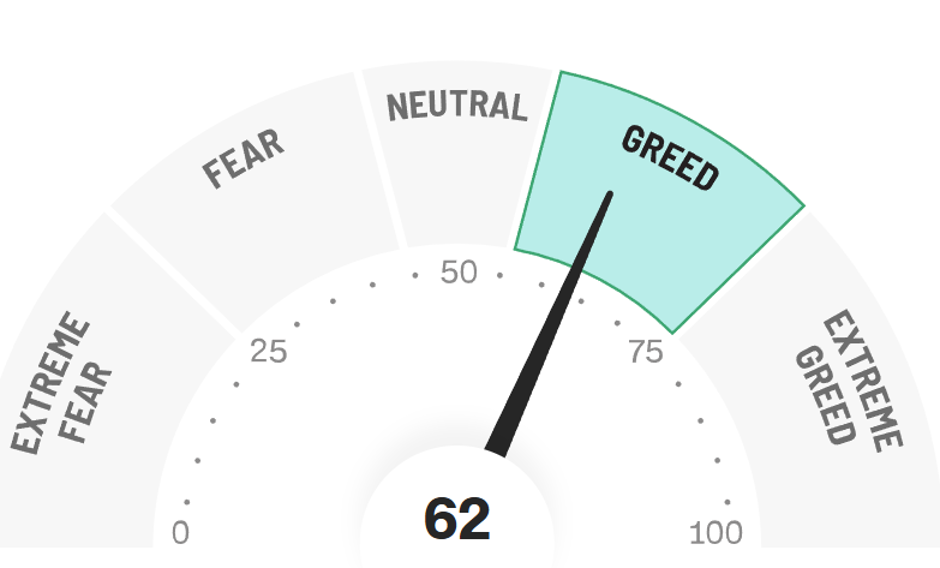
It’s interesting that the Fear & Greed Index has moved to greed from neutral a week ago. That’s a bit of a surprise, considering the S&P 500 closed mildly down on the week. Of its components, safe-haven demand (i.e., gold), junk bond demand, and stock market strength (new highs vs. new lows) are registering extreme greed. The VIX Volatility indicator is neutral as is the stock market breadth indicator, while the put/call ratio is showing extreme fear. No wonder the index is registering greed.
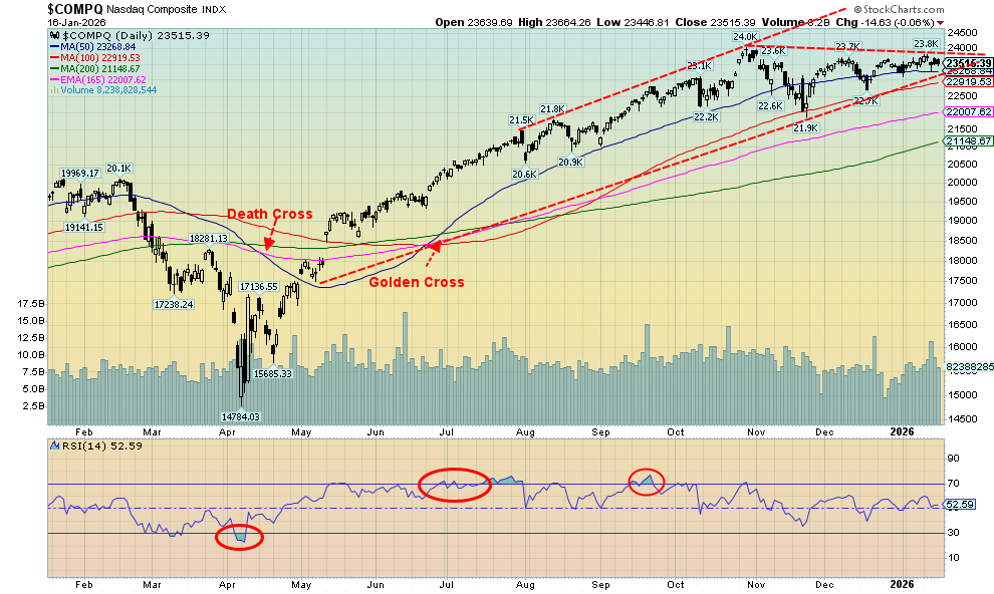
The NASDAQ is the fly in the ointment so far, refusing to join the S&P 500 and the DJI in making all-time highs. For weeks now it has been struggling in a range, failing to break successfully over 24,000. However, the action over the past few weeks appears to be an ascending triangle, which is bullish. A move over 24,000 to new all-time highs remains very possible. Targets could be up to 26,000. A breakdown under 22,900 would signal a potential top is in instead. However, the pattern is an ascending triangle (bullish) and not an ascending wedge triangle (bearish).
Result, we expect higher prices to come. The RSI is at 52.6 so it has lots of room to move higher. Of our favourite MAG7, we note that five of the seven fell this past week, led by Meta, down 5.1%, and Microsoft, down 4.1%. The only winners were Google, up 0.4% to new all-time highs, and Nvidia, up 0.7%. Significantly, for the remaining FAANG stocks we note Advanced Micro (AMD) was up 14.1% but ServiceNow (NOW) was down 10.2% to new 52-week lows. The Chinese stock Alibaba (BABA) rose 9.6%.
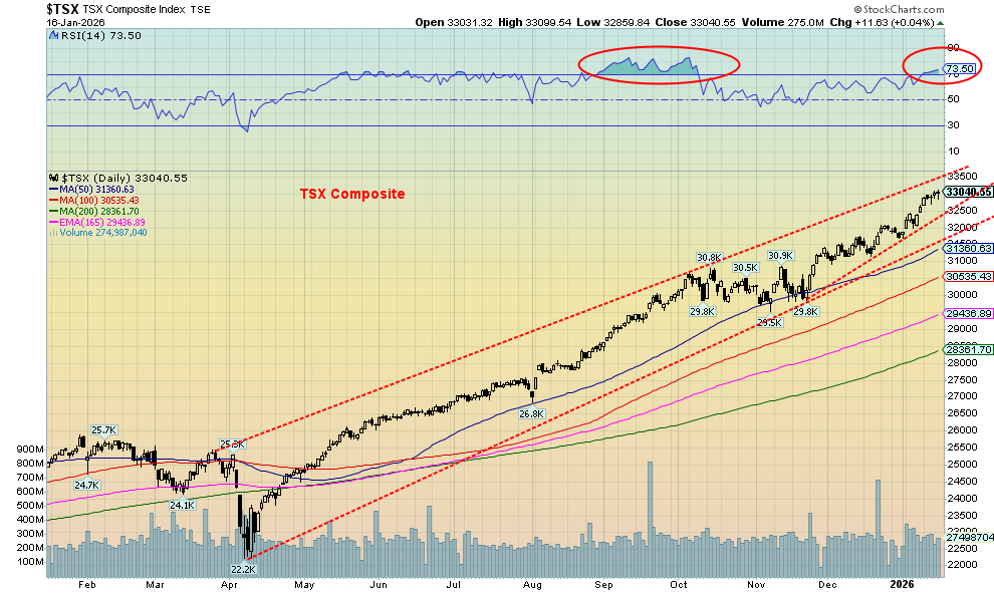
The records keep falling as, once again, the TSX Composite rose to record highs, up 1.3% on the week and now up 4.2% in 2026. Not to be left behind, the TSX Venture Exchange (CDNX) rose 3.7% and is now up 10.5% in 2026. At 1,091, however, the CDNX remains well off its all-time high of 3,372 seen in 2007. The CDNX has lots of room to move higher. It is, of course, dominated by junior mining development stocks (gold, silver, metals). Of the 14 sub-indices, nine rose while five fell this past week. The big winners all making new all-time highs were Golds (TGD) +4.9%, Metals & Mining (TGM) +5.2%, and Materials (TMT) +4.3%.
Income Trusts (TCM) also made all-time highs +3.1%, as did Consumer Discretionary (TCD) but TCD closed down 1.1%. Leading the losers was Information Technology (TTK), down 5.1%. Financials (TFS), which has been a big winner, slipped 0.2%. The TSX Composite appears to have room to rise to 33,500 but, as a warning, the RSI is at 73.50, in overbought territory. That’s a warning, not a sign, that we are about to collapse. We’d have to break under 31,500 to suggest to us that a top is in. The previously mentioned Golds, Metals, and Materials have also been the big winners in 2026 as they were in 2025.
S&P 500 Dividend Yield 1870–2026
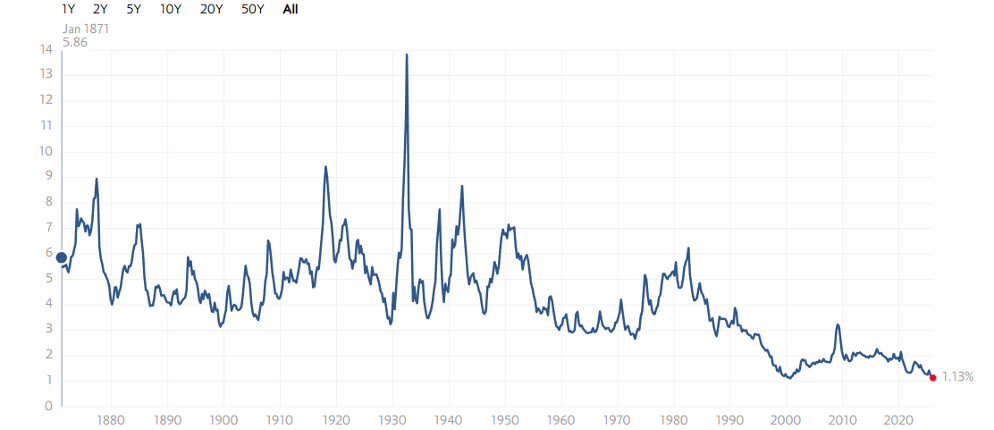
The S&P 500 dividend yield has hit near record lows, dating back to 1870. The low was at 1.11% back in 2000. The mean has been 4.22% and the median 4.19%. The earnings yield (not shown) is 3.19% vs. the all-time low in 2009 at 0.81%. Yet the stock markets keep churning higher. Good yields? Piffle.
U.S. 10-year Treasury Note, Canada 10-year Bond CGB
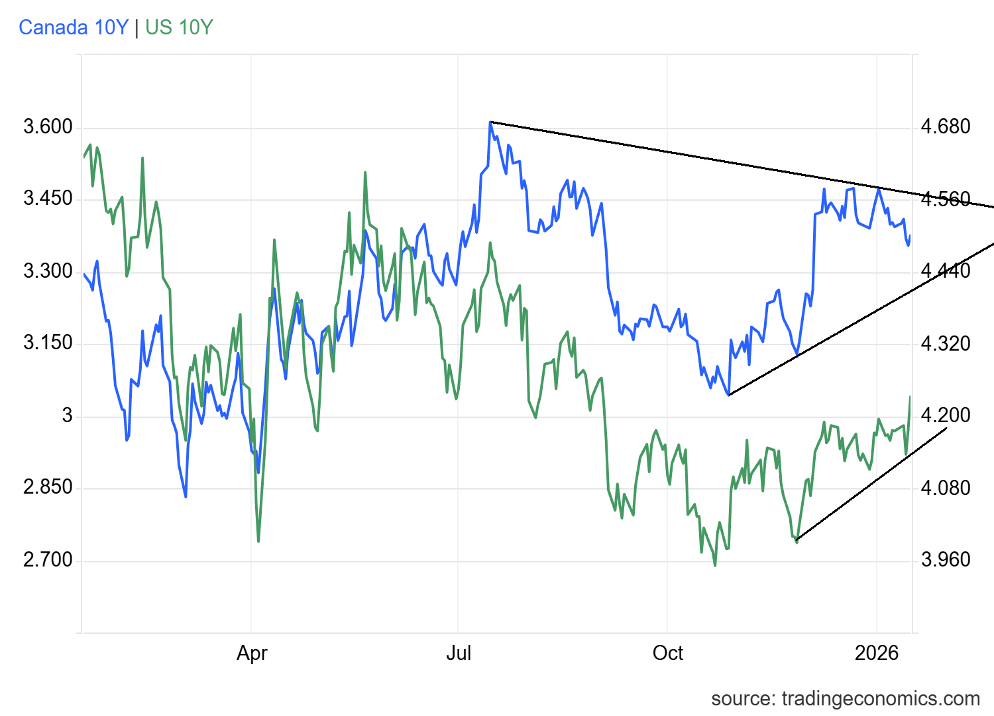
U.S. bond yields on the 10-year U.S. Treasury note rose to 4.23% from 4.17% this past week. There was a lot going on contributing to this rise: the opening of the investigation against the Fed and Jerome Powell; continued signs of life in the economy as November retail sales rose 3.3% year over year (y-o-y); the NY Empire Index (manufacturing) coming in at 7.7 vs. -3.7 in October and expectations of 1; the Philly Fed Manufacturing Index coming in at 12.6 vs. -8.8 in October and expectations of -4; weekly jobless claims actually falling to 198,000 when they expected 212,000; industrial production rising 0.4% month over month (m-o-m) above the expected 0.3%; and inflation remaining elevated with the CPI up 2.7% vs. 2.6% expected and PPI up 2.9% vs expected 2.6%.
Housing sales were reported, but they are only catching up on September and October. They were higher than expected. As a result of all this, interest rates rose, which is not what Trump wants. But then Trump cannot control the bond market, even if he’s successful appointing someone to do his bidding at the Fed. Canada bond yields were steady at 3.38% vs. 3.39% for the 10-year Canadian Government Bond (CGB).
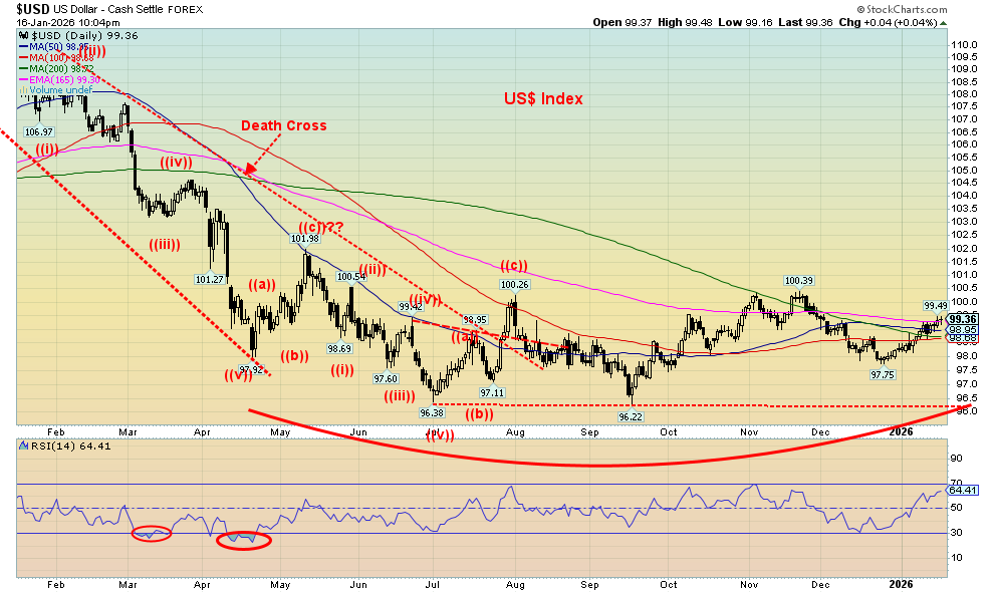
Has the US$ Index stalled, or is it poised to drop once again? This past week saw the US$ Index stall out at the 165-day EMA and just above the 200-day MA. On the week, the US$ Index rose 0.2%, the euro was off 0.3%, the Swiss franc down 0.3%, the pound sterling off 0.2%, while the Japanese yen dropped 0.1% to 52-week lows. The Cdn$ was a slight outlier, flat on the week. So, with the action this past week, the US$ Index has stalled and still needs to break out over the recent high of 100.39 to suggest higher prices.
Failure here would refocus us on the recent low at 97.75. Under 97.20 new lows below 96.22 come into focus. How the US$ Index goes also impacts gold. However, of late gold has been largely ignoring the rise in the US$ Index, sometimes in tandem with the US$ Index. The US$ Index continues its woes as it fell over 9% in 2025 and is not looking particularly good for this year.
Geopolitical and domestic political concerns continue to help gold prices. The investigation against Fed Chair Jerome Powell sparked a jump in the price of gold and silver, but an announcement that Trump was taking Kevin Hassett off the list to replace Powell sparked the drop into Friday. Hassett was viewed as being very bullish for gold prices, given his propensity to agree with Trump and his request for lower interest rates. Now it’s all thrown back and, while there are others, the choice of who will replace Powell remains a mystery.
Confirming any replacement by the Senate won’t be easy either as there remain concerns amongst some of appointing anyone who might be perceived as just following Trump’s orders. The independence of the Fed is paramount, as we pointed out. Even some Republican senators believe that. Nonetheless, other noted replacements such as former Fed Governor Kevin Warsh are also interest rate doves on monetary policy.
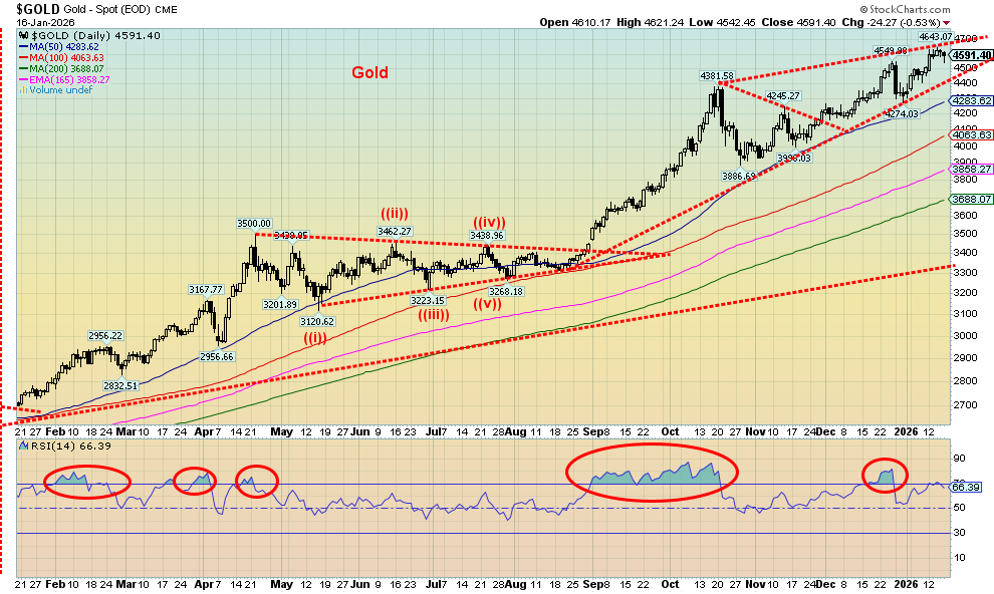
Gold rose 1.8%, silver rose 13.0%, platinum jumped a lackluster 2.4%, but palladium fell 1.7% while copper was up a small 0.2%. Gold, silver, and copper all made new all-time highs this past week. Gold stocks also hit new all-time highs as the Gold Bugs Index (HUI) rose 5.1% and the TSX Gold Index (TGD) was up 4.9%.
Gold, silver, and the gold stocks have been the place to be over the past year. Yet oddly, gold (and silver) remains under-owned compared to the rest of the stock market. In other words, there is potential for new sources of demand as more are attracted to the rise in the metals or profits come out of the broader stock market and are placed into the precious metals market. Gold, which has no liability, remains a key choice evenas it approaches $5,000 with many predicting gold will hit $6,000 in 2026. After years of frustration, the gold bugs are having their day in the sun.
Gold’s bull remains in place unless we fall back under $4,275. While not a killer zone, it suggests a somewhat deeper correction. Under $3,900 is a problem and under $3,700 a panic sell-off could take place. A breakout above $4,700 signals that we are on our way to $5,000.
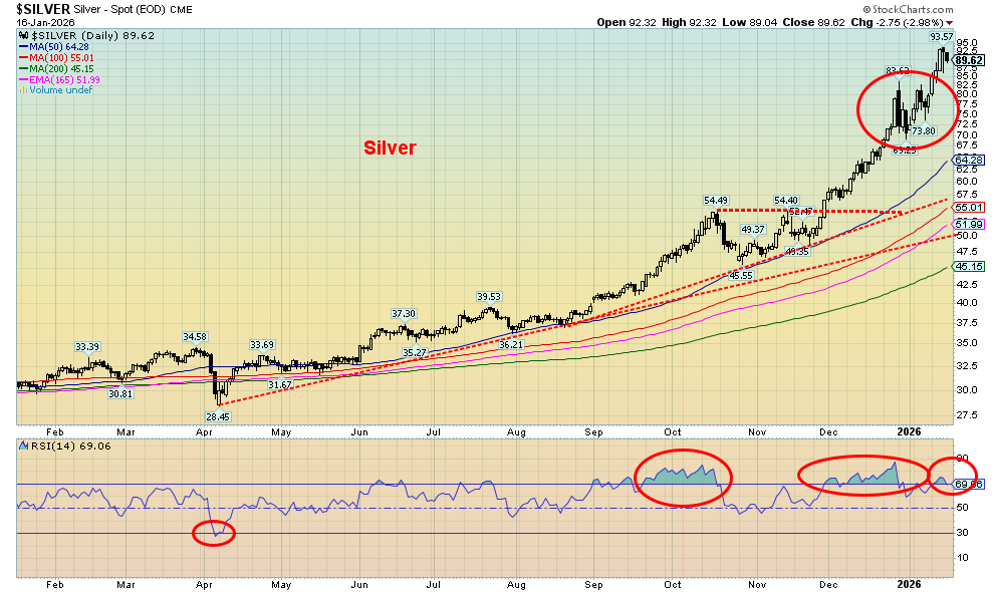
Hi-ho silver, away! Just when you thought that silver was about to have a steep correction, given that outside day key reversal on December 29, 2025, the signal slammed back in our face. Silver turned and raced once again to new all-time highs, this time up to $93.57, even as we closed mildly lower at $89.62. It looks like $100 silver is now in the headlights. Admittedly, we do get concerned by excited calls for silver to rise to $200, $300, $400, and even $600. Silver fever?
We’ve heard of gold fever, but silver fever? Silver is already up 25.9% in 2026 vs. gold up 6.5%. Stories of shortages abound along with soaring demand, even as paper silver outnumbers physical silver by almost 350:1. Nonetheless, the sharply rising silver price has also helped big jumps in silver stocks. The Global X Silver Miners ETF (SIL/NYSE) is up 383% since the 2022 low and just below 18% so far in 2026.
Silver is overbought with an RSI at 70, but we note as well that the RSI is diverging as the recent high saw the RSI at a lower level than it was before. Other indicators are also diverging with previous highs; i.e., silver is pricing higher, but a lower high is being made by the indicators. We pulled back from the high at the end of the week, similar to gold, after the Hassett announcement. We’d get a negative signal under $82.50, but a super sell signal wouldn’t occur until we break that recent low at $69.25.
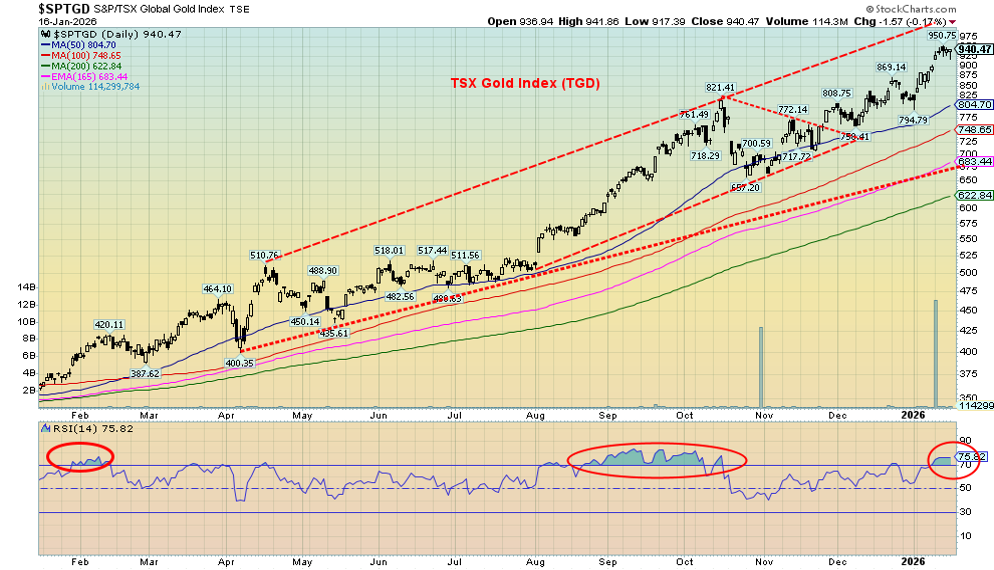
The gold stocks continue to go up, continuing where they left off in 2025. Already this year the Gold Bugs Index (HUI) is up 14.4% while the TSX Gold Index (TGD) is up 15.0%. Nice start to 2026. On the week, we jumped, then wobbled as the TGD rose 4.8% and the HUI rose 5.1%. Both indices made new all-time highs as did several individual gold stocks. Life continues to percolate with the junior gold/silver mining explorers. It is with them the real big gains can be made; however, they come with elevated risk.
The current bull channel suggests the TGD could rise as high as 990/1000. Yes, we are overbought as the RSI is at 75.82, but we noted we remained highly overbought for several weeks from August to October before a correction of any substance set in. This is not to be fearful that a sharp correction could occur at any moment but to understand that in a powerful bull market, which we are in, “overbought” is just a figure of speech. The 2008–2011 bull saw the TGD rise 200% while the HUI leaped 325%. Thus far, from an important low in 2022, the HUI is up 364% while the TGD has gained 331%.
By comparison, today’s run has been remarkable compared to the 2008–2011 a run that saw a number of 10%+ pullbacks. Nonetheless, we shouldn’t get complacent as a sharp correction can come out of the blue. However, this run has been remarkable. The week ended with a wobble so we can’t rule out a pullback this coming week. But the background conditions continue to be good for gold, silver, and by extension the gold stocks.
Source: www.stockcharts.com
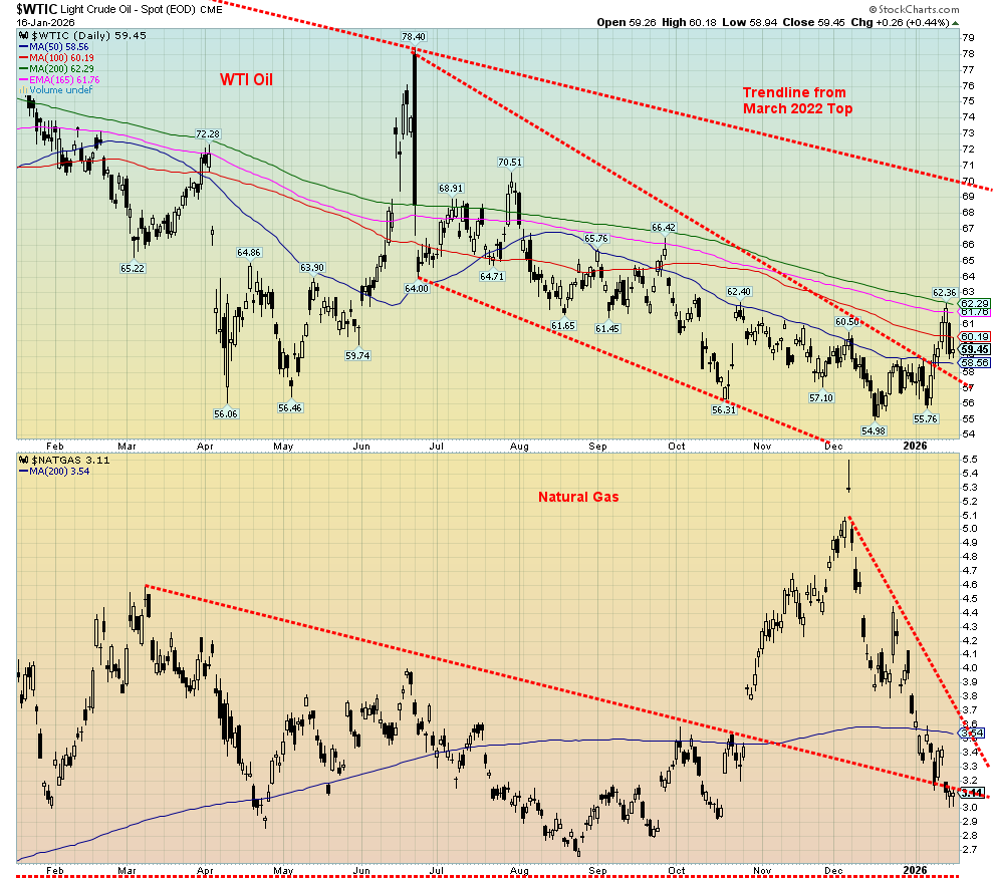
To bomb or not to bomb Iran, that is the question. To bomb Iran – oil prices rise; to not bomb Iran – oil prices fall. That aptly describes the week we just went through as Trump’s threats to bomb Iran hiked WTI oil to $62.36; then he changed his mind and WTI oil fell back to $59.45. The yo-yo president. It’s a Trump-driven guessing game.
On the week, WTI oil did manage to gain 1.1% and Brent crude rose 1.8%. But it could have been higher if not for Trump saying one thing one moment, then another the next. Natural gas (NG) also went through a yo-yo week, but it wasn’t because of anything Trump said. NG at the Henry Hub fell 1.6% when storage levels fell considerably less than expected and demand fell at LNG export plants. But over in the EU, Dutch Hub NG rose an incredible 31.7% as colder weather hit Europe, lifting demand and thus tightening supplies. It depends where you live.
WTI oil broke above a downtrend line but was stopped in its tracks at the 200-day MA. It then fell promptly back to the 50-day MA. That shows once again the importance of the moving averages. Successfully clearing above $63 would help confirm the recent lows. At the other end, we want to remain above $57. A breakdown under $56.70 suggests new lows ahead. We expect the geopolitical tensions should keep WTI oil above that level, putting our focus on the potential for the upside. The energy stocks continue to be accumulated as the ARCA Oil & Gas Index (XOI) rose 1.5% while the TSX Energy Index (TEN) fared better, up 5.8%. Both made 52-week highs.
The geopolitical noise might well remain back and forth, but the technicals continue to point to higher prices ahead.
__
(Featured image by Erol Ahmed via Unsplash)
DISCLAIMER: This article was written by a third party contributor and does not reflect the opinion of Born2Invest, its management, staff or its associates. Please review our disclaimer for more information.
This article may include forward-looking statements. These forward-looking statements generally are identified by the words “believe,” “project,” “estimate,” “become,” “plan,” “will,” and similar expressions, including with regards to potential earnings in the Empire Flippers affiliate program. These forward-looking statements involve known and unknown risks as well as uncertainties, including those discussed in the following cautionary statements and elsewhere in this article and on this site. Although the Company may believe that its expectations are based on reasonable assumptions, the actual results that the Company may achieve may differ materially from any forward-looking statements, which reflect the opinions of the management of the Company only as of the date hereof. Additionally, please make sure to read these important disclosures.
Copyright David Chapman 2026
David Chapman is not a registered advisory service and is not an exempt market dealer (EMD) nor a licensed financial advisor. He does not and cannot give individualised market advice. David Chapman has worked in the financial industry for over 40 years including large financial corporations, banks, and investment dealers. The information in this newsletter is intended only for informational and educational purposes. It should not be construed as an offer, a solicitation of an offer or sale of any security. Every effort is made to provide accurate and complete information.
However, we cannot guarantee that there will be no errors. We make no claims, promises or guarantees about the accuracy, completeness, or adequacy of the contents of this commentary and expressly disclaim liability for errors and omissions in the contents of this commentary. David Chapman will always use his best efforts to ensure the accuracy and timeliness of all information. The reader assumes all risk when trading in securities and David Chapman advises consulting a licensed professional financial advisor or portfolio manager such as Enriched Investing Incorporated before proceeding with any trade or idea presented in this newsletter.
David Chapman may own shares in companies mentioned in this newsletter. Before making an investment, prospective investors should review each security’s offering documents which summarize the objectives, fees, expenses and associated risks. David Chapman shares his ideas and opinions for informational and educational purposes only and expects the reader to perform due diligence before considering a position in any security. That includes consulting with your own licensed professional financial advisor such as Enriched Investing Incorporated. Performance is not guaranteed, values change frequently, and past performance may not be repeated.


Bank Al-Maghrib Launches Reforms to Boost Credit via Non-Performing Loan Market
Bank Al-Maghrib is advancing a secondary market for non-performing loans to free bank financing and boost credit. With Moroccan NPLs...


Cyberpunk Trading Card Game Surges Past Goals on Kickstarter
The Cyberpunk Trading Card Game crowdfunding campaign has seen massive success, quickly surpassing its initial goal and raising over 12...


Aurora Shifts Strategy Toward Global Medical Cannabis Markets
In March 2026, Aurora exited the recreational cannabis market to focus on higher-margin global medical cannabis. With 81% of revenue...


SPECT-CT: Advanced Imaging for Precise Cardiac Assessment
SPECT-CT is a key cardiac imaging technique that evaluates blood flow to heart muscle, identifying reduced perfusion and prior damage....


Blockchain Adoption Accelerates as SwissChain and Amundi Launch Tokenized Financial Solutions
SwissChain Holding SA has digitized its share certificates using blockchain, improving transparency, efficiency, and ownership tracking while maintaining Swiss legal...
 |
|
 |  |
 |
|
-
 Crypto7 days ago
BlackRock’s $94M Crypto Move Signals Rising Institutional Momentum
-
 Crypto2 weeks ago
XRP vs Solana ETFs: Retail Hype Meets Institutional Interest
-
 Biotech17 hours ago
SPECT-CT: Advanced Imaging for Precise Cardiac Assessment
-

 Fintech1 week ago
Swiss Fintech Sector Enters Maturity as AI and Infrastructure Take the Lead