Markets
The Anatomy of a Correction: History Warns of a Deeper Market Fall Ahead
Since March 2025, stocks and gold have entered corrections, echoing past bear markets. History shows sharp drops often rebound before deeper collapses triggered by black swan events. Despite hopeful rallies, new highs rarely follow. Past examples—1929, 2008, 2011—warn that feeble rebounds typically precede major declines. Current market risks suggest caution, not complacency.

After the S&P 500 (SPX) fell swiftly 21.1% from the top on February 19th, 2025 to the low on April 7th, 2025, the stock market has entered what appears to be a corrective phase. As well, we can’t ignore gold that, after hitting $3,500, has also gone into a corrective phase. Following sharp drops (or gains), a corrective period is not unusual.
The question is, how long does it last? And, how high does it go? How do we know that this is not the start of a new bull market (or in gold’s case, a new bear market)? Since the inauguration of Donald Trump on January 20, 2025, the first 100 days have been a wild ride. The rebound so far is roughly 15%. Gold has already fallen 8%.
What we are witnessing is not unusual. We’ve seen this picture before. Call it the anatomy of a correction. We saw it in the 2007–2009 bear market for stocks that culminated in the Lehman Brothers collapse in September 2008. We saw it with gold in April 2013 when a black swan event saw gold collapse 18% (almost $300) in a matter of two days. The Lehman Brothers collapse saw the S&P 500 lose 33% in 25 days before it finally bounced.
When markets reach a top, something triggers a decline that can often be sharp. Following the decline, an attempted at rebound follows. Then more often than not the rebound is followed by a sudden collapse that catches many by surprise (hence, a black swan event). Right now, we are only part-way there as we are now working on the correction or rebound phase. We can’t say how long it will last. It could be a few weeks or a few months.
That’s why it is instructive to have a look at a couple of bear markets that have occurred since 2000. A swift decline was followed by a correction that lasted anywhere from two months to 13 months (the bull trap), then the boom came down—a black swan event and a sharp, nerve-wracking decline. We’re going to take a look at a couple: the 2007–2009 bear market for stocks during what was known as the financial crisis and Great Recession and the 2011–2015 bear market for gold. Despite differences in how long they lasted, the characteristics are surprisingly similar.
Before we get into them, we’ll go back quite a number of years to the bear market of 1929–1932. Yes, there too the characteristics were surprisingly similar. That market topped in September 1929. A swift decline followed that included the crash of 1929. The decline lasted roughly two months, bottoming in November 1929. The S&P 500 had fallen 34.2%. Then came the hook; i.e. the rebound, the correction. The correction lasted five months until April 1930. The SPX gained back almost 26%. Everyone thought it was the end of the collapse and that we’d soon see new highs. No new highs were forthcoming.
No, there was no one black swan event during the 1929–1932 collapse. The main black swan was the crash of 1929 over three days October 24, 28 and 29. The Smoot-Hawley Act of June 1930 became a catalyst for the decline in the markets and Great Depression that didn’t see a stock market low until July 1932. The decline was just a steady down with occasional rebounds before it finally bottomed in July 1932, a period of 27 months from the April 1930 high.
The SPX fell an astounding 83%. No, we are not expecting that this time around, but there were two key points that the market made. First, the rebound was feeble, more of a hope than a reality. Second, no new high was ever seen. And there is where the set-up comes for an even larger decline. Hope runs out, and no new highs occur.
The S&P 500 2007–2009
First, we’ll look at the bear market of 2007–2009. Another ideal examination could have been seen with the NASDAQ of 2000–2002; however, we’ll center on this one, followed by the gold bear of 2011–2015. There are other worthy candidates, notably the 1973–1974 bear market and even the 2000-2002 bear market in tech stocks. They all have similar looks. A sharp decline followed by a rebound then a black swan event that triggers a bigger decline.
S&P 500 2007–2009
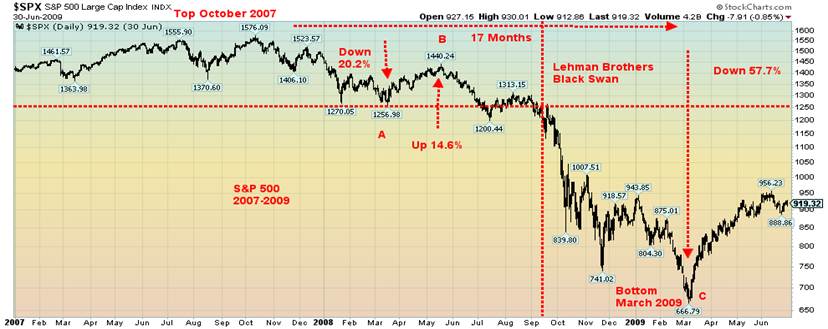
The initial decline that lasted from the top in October 2007 to a low in March 2008 was triggered by the collapse of a couple of Bear Stearns hedge funds and the emergence of problems in the housing sub-prime loan market. There had been a housing bubble, a growing debt bubble, and an oil bubble as well. Remember, oil had soared to an unheard-of price of $147 by July 2008. When the bubble bursts, nothing is spared.
That initial decline saw the SPX lose 20.2%. From top to bottom, the decline lasted five months. Finally came the correction. It lasted only two months into May 2008 for a gain of 14.8%. There was some celebrating that the mini-bear might be over. Then a slow, steady decline got underway as things were not looking good in the sub-prime mortgage loan market. Initially, we fell into July, then had a small rebound into August/September. September has a history of being the worst month of the year for stock markets. It didn’t disappoint.
On September 15, 2008 came the black swan event—the collapse of Lehman Brothers, an investment banking firm founded in 1850. Sub-prime loans, a massive mortgage-backed securities portfolio, collapsed, leaving Lehman some $600 billion in debt. Lehman became the poster child for not playing ball with the Treasury and the securities regulators. Its collapse was brilliantly captured in the two films Inside Job (2010) and Too Big to Fail (2016). The collapse was vicious with the SPX initially falling 30% into October before a bounce developed.
Ultimately, the market didn’t bottom until March 6, 2009, at which time the S&P 500 had fallen 57.7% from its high in October 2007.
It was the steepest decline since the Great Depression. Only through a massive injection of liquidity into the market coordinated by the central banks and led by the Fed (called quantitative easing or QE), along with dropping interest rates to zero in some cases, was a more devastating decline avoided. The world entered what was known as the Great Recession, as it was at the time the steepest decline since the Great Depression.
A few things stand out: an initial decline, a rebound giving rise to hope that the worst is over, no new highs, then, a black swan event that collapses the market.
Gold 2011–2015
The period 2001 to 2011 was a great one for the gold bugs. Gold rose from around $250 in 2001 to a peak over $1,900 in 2011. This was an incredible run that saw not just gold rise but silver as well from $4 to $49.50. The gold stocks, as measured by the Gold Bugs Index (HUI), rose from 35.3 to a peak of 638.6—an amazing run with gold up 660%, silver up over 1,100%, and the HUI up over 1,700%. The big run took place from 2008 to 2011 as gold, silver, and the gold stocks were the first out of the chute following the Lehman Brothers collapse.
Quantitative easing, zero interest rates, economic uncertainty, flight to safety, and a weak US$ Index were amongst the factors that helped gold. The U.S. also experienced a credit downgrade in 2011 and the first strong signs of the emerging EU/Greek debt crisis were underway. Inflation was a concern, but was hardly noticed. There were also geopolitical concerns, such as unrest in the Middle East. Then the market topped in September 2011. Silver had peaked earlier in April 2011, thus creating a divergence at the September top.
At that point, things changed. The Fed talked of tapering, monetary policy normalized, economic conditions were improving, inflation was subsiding, the US$ Index was rising, and there was less concern for safe havens.
Gold peaked, then fell roughly 20% into December 2011. Then the rebound got underway. There was an up, then a down, then a final up into October 2012. Gold investors were lulled into thinking that gold was just correcting or consolidating before another upside run was to get underway. It never happened. Altogether gold gained roughly 18% during the corrective period. No new highs were seen. Gold appeared to breakout in October 2012. The breakout was not confirmed by either silver or the gold stocks. A divergence that proved fateful.
Gold 2011–2015
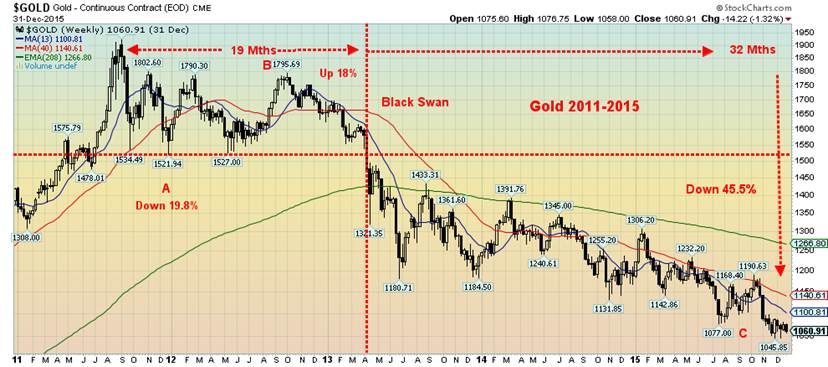
Countries were repatriating their gold. Venezuela repatriated its gold in August 2011, an event that may have helped trigger the September 2011 top. In January 2013, Germany asked to repatriate its gold from the vaults of the Fed and Bank of France. It was in response to the problems created by the EU/Greek debt crisis that shook the EU at the time. U.S. credit downgrades didn’t help. Then came the black swan event.
Someone offered 400 metric tonnes of gold for sale on April 12, 2013. The result? Markets tanked, with gold falling initially about 26% into June 2013. That included the fateful two days in April 12–15 when gold fell almost $300. Following rebounds in 2013, gold began a long, painful decline that didn’t bottom until December 2015. At that time gold was down 45.5% from its top. Silver fell almost 73% while the HUI collapsed 84%. A colossal wipeout. Gold bugs were in a panic.
So, once again, we had a euphoric top, then an initial sharp decline, followed by a rebound that kept everyone in thinking the worst was over; however, no new highs were seen. A slow, steady decline got underway in the latter part of 2012 and into 2013. The rebound in silver was even more feeble than the gold rebound, a divergence. Then came the black swan and the events of April 2013. Panic followed.
The key takeaway is that a top is seen, then along comes events that spark a sell-off. In the current case, there was an initial Trump bump after his inauguration on January 20, 2025, but it quickly ended as the threat of tariffs got underway. Notably, the Trump bump saw only the SPX making new highs. No other index did, a divergence we noted at the time. The initial decline for the SPX was 21.3%. Now comes the correction. And, if the past is a guideline, expect at least a two-month consolidation or correction, possibly even as long as six to eight months, before another decline gets underway. The Dow Jones Industrials (DJI) closed above 40,000 on
April 30, suggesting further rises ahead. However, we expect no new highs will be seen. However, we can’t rule new highs out. The big question is what will the black swan event be that triggers a bigger decline? Will there even be a black swan event? It could be anything. The outbreak of war, a sovereign debt collapse that shakes markets or a Lehman Brothers event that threatens the entire financial system.
It is important to note that these types of patterns are not exclusive to stock indices or gold. Bitcoin also followed the pattern during its collapses in 2017/2018 and again in 2021/2022. To the upside, gold had five corrections ranging from 8.5% to 15% during its 2009–2011 run from $680 to $1920. The current gold run started in 2022 at $1,614. So far, we’ve had five corrections of note ranging from 6.7% to 12.7%. What we now have to watch for is a rebound that does not take gold to new highs. That could prove bearish. A confirmation will only be seen once gold, silver (over $35), and the gold stock indices (HUI, TGD) are also making new highs. Anything else could prove to be a divergence and a more dangerous decline could then be underway.
In summary, the characteristics in a bear market are as follows: a decline that shakes everybody, a rebound that gives hope, then (although not always) a black swan event that collapses the market. The entire phase can last anywhere from 18 months to two years or more. The rebound phase could last anywhere from two to six months.
For the record, in bull markets the pullbacks might be more frequent but are usually not more than 10% or so. They create that stairstep formation more characteristic of bull markets. Hence, we follow the trend lines in bull markets carefully. Once that trendline breaks the bull-run is usually over.
Beware the bull trap.
Sentiment and GDP
We can’t ignore the fact that consumer sentiment continues to decline. The latest Conference Board Consumer Confidence Index showed another decline to 86, a 7.9 decrease from March and the lowest in 13 years. The Expectations Index for the likelihood of a recession and higher inflation rose. We note that the
Consumer Confidence Index has fallen out of a triangular pattern that project down to at least 50. That would still be above the low seen in 2009 during the financial crisis/Great Recession. The pessimism just keeps growing.
We suppose the Q1 Advance GDP should not have been a surprise. It was reported as negative 0.3%, below the consensus of up 0.5% but more in line with what the Atlanta Fed had predicted. It was the first decline since 2022. Q4 2024 was a positive gain of 2.4%. Oddly, a surge of import buying contributed to the decline as buyers boosted inventories in advance of the anticipated tariffs. Consumer spending also slowed to the slowest pace in two years. Federal government expenditures, often a boost to the economy, also declined sharply. However, fixed investment rose.
Not to be outdone, Canada also reported a 0.2% decline for the month of February. The market had expected the GDP growth rate to be flat. However, under the circumstances, it should not come as a surprise.
Note, this is just the Q1 advance. We’ll receive updates over the next two months before we get the final Q1 GDP. It takes two consecutive quarters of negative growth to signal an official recession. Nonetheless, parts of the country are no doubt already experiencing a recession.
U.S. GDP Growth Rate 2015–2025 % Q1 Advance
Chart of the Week
Employment Rate vs. Unemployment Rate 2015–2025
The market may have misled itself a bit this past week. Earlier in the week the ADP Employment came out and the job increase was only 62,000 vs. an expected 110,000. JOLTS job openings were also lower at 7.19 million when they expected 7.4 million. Finally, the weekly initial claims came in higher at 241,000, above the previous week’s 223,000 and the forecasted 225,000.
While the initial claims are up, they still don’t appear to reflect a potential rise due to all the recent layoffs and the number of civil servants let go. Severance packages play a role in that. Finally, we can’t help but note that PCE prices, closely watched by the Fed, came in at 3.6%, well above the expected 2.1%. Core PCE prices came in at 3.5% vs. expected 2.2%. Couple this with Q1 GDP at negative 0.3% and it all points to a weakening economy with continued high inflation (stagflation).
Maybe the April nonfarm payroll wasn’t a surprise. Yes, it came in higher than expected at 177,000 vs. the expected 130,000. However, they lowered the previous two months downward by 58,000. So, it kind of balances out that April was higher than the previous two months’ drop. Net, and the gain was only 119,000. Also note that the ADP employment and the nonfarm tend to diverge but then eventually, overall, they converge. Still, a reminder that unemployment is a lagging indicator so while it may look good now, as we noted at our opening, things are actually weakening.
We look for anomalies. The household survey employment level showed employment rising 436,000. However, the labour force grew by 518,000. So, they offset each other. The household survey differs from the establishment survey in that the household survey contacts homes while the establishment survey contacts businesses. The nonfarm payrolls come from the establishment survey while the civilian labour force and the employment level come from the household survey.
The unemployment rate (U3) was steady at 4.2% which was largely expected. It was helped by the fact that the employment level and civilian labour force were roughly matching. The U6 unemployment rate (plus all persons marginally attached to the labour force, plus total employed part-time for economic reasons, as a percent of the civilian labour force, plus all persons marginally attached to the labour force) actually fell to 7.8% from 7.9%. Again, this was helped by the balanced offset of labour force vs. employment level. The Shadow Stats unemployment, which is U6 plus all those deemed no longer in the work force following changes in 1994, actually rose. It went from 27.4% to 27.5%. Maybe that’s telling.
A few things caught our attention. The average weeks unemployed rose to 23.2 weeks vs. 22.8 weeks while the number unemployed 27 weeks or longer rose 95,000. Finally, the median weeks unemployed jumped to 12 weeks from 10.9 weeks. People are being unemployed longer. The number working full-time rose 305,000 while the number working part-time was up 56,000. That absorbs most of the rise in the employment level.
The labour force participation rate was 62.6% vs. 62.5% and the employment population ratio was 60% vs. 59.9%. All that says to us is that more people were participating the labour force. Interestingly, the number of those not in the labour force was also up by 205,000. The NILF includes retirees and those on disability. That accounts for at least 70% of those not in the labour force. Students are another category.
The number of hours worked rose to 34.3 from 34.2. No rise was expected. Wages grew 0.2% month over month (m-o-m) and 3.8% year over year (y-o-y). Private education and health care drove the bulk of the increase in nonfarm. Leisure/hospitality and financial serves were up and, no surprise, the number of federal government workers fell. The latter is not down enough yet to offset gains elsewhere.
As a result of the jobs report, the stock market rose, bond yields rose (bond prices that move inversely to yields fell), the US$ Index fell, and gold was up a bit but nothing was happening with the gold stocks. In most ways, the jobs report was good, although there are definitely signs of weakness coming in. Note how the employment rate today at 60% is actually lower than it was before the pandemic crash where it topped out at 61.1%. That tells us that, percentage-wise, fewer are working today proportionality than in early 2020.
Canada reports its job numbers this coming week.
Markets & Trends
| % Gains (Losses) Trends | ||||||||
| Close Dec 31/24 | Close May 2/25 | Week | YTD | Daily (Short Term) | Weekly (Intermediate) | Monthly (Long Term) | ||
| ne | ||||||||
| S&P 500 | 5,881.63 | 5,686.67 | 2.9% | (3.3)% | up | down (weak) | up | |
| Dow Jones Industrials | 42,544.22 | 41,317.43 | 3.0% | (2.9)% | up (weak) | down | up | |
| Dow Jones Transport | 16,030.66 | 14,077.53 | 4.3% | (11.4)% | neutral | down | down | |
| NASDAQ | 19,310.79 | 17,977.73 | 3.4% | (6.9)% | up | down (weak) | up (weak) | |
| S&P/TSX Composite | 24,796.40 | 25,031.51 | 1.3% | 1.2% | up | up (weak) | up | |
| S&P/TSX Venture (CDNX) | 597.87 | 656.40 (new highs) | 0.4% | 9.8% | up | up | neutral | |
| S&P 600 (small) | 1,408.17 | 1,257.83 | 3.2% | (10.7)% | neutral | down | down (weak) | |
| MSCI World | 2,304.50 | 2,512.50 | 0.8% | 9.0% | up | up | up | |
| Bitcoin | 93,467.13 | 96,977.54 | 2.0% | 3.8% | up | up | up | |
| Gold Mining Stock Indices | ||||||||
| Gold Bugs Index (HUI) | 275.58 | 376.66 | (3.2)% | 36.7% | up | up | up | |
| TSX Gold Index (TGD) | 336.87 | 454.55 | (3.8)% | 34.9% | up | up | up | |
| % | ||||||||
| U.S. 10-Year Treasury Bond yield | 4.58% | 4.31% | 1.2% | (5.9)% | ||||
| Cdn. 10-Year Bond CGB yield | 3.25% | 3.20% | flat | (1.5)% | ||||
| Recession Watch Spreads | ||||||||
| U.S. 2-year 10-year Treasury spread | 0.33% | 0.48% | (2.0)% | 45.5% | ||||
| Cdn 2-year 10-year CGB spread | 0.30% | 0.62% | 3.3% | 106.7% | ||||
| Currencies | ||||||||
| US$ Index | 108.44 | 100.02 | 0.4% | (7.8)% | down | down | down | |
| Canadian $ | 69.49 | .7240 | 0.3% | 4.2% | up | up (weak) | down | |
| Euro | 103.54 | 112.99 | (0.5)% | 9.1% | up | up | up | |
| Swiss Franc | 110.16 | 120.99 | 0.2% | 9.8% | up | up | up | |
| British Pound | 125.11 | 132.72 | (0.3)% | 6.1% | up | up | up | |
| Japanese Yen | 63.57 | 68.96 | (0.9)% | 8.5% | up | up | neutral | |
| Precious Metals | ||||||||
| Gold | 2,641.00 | 3,238.29 | (2.4)% | 22.6% | up | up | up | |
| Silver | 29.24 | 32.06 | (3.0)% | 9.6% | down (weak) | up | up | |
| Platinum | 910.50 | 960.20 | (0.6)% | 5.5% | neutral | neutral | neutral | |
| Base Metals | ||||||||
| Palladium | 909.80 | 950.00 | 3.2% | 4.4% | up (weak) | down | down | |
| Copper | 4.03 | 4.65 | (3.9)% | 15.4% | down | up | up | |
| Energy | ||||||||
| WTI Oil | 71.72 | 58.55 | (7.4)% | (18.4)% | down | down | down | |
| Nat Gas | 3.63 | 3.65 | 17.4% | 0.6% | neutral | up (weak) | neutral | |
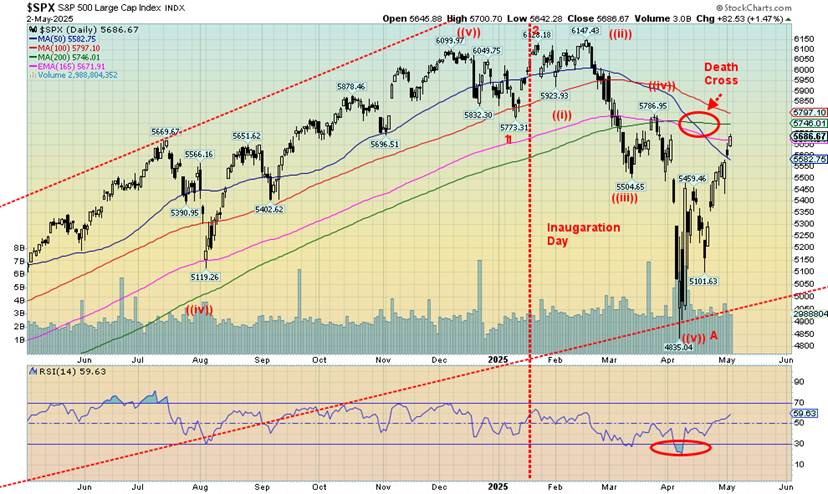
Bull trap or the start of a new bull market? As we noted earlier, it is more likely a bull trap. The trouble is, these rebounds can be tricky and can even take us to new highs where there will be euphoria. However, usually the new highs are barely above the old highs before the next down leg gets underway—slowly at first, then swiftly. The S&P 500 has regained 17.2% since the panic trade war low. At the low, the S&P 500 was down 21.3%, in bear market territory. Ease the trade wars or get into negotiations with everyone and—poof—the fear eases and euphoria returns. A reminder, however, that the U.S. is engaged in 190 trade wars, while all those countries are only engaged in one.
We were quite oversold at the low so, at worst, we did expect at least a rebound. Naturally, these have a life of their own and the rebound has been better than expected. Above 5,800 we can call the downtrend officially over. Above 5,850 new highs are very possible. Don’t be fooled. It is still a bull trap. B waves can be very tricky, quickly returning us to a sense of complacency.
On the week, the S&P 500 gained 2.9%, the Dow Jones Industrials (DJI) was up 3.0%, the Dow Jones Transportations (DJT) gained 4.3%, and the NASDAQ jumped 3.4%. The S&P 400 (Mid) was up 3.5% while the S&P 600 (Small) gained 3.2%. Neither the Mid or the Small are anywhere near their former highs. Bitcoin continued a march towards $100,000, gaining 2.0% on the week. The S&P 500 Equal Weight Index was up 2.6% while the NY Fang Index gained 4.1%.
In Canada, the TSX was up 1.3% while the TSX Venture Exchange (CDNX) gained 0.4% to fresh 52-week highs. In the EU, the London FTSE was up 2.2%, the EuroNext was up 3.2%, the Paris CAC 40 was up 2.7%, and the German DAX was up 3.8%. In Asia, China’s Shanghai Index (SSEC) closed early on the week for their Labour Day holiday that goes through to May 5. In the shortened week, the SSEC lost 0.5%. The Tokyo Nikkei Dow (TKN) was up 3.2% while Hong Kong’s Hang Seng (HSI) rose 2.4%. The Hang Seng was also closed May 1 and again May 5.
Buying the dip is in full force. But beware the bull trap. As we noted in our opener, these things don’t end well. However, they can carry on longer than expected before succumbing to reality. Under 5,400 might hint that the rebound is over. Under 5,100 it is definitely over and under 5,000 new lows are highly probable.
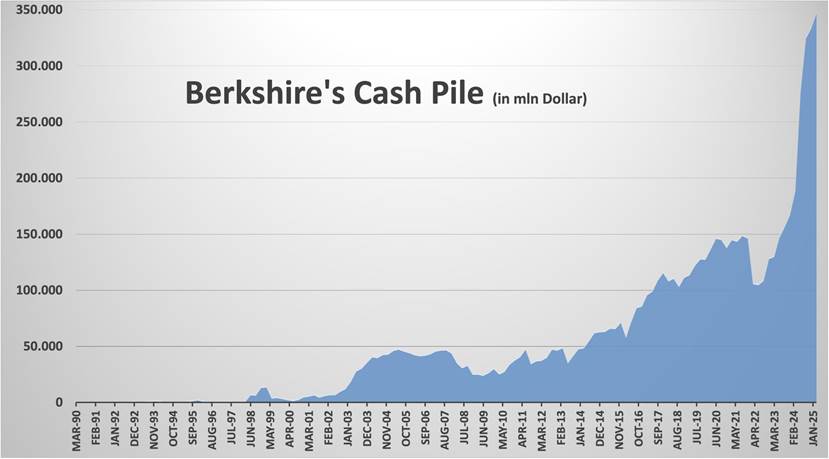
All eyes will be on the Fed this week with their May 6–7 meeting. No interest rate cut is expected. The rebound from the trade wars’ low is one of the fastest we’ve ever seen. However, these types of rebounds can suck a lot of people back in, fearful they might miss the boat. Notably, Warren Buffett’s Berkshire Hathaway cash pile is almost $347 billion now as they sold more. It’s a record. What does he know that we don’t?
“Sell in May, and go away” is the old saying. Will it be the case this time again? It’s happened before.
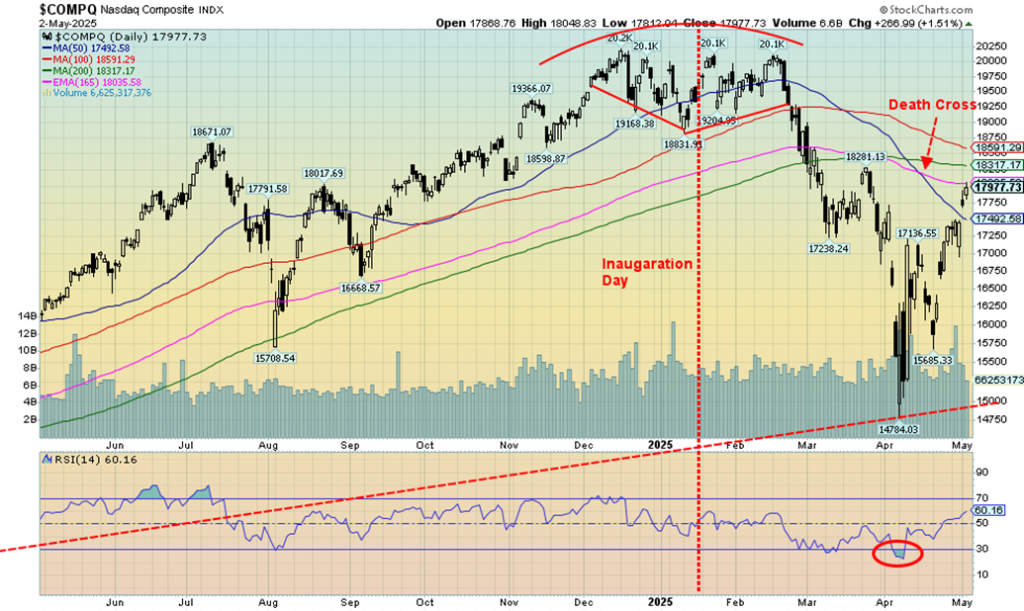
The tech-heavy NASDAQ enjoyed the rally this past week, gaining 3.4%. The NY FANG Index was up 4.1% and MAGS, representing the MAG7, gained 3.3%. The best performer of the tech stocks was the MAG7 stalwart Microsoft, which gained 11.1%. Netflix made new all-time highs, up 5.0%. We guess people are watching a lot of movies as they hunker down for the trade wars. The NASDAQ is now at some resistance, although there is room to move higher towards 18,600. Above 18,900 new highs are possible.
Of the other MAG7 stocks, Meta gained 9.1%. There was a loser: Apple was down 1.9% because of concerns with China (a lot of iPhones are manufactured in China). The beleaguered Tesla rose 0.8% while Donald Trump, represented by Trump Media (DJT), fell 2.6%. It was one of the few losers. The NASDAQ is still down on the year by 6.9% and down from the all-time high by 10.9%. At the depths, the NASDAQ was down in bear market territory, off almost 27%. Since then, it has rebounded 21.6%. Lots of volatility.
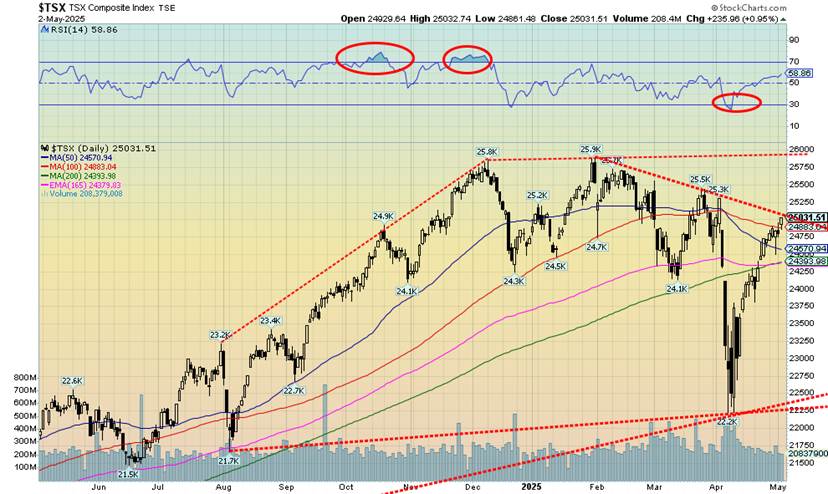
Will the TSX break through? The swift rebound from the depths of the initial trade war scare now sees the TSX recouping its losses from April 2. The TSX is also at downtrend line resistance. Will it break through? As we noted with the U.S. indices, swift up-moves like this are usually not sustainable without at least some sort of correction. However, the RSI is still pretty neutral near 60, so we are not as yet overbought. Therefore, a breakthrough is possible. This past week, the TSX rose 1.3%, held back as it was by the weak performance of the Materials sector.
The TSX Venture Exchange (CDNX) made fresh 52-week highs, gaining a small 0.4%. Of the 14 sub-indices, nine were up while five were down. Leading the way down was Golds (TGD), off 3.9%. Materials (TMT) fell 2.9% while Metals & Mining (TGM) was down 2.0%. The hot materials sector was cooling just a bit, but remains the best sector by far in 2025. Leading the way up was Income Trusts (TCM), +3.1%. Other good gainers were Consumer Discretionary (TCD) +2.8%, Financials (TFS) +2.9%, Industrials (TIN) +2.5%, and Real Estate (TRE) +2.4%. It’s hard to pinpoint a breakdown point when this run-up has been so steep.
However, we’d suggest a breakdown under 24,400 could suggest a high is in. Below 23,750, it’s definitely in. Below 22,850, new lows are possible. Still, as we have noted, this is a correction, a B wave, and not the start of a new bull market. However, B waves can be tricky and fool a lot of people. They can even make new highs. But it’s still a bull trap.
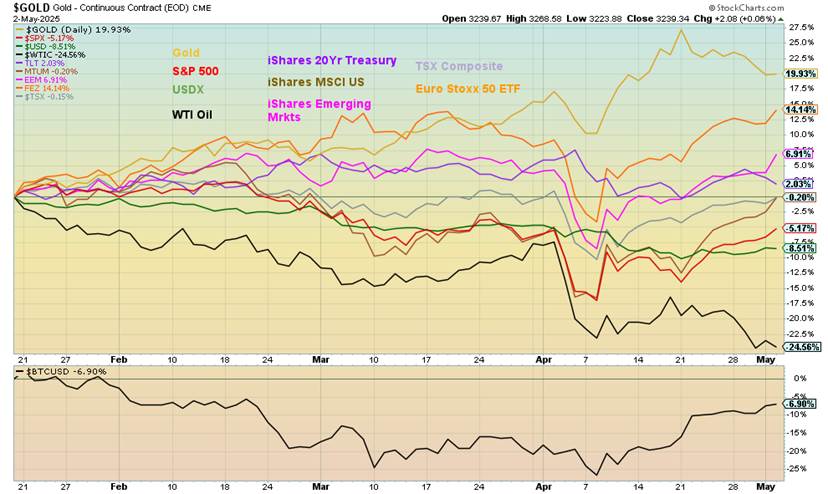
Once again, here is the scorecard since Inauguration Day, January 20, 2025. Markets continue to struggle under the Trump administration, despite the rebound this past week. Gold still leads, up 19.9% after a setback this week. Next is the Euro Stoxx 50 ETF, up 14.1%. We added the TSX Composite this week. It’s near break-even, down a small 0.2%. Bonds, as represented by the iShares 20-year U.S. treasury, are up 2.0% but they don’t consider the coupon. Everyone else remains in negative territory, led by WTI oil, down 24.6%. The US$ Index is down 8.5% while the S&P 500 is off 5.2%.
U.S. 10-year Treasury Note, Canada 10-year Bond CGB
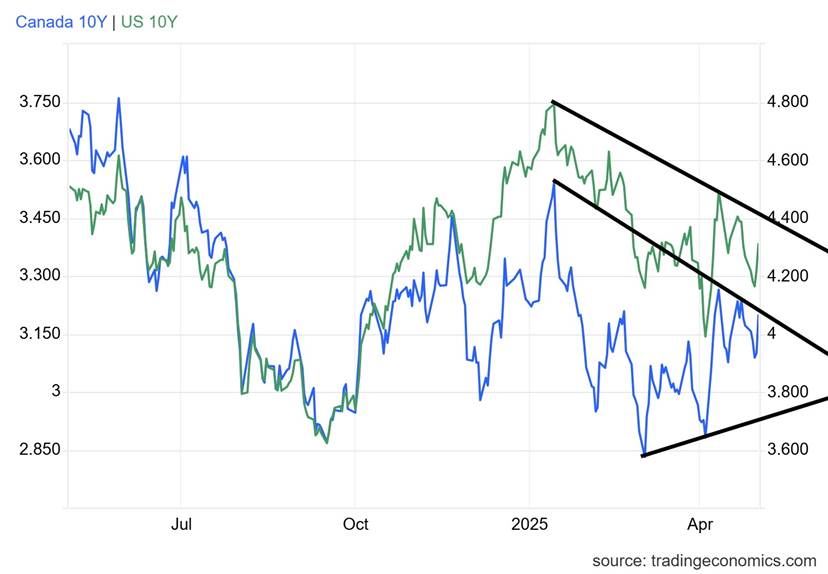
The job numbers were better than expected, even as we note underlining weakness. However, that didn’t stop U.S. Treasury note and bond yields from rising (prices, that move inverse to yields, fell). The U.S. 10-year Treasury note rose to 4.31% this past week, up from 4.26% the previous week. Are they now poised to go higher? It’s hard to say. But what it does do is to put any rate cut by the Fed on hold, at least for the time being. The Fed meets this coming week on May 6-7. The odds of a rate cut are slim to none.
We note the Fed’s favourite inflation indicator, PCE prices (or Personal Consumption Expenditures), was actually higher than expected. The March PCE was up y-o-y 2.3%, above the expected 2.2%, while core PCE prices were up 3.5% y-o-y when they expected only 3.3%. As a result, the Fed won’t cut this coming week, so the Fed rate will stay at 4.5%. Traders are now expecting only one rate cut this coming year. We are not seeing the negative impact of the trade wars just yet—at least in the numbers, despite lots of news of layoffs and DOGE firings. Severance packages can contain the blow, at least initially.
Nonetheless, any Fed decision to stand pat will enrage president Donald Trump, who will no doubt continue his attacks on Fed Chair Jerome Powell. The next Bank of Canada (BofC) interest rate decision is not until June 4. And, no, Canada will not see the same spectacle as in the U.S. Prime Minister Mark Carney, as a former governor of the BofC and the Bank of England (BOE), will not be pushing BofC governor Tiff Macklem to lower rates. Indeed, he will likely stay out of it altogether as he recognizes the independence of the central bank.
The question is, will instead long interest rates move higher? It’s possible but we’d be surprised, unless something triggers it like a sharp uptick in inflation. The long end of the bond market is where the mortgage market is priced. Corporate bonds are also priced off of the long end of the bond market. So a lot depends on where those rates are. If the U.S. were to fall into a recession, which could happen given Q1 negative growth, then interest rates could come down. However, if inflation remains high, then the incentive to cut rates diminishes. Low, negative growth plus high inflation equals stagflation. The last time we saw that was during the 1970s.
The recession spreads of the 2 year less the 10 year (2–10) were steady with the U.S. at 48 bp and Canada at 62 bp. That showed little change from the previous week. The Government of Canada 10-year bond (CGB) was unchanged on the week at 3.20%. In theory, the U.S. 10-year could break out over 4.40%, so we must keep that in mind. Canada breaks out at 3.25%. Nonetheless, bond market yields are not going the right way for Donald Trump.
The Fed controls the short end of the market but the bond dealers at big banks, big investment dealers control the long end of the bond market. They are less forgiving. As well, if there is persistent selling in the long end of the bond market switiching to the short end, or if foreigners are dumping their treasuries given nervousness over the trade wars, neither the Fed or Donald Trump can control that.
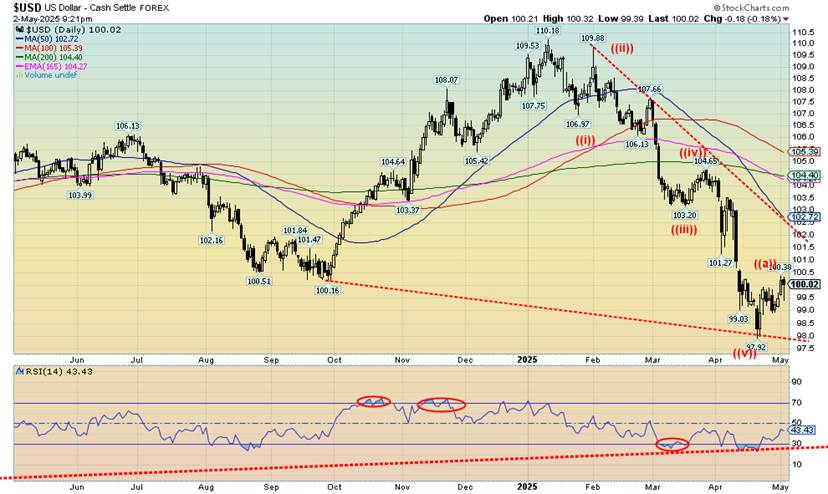
The US$ Index improved this past week, which was negative for gold. The stronger than expected U.S. job numbers helped the US$ Index, despite weaker economic numbers earlier in the week that the US$ Index shrugged off. We may have also concluded a five-wave decline from that high at 110.18 in January 2025. On the week, the US$ Index rose 0.4%. Currencies mostly fell. The euro was off 0.5% but the Swiss franc rose about 0.2%. The pound sterling was down 0.3% and the Japanese yen down 0.9%.
The Cdn$ escaped the sell-off and rose 0.3%, helped by the Liberals’ election win. For now, we believe we’ve seen at least a temporary bottom for the US$ Index. We could rise towards that downtrend line near 102. A breakout above that level could take us to 105. A drop under 99 would suggest this bounce is over and maybe new lows below 98 are underway. Overall, the chaos surrounding the U.S. is on hold, not over. Once we complete this period, we should resume the US$ Index downtrend and that means gold goes up.
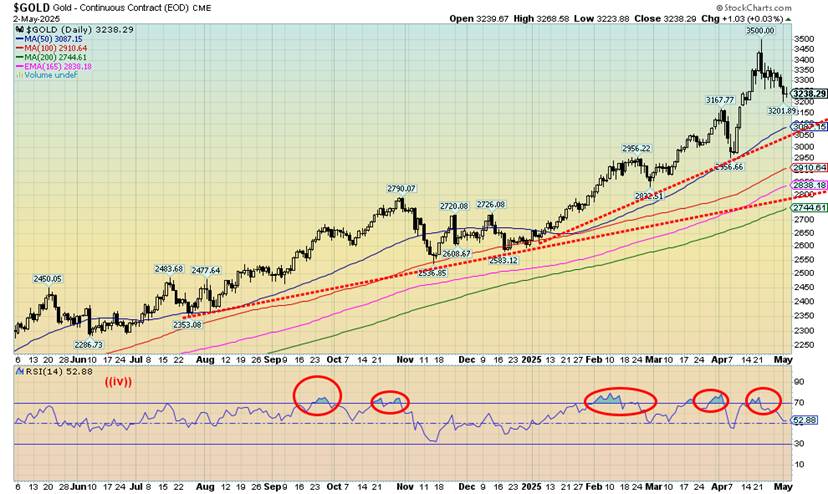
Is gold topping? Hardly. Despite the recent pullback, there was no sign of a potential major top at the recent at $3,500. This is a setback only. We’d need to see a steeper decline of at least up to 20% to suggest to us that we may have made a significant top. The decline so far is about 7.5%. The pause in the tariff wars helped propel the stock market higher and gold lower. However, the need for a safe haven remains because geopolitical tensions, economic uncertainty, and loss of faith in government have not gone away. Strong buying is still being seen by central banks. And—dare we mention it—there has been strong buying from Costco, of all places. We could interpret that two ways: bullish because they are buying, or bearish because retail is buying and retail is always wrong at the top.
For now, we’ll take the bullish. The stronger than expected job numbers oddly helped gold recover this past week. Nonetheless, a somewhat strong US$ Index helped push gold prices lower. Strong job numbers suggest that interest rates should remain at least at current levels. While consumer sentiment is sinking, consumer expectations of rising inflation are also present.
On the week, gold fell 2.0%. It was the second consecutive weekly decline and gold is now down 7.5% from the recent high. Corrections in a bull market are not unusal. Silver didn’t fare as well, falling 3.0%. Platinum did better, off 0.6%. The near precious metals, along with other commodities, fared better as palladium rose 3.2% although copper fell 3.9%. The gold stocks fell as the Gold Bugs Index (HUI) was off 3.2% and the TSX Gold
Index (TGD) fell 3.8%.
Near term, we remain cautious about gold. We are in a typically weak season for gold with bottoms seen anywhere from May to July, even August, before another upleg gets underway. We don’t want to put any levels where or when we might bottom. Right now we have support down to around $3,100, but below that we could fall to $2,800. However, there is no sign that could happen. We didn’t like that outside day reversal that happened on April 22.
Technically, it was a key reversal with a higher, record high, a lower low, and a close below the previous day. For this reason, we suspect the gold correction could play out over the next month or two before a new upleg gets underway. Silver and the gold stock indices did not have a potential key reversal days as did gold. As we noted, we believe all this tariff pause, strong job numbers, and strong US$ Index will eventually dissipate and a new upleg for gold could get underway.
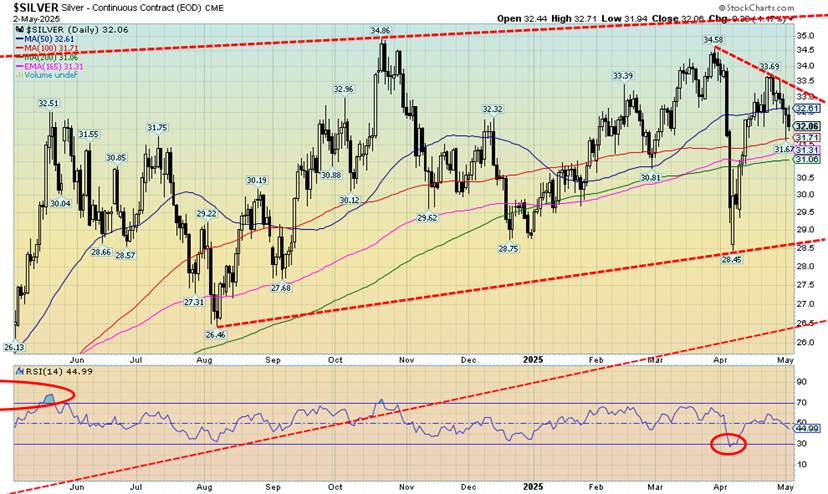
Silver’s action continues to frustrate. Just as we thought silver might get something going, this past week once again put a damper on things. We failed to make new highs even as gold did. We don’t like divergences. We couldn’t even get over the recent high at $34.58, let alone the October high of $34.86. Breaking over $35 remains elusive. Given the slope of the resistance line, we need to break out over $36 now.
New highs are not enough. We need firm new highs. Silver fell this past week by 3.0% vs. gold’s 2.0%. Silver bugs are ready to throw in the towel. But that may be the catalyst to help silver reach new levels. There is a noted shortage of silver. But it doesn’t seem to be impacting the price which remains somewhat depressed.
Support for silver is down to around $31. We’d prefer the zone to hold. Otherwise, we could be looking at a drop to better support at $29. Below that level we’d declare any silver bull move over. The current bull market had its start in February 2022 and since then we are up about 83%. That’s good, but when compared to gold it’s not so good. Gold is up 104% in the same time period. Nonetheless, we’d have to break under $21.60 to suggest new lows below that 2022 level.
On a positive note, the action over the past year appears to be an upward-sloping triangular pattern. If that’s correct, it is an ascending triangle, which is bullish. We just need to break free, preferably now over $36. If that is correct, then potential targets are up to $44. Ascending triangles have rising lows and a relatively flat top.
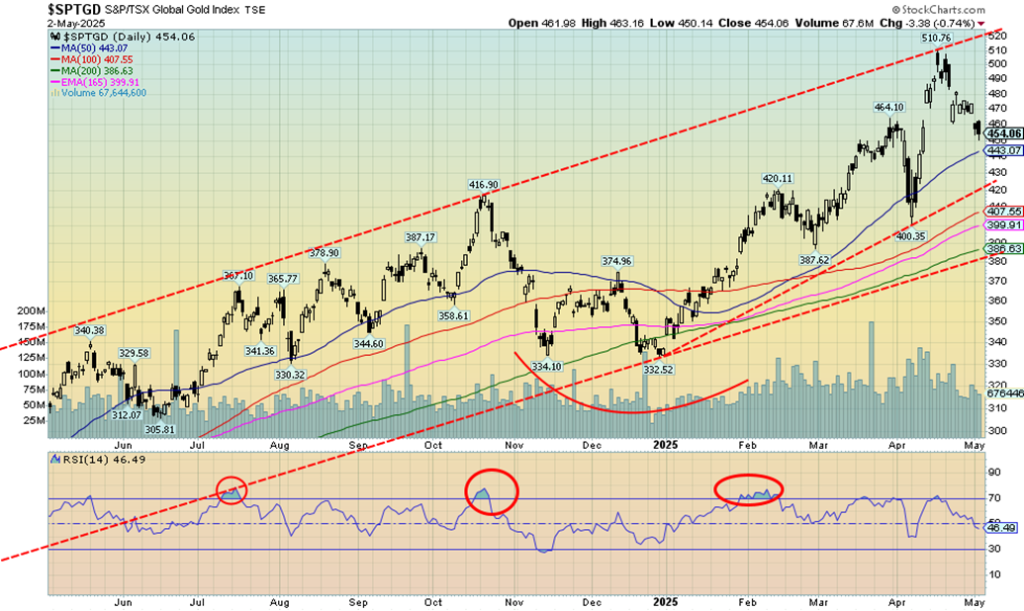
The gold stocks have fallen into correction territory with this week’s action. The Toronto Gold Index (TGD) was down 3.8% on the week and is now down 11.1% from the recent high. The Gold Bugs Index (HUI) fell 3.2% and is down 9.4% from its high, technically just shy of correction territory. That’s the bad news. The good news is that the TGD remains up 34.9% on the year and the HUI up 36.7%. Gold stocks have been the best performer so far in 2025.
For the TGD, we are approaching support near 440/443 and below that support is seen at 430. Major support is way down at 380/390. We could in theory test that level and, even if we did, the bull market would still be intact. During the 2008–2011 run-up for gold and gold stocks, there were four corrections of 10% or more on their way to an overall gain of over 200%. Gold stocks can be volatile, mostly because they are thinner, so ups and downs can be exagerated; hence, periods of quite overbought or oversold. Note earlier in October/December the TGD fell 20.3% but still held an uptrend. Given our bullish stance on gold, we expect that this pullback could present another buying opportunity.
Note: we are up 90% from a low in February 2024, highlighting the strong performance from the sector.
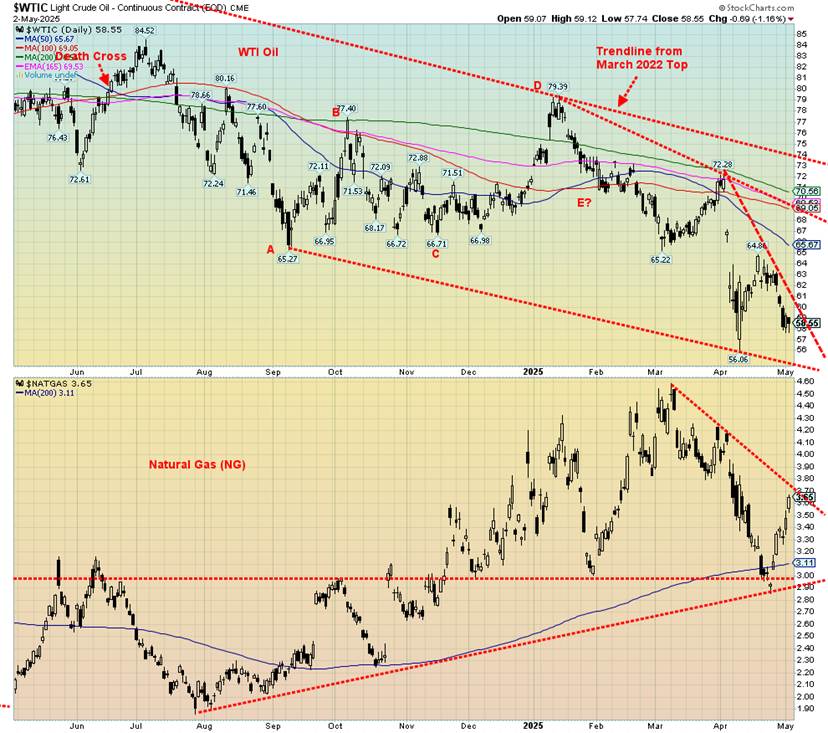
As the global economy shows signs of slowing, it translates back into oil demand that is also sliding. Couple that with the desire by Saudi Arabia to maintain market share and, as well, stymie non-OPEC production growth by slowly unwinding their supply cuts, and we had the recipe for lower oil prices this past week. If there remains a potential flashpoint for oil, it is Iran where nuclear talks have hit an impasse. As well, the U.S. is threatening more sanctions on Russia that could impact Russia’s ability to ship its oil. Iran is also being hit with more sanctions by the U.S. threatening that anyone who buys Iranian oil would be sanctioned.
Setting aside all the noise, WTI oil prices fell 7.4% this past week while Brent crude was down 8.2%. WTI is now threatening the recent low near $56. A further break could suggest, at least in theory, a decline to $48. Low prices like that threaten production, including shale production and oil sands production in Canada. All require higher prices. Instead, it’s lower prices.
A small bright spot was natural gas (NG) where production declines have recently hit a two-month low, even as LNG exports surge. Colder weather impacted the EU. We also note that the hurricane season is fast approaching and in the past that has been negative at times to NG production out of the Gulf of Mexico. As a result, NG at the Henry Hub was up 17.4% this past week while EU NG at the Dutch Hub rose 2.0%. Energy stocks, it seems, remain optimistic as the ARCA Oil & Gas Index (XOI) rose 0.3% while the TSX Energy Index (TEN) fell about 1.0%.
NG found support at the 200-day MA and rebounded. It is now close to breaking out over $3.70 and that downtrend line from the February/March high. On the other hand, it could prove to be resistance. A breakdown under $3.30 would suggest lower prices instead with the major support at $2.90/$3.00. WTI oil needs to regain above $61 to suggest a low. As well, failure to make new lows would be positive, setting up a possible double bottom. But WTI needs to get over $70 and especially over $74 to suggest a new upswing. The big wild card remains in the Middle East with Iran.
OPEC meets this coming weekend to determine any new output levels.
__
(Featured image by Jakub Żerdzicki via Unsplash)
DISCLAIMER: This article was written by a third party contributor and does not reflect the opinion of Born2Invest, its management, staff or its associates. Please review our disclaimer for more information.
This article may include forward-looking statements. These forward-looking statements generally are identified by the words “believe,” “project,” “estimate,” “become,” “plan,” “will,” and similar expressions, including with regards to potential earnings in the Empire Flippers affiliate program. These forward-looking statements involve known and unknown risks as well as uncertainties, including those discussed in the following cautionary statements and elsewhere in this article and on this site. Although the Company may believe that its expectations are based on reasonable assumptions, the actual results that the Company may achieve may differ materially from any forward-looking statements, which reflect the opinions of the management of the Company only as of the date hereof. Additionally, please make sure to read these important disclosures.
Copyright David Chapman 2025
David Chapman is not a registered advisory service and is not an exempt market dealer (EMD) nor a licensed financial advisor. He does not and cannot give individualised market advice. David Chapman has worked in the financial industry for over 40 years including large financial corporations, banks, and investment dealers. The information in this newsletter is intended only for informational and educational purposes. It should not be construed as an offer, a solicitation of an offer or sale of any security. Every effort is made to provide accurate and complete information.
However, we cannot guarantee that there will be no errors. We make no claims, promises or guarantees about the accuracy, completeness, or adequacy of the contents of this commentary and expressly disclaim liability for errors and omissions in the contents of this commentary. David Chapman will always use his best efforts to ensure the accuracy and timeliness of all information. The reader assumes all risk when trading in securities and David Chapman advises consulting a licensed professional financial advisor or portfolio manager such as Enriched Investing Incorporated before proceeding with any trade or idea presented in this newsletter.
David Chapman may own shares in companies mentioned in this newsletter. Before making an investment, prospective investors should review each security’s offering documents which summarize the objectives, fees, expenses and associated risks. David Chapman shares his ideas and opinions for informational and educational purposes only and expects the reader to perform due diligence before considering a position in any security. That includes consulting with your own licensed professional financial advisor such as Enriched Investing Incorporated. Performance is not guaranteed, values change frequently, and past performance may not be repeated.


TopRanked.io Weekly Affiliate Digest: What’s Hot in Affiliate Marketing [1xBet Affiliate Program]
If you thought nobody liked cricket, then this week, we're proving you wrong. And by the time we're done, you'll...


Tether Seeks Big Four Audit to Boost USDT Transparency
Tether, issuer of USDT, plans a full audit by a Big Four firm to address transparency concerns over its $184...


H&M Advances Sustainability and Cuts Emissions by 2025
H&M Group reported that by 2025, 91% of materials were recycled or sustainably sourced, with recycled content reaching 32%. Emissions...


NHS Funds Breakthrough CAR-T Therapy Breyanzi for Lymphoma Treatment in Spain
Bristol Myers Squibb announced NHS funding for CAR-T therapy Breyanzi, enabling its use from April 1st in Spain for lymphoma...


Crypto Markets Volatile as Bitcoin Hovers, Solana Eyes AI Integration
Crypto markets remain volatile amid the Iran war, with Bitcoin near $70,000 and ETF inflows improving outlook. Ethereum faces declines...
 |
|
 |  |
 |
|
-

 Impact Investing2 weeks ago
Antarctica Warming Reshapes Global Atmospheric Circulation
-

 Business6 days ago
Anemic Labor Market and the End of Passive Money Flows
-

 Fintech3 days ago
DZ Bank Pioneers Blockchain Bond Issuance, Advancing Tokenized Finance
-

 Crypto2 weeks ago
Crypto Markets Now Steady as Fed Decision Looms