Markets
Markets on Edge: Trump’s “King” Move, Gold’s Surge, and a Looming Debt Storm
Political turmoil is shaking markets, with Trump declaring himself “King” amid deregulation and budget cuts. The stock market wobbles as retail sales slump and consumer confidence drops. Gold surges past $2,900, signaling uncertainty, while copper prices hint at inflation. The Fed faces stagflation risks, and a global debt crisis looms.

The stock markets has held up thus far but it is now starting to teeter. We suspect it has held up primarily because of Trump’s promise to de-regulate and tax cuts.
Tax cuts we suspect are to be funded with the estimated $2 trillion Elon Musk’s DOGE is supposed to find and cut in the U.S. budget. They have already fired thousands of government workers with more on the way. In one backtrack they realized they needed the people who worked at The National Nuclear Security Administration (NNSA). Un-firing the fired?
It appears that as they cut, even Social Security is not safe where they have declared it is full of waste and fraud. What that means remains to be seen. However, cuts have already occurred with some causing bigger problems particularly as a result of cuts to the Federal Aviation Administration (FAA). There have been at least 5 plane crashes with deaths in the past month, a record for a sitting U.S. president. Protests are rising but remain largely peaceful, so far.
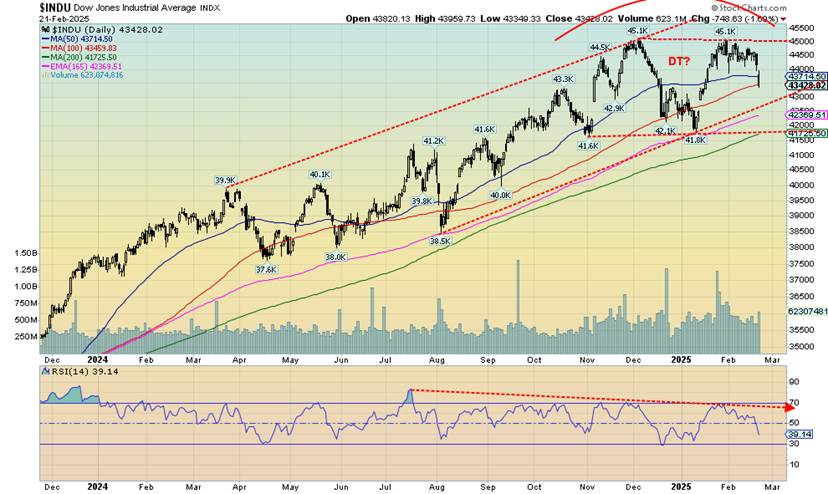
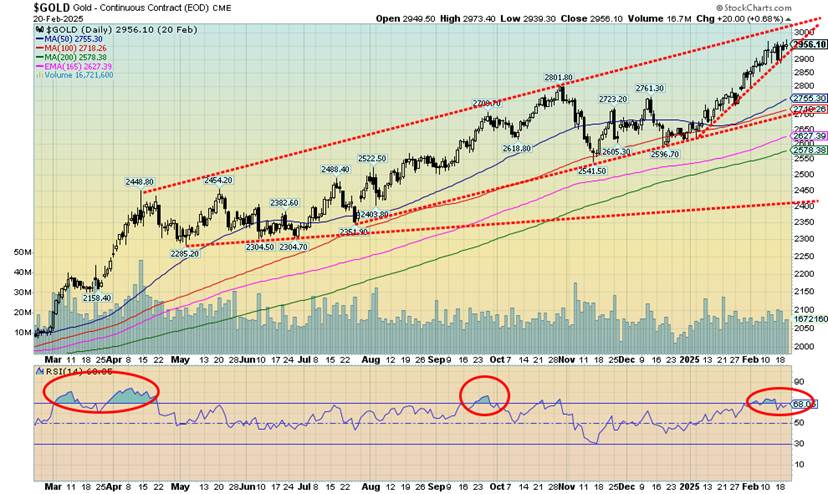
A beneficiary of the chaos has been gold which continues to set records even as it runs into resistance over $2,900. The S&P 500 also made a new all-time this past week (barely), however, no other index joined them. Mid and small cap stocks took it on the chin as did the MAG7 and the FAANGS. A potential significant divergence. Both the NASDAQ and the Dow Jones Industrials (DJI) are rolling over below their previous top. The DJI appears to be making a double top.
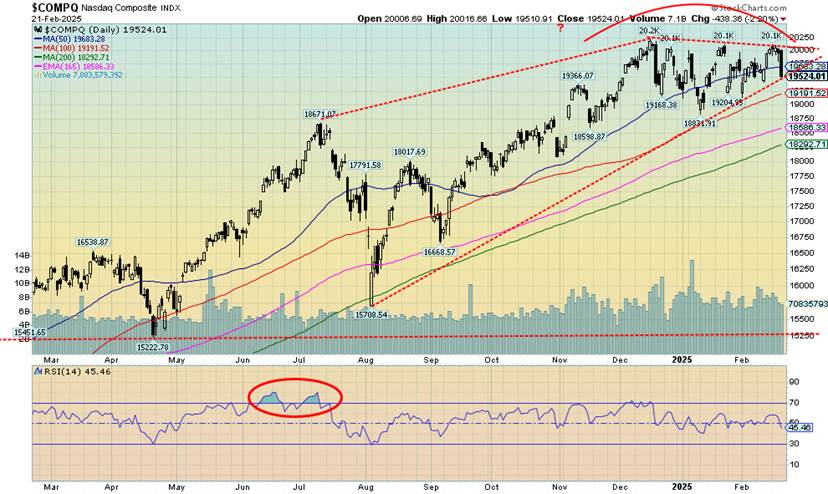
Is that a topping pattern the NASDAQ is making? Naturally, we can’t tell yet. We’d have to breakdown under 19,500 to start to confirm a top. In the interim new highs could still loom. The DJI appears to be making a clear double top. It breaks down under 42,000 and potentially projects down to 37,000. We await. The catalyst, as noted, for the recent drop was missed earnings from Walmart the world’s largest retailor.
As well their guidance going forward was below expectations. Retail sales in January fell 0.9% well below the expected fall of 0.1%. Year-over-year (y-o-y) retail sales were still up 4.2%. We expect retail sales to fall further as the chaos emanating from the White House continues and consumer confidence falls. Numerous areas including tourism are under attack as trips to the U.S. are cancelled.
We now appear to have real interest rates. As you can see with the 10-year chart of the U.S. 10-year treasury note vs. the annual rate of inflation what used to be a negative yield curve (10-year below the rate of inflation) has now turned to a positive yield curve (10-year above the rate of inflation). The spread is currently 154 basis points the highest spread since the 1980’s and 1990’s. Throughout much of the past twenty plus years the negative yield curve has contributed to the stock market bubble and the housing market. Combine that with quantitative easing (QE) and we had the makings of bubble.
The positive yield curve should act as a dampening effect on markets going forward. Couple that with quantitative tightening (QT) which has been going on for some time. The Fed is caught between a rock and a hard place with rising inflation and a slowing economy (stagflation?). The Fed controls the short-end of the debt market but the bond market controls the long-end. The U.S. and the world is awash with debt. The potential for a global debt crisis is particularly high.
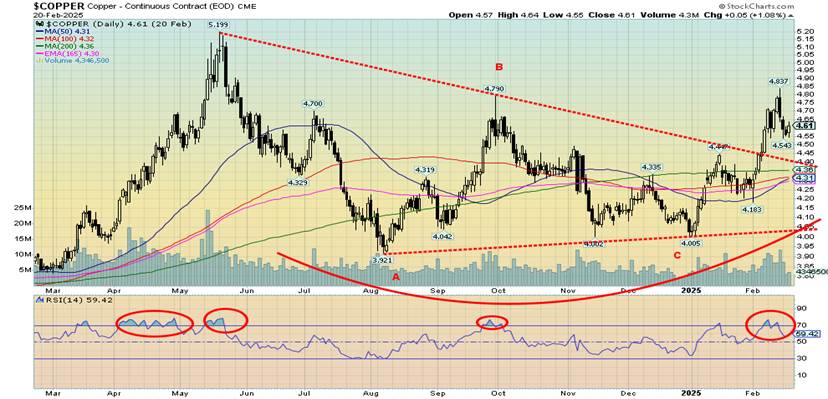
Copper prices have broken out and are rising. This is a sign of inflationary pressures. Copper is also a leading indicator for gold. As noted, gold has already been making new all-time highs. As the chaos continues, we expect it to rise further. We continue to have targets up around $3,600 although expect resistance along the way. There continues to be signs that gold is being pulled out of the London markets and transferred to the U.S. to avoid tariffs down the road.
The only bothering sign for gold, at least in the near term is what appears as an ascending wedge triangle. If correct it is short-term bearish and gold, if it were to break under $2,900, could in effect see a decline to $2,700. Gold stocks took it on the chin on Friday Feb 21, 2025 alongside the 700+ point drop for the DJI. Not a good sign. If we do get that break (a real possibility) the next move up for gold would take us to $3,000 and higher.
U.S. 10-Year Treasury note vs. CPI rate of change 2016-2025
‘
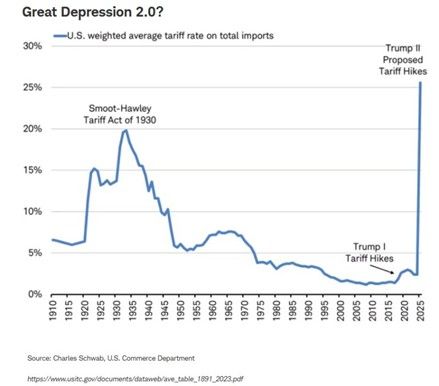
We have consistently warned that tariffs and trade wars are potentially disastrous for both the economy and the stock market. The 1930 Smoot-Hawley Tariff Act was the trigger for the unleashing of global trade wars. The result, the stock market as represented by the Dow Jones Industrials (DJI) already under some pressure from the 1929 stock market crash turned south in May 1930 and never bottomed until July 1932 down 89% from the September 1929 top.
The economy contracted 26.7% 1929-1933 while unemployment peaked at 24.9% in 1933. Tariffs are not new. During the 19th century tariffs were actually beneficial as the U.S. and others grew behind tariff walls. However, once the global economy grew with free trade following WW2 millions were hauled out of poverty and countries prospered. All of that is now at risk under Trump tariffs.
1930’s Smoot-Hawley Tariffs vs. Proposed Tariffs Hikes under Donald Trump 1910-2025
We constantly pick up charts and data showing the stock market considerably overvalued. The chart on the next page is one of the best examples we have found. Cash levels as a percentage of total assets under management by equity funds is at its lowest level in years.
We have seen some movement by smart money to raise cash best exemplified by Warren Buffett whose Berkshire Hathaway is sitting on an estimated monstrous $320 billion cash pile. Free cash flow yield is at its lowest level over the past 20 years. PE ratios, while they have come down are at their highest levels since the top of the dot.com bubble in 1999-2000.
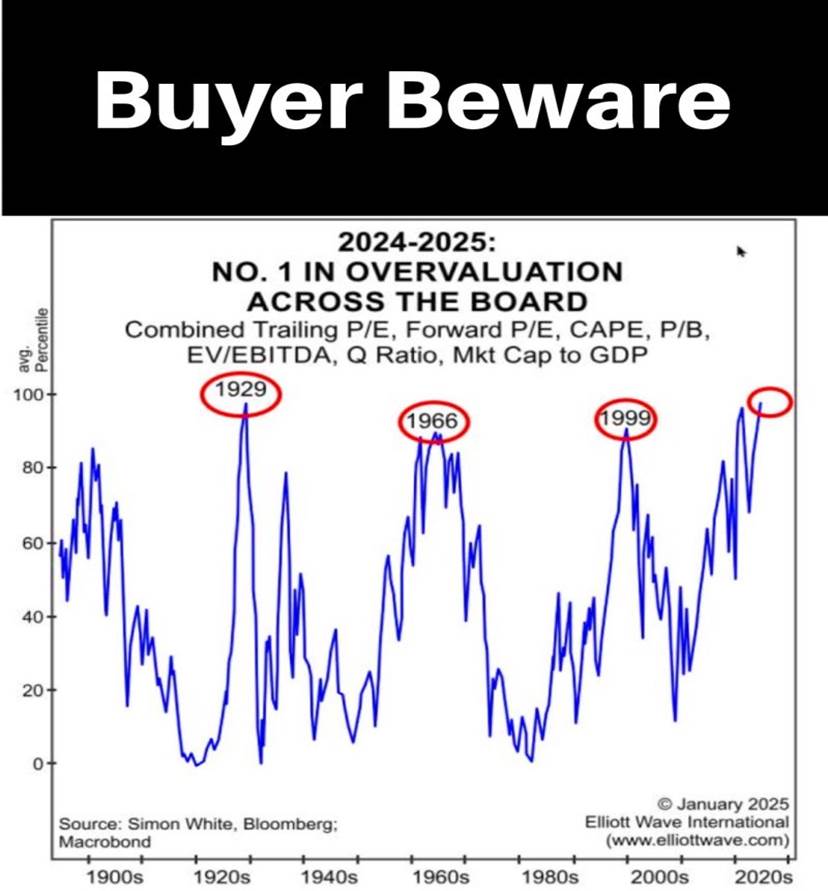
Note the spikes in the Shiller PE seen in 1902, 1929, 1937, 1965, 1999 and 2008. All preceded major stock market declines and recessions/depressions. Is this time different? Not likely.
Shiller PE 1871-2025
Threats are lurking in the commercial real estate (CRE) market, the housing market, student loans, auto loans, consumer credit card delinquencies. What if it negatively impacts the banks? That remains a real possibility. That is irrespective that banks today are better capitalized and regulated then they were prior to the 2008 financial crisis. Deregulation may have the opposite effect of creating potentially dangerous situations for banks. At the heart of recessions, one finds a banking crisis.
Volatility is rising. Thursdays and Fridays 1,200-point decline for the DJI exemplifies the rising volatility. The put/call ratio is rising towards more puts then calls. However, neither the VIX or the put/call ratio are at levels that could suggest a bottom. The New York Stock Exchange Advance/Decline (NYAD) diverged significantly with the rising DJI and SPX. All of these are further negative signs. The CNN fear/greed index is at fear while others such as the CNN market momentum and stock price strength are registering extreme fear. No surprise to see the put/call ratio is still registering greed even as it has probably topped in favour of calls over puts.
The NYSE FANG Index fell 4.7% this past week. The MAG7 stocks are reeling with Meta down 7.1% this past week following another all-time high, Amazon fell 5.3% and Tesla down 5.1%. Netflix (not a MAG7 stock) also made new all-time highs but finished down 5.2%. Only Apple was positive this past week up a mere 0.4%. We suppose anti-Trump fans would be pleased to know that Trump Media (DJT) fell 11.2% this past week. The bloom is off?
Chaos and volatility. Our themes for 2025. So far it is ongoing. In times of geopolitical tensions and economic stress, gold is the go-too asset.
Markets & Trends
| % Gains (Losses) Trends | ||||||||
| Close Dec 31/24 | Close Feb 21/25 | Week | YTD | Daily (Short Term) | Weekly (Intermediate) | Monthly (Long Term) | ||
| Stock Market Indices | ||||||||
| S&P 500 | 5,881.63 | 6,013.13 (new highs) * | (1.7)% | 2.2% | up (weak) | up | up | |
| Dow Jones Industrials | 42,544.22 | 43,428.02 | (2.5)% | 2.1% | neutral | up | up | |
| Dow Jones Transport | 16,030.66 | 16,034.36 | (3.5)% | 0.9% | down (weak) | up | up | |
| NASDAQ | 19,310.79 | 19,524.01 | (2.5)% | 1.1% | neutral | up | up | |
| S&P/TSX Composite | 24,796.40 | 25,147.03 | (1.3)% | 1.7% | neutral | up | up | |
| S&P/TSX Venture (CDNX) | 597.87 | 634.69 | (0.9)% | 6.2% | up | up | neutral | |
| S&P 600 (small) | 1,408.17 | 1,378.06 | (3.6)% | (2.1)% | down | up | up | |
| MSCI World | 2,304.50 | 2,478.41 | 0.2% | 7.6% | up | up | up | |
| Bitcoin | 93,467.13 | 95,610.98 | (1.4)% | 2.3% | down | up | up | |
| Gold Mining Stock Indices | ||||||||
| Gold Bugs Index (HUI) | 275.58 | 320.59 | (1.6)% | 16.3% | up | up | up | |
| TSX Gold Index (TGD) | 336.87 | 402.50 | (0.4)% | 19.5% | up | up | up | |
| % | ||||||||
| U.S. 10-Year Treasury Bond yield | 4.58% | 4.43% | (1.1)% | (3.3)% | ||||
| Cdn. 10-Year Bond CGB yield | 3.25% | 3.13% | 1.0% | (3.7)% | ||||
| Recession Watch Spreads | ||||||||
| U.S. 2-year 10-year Treasury spread | 0.33% | 0.23% | 9.5% | (30.3)% | ||||
| Cdn 2-year 10-year CGB spread | 0.30% | 0.39% | 5.4% | 30.0% | ||||
| Currencies | ||||||||
| US$ Index | 108.44 | 106.64 | 0.1% | (1.7)% | down | up | up | |
| Canadian $ | 69.49 | .7025 | (0.4)% | 1.1% | up | down | down | |
| Euro | 103.54 | 104.59 | (0.3)% | 1.0% | up | down | down | |
| Swiss Franc | 110.16 | 111.45 | 0.3% | 1.2% | up | down | neutral | |
| British Pound | 125.11 | 126.29 | 0.3% | 0.9% | up | down | neutral | |
| Japanese Yen | 63.57 | 67.03 | 2.1% | 5.4% | up | neutral | down | |
| Precious Metals | ||||||||
| Gold | 2,641.00 | 2,953.20 (new highs) * | 1.8% | 11.8% | up | up | up | |
| Silver | 29.24 | 33.01 | 0.5% | 12.9% | up | up | up | |
| Platinum | 910.50 | 987.7 | (3.1)% | 8.5% | neutral | up | up (weak) | |
| Base Metals | ||||||||
| Palladium | 909.80 | 990.90 | (1.8)% | 8.9% | up (weak) | up (weak) | down | |
| Copper | 4.03 | 4.56 | (2.2)% | 13.2% | up | up | up (weak) | |
| Energy | ||||||||
| WTI Oil | 71.72 | 70.40 | (0.4)% | (1.8)% | down | down (weak) | down | |
| Nat Gas | 3.63 | 4.27 (new highs) | 14.5% | 17.6% | up | up | neutral | |
__
(Featured image by LeeLoo the First via Pexels)
DISCLAIMER: This article was written by a third party contributor and does not reflect the opinion of Born2Invest, its management, staff or its associates. Please review our disclaimer for more information.
This article may include forward-looking statements. These forward-looking statements generally are identified by the words “believe,” “project,” “estimate,” “become,” “plan,” “will,” and similar expressions, including with regards to potential earnings in the Empire Flippers affiliate program. These forward-looking statements involve known and unknown risks as well as uncertainties, including those discussed in the following cautionary statements and elsewhere in this article and on this site. Although the Company may believe that its expectations are based on reasonable assumptions, the actual results that the Company may achieve may differ materially from any forward-looking statements, which reflect the opinions of the management of the Company only as of the date hereof. Additionally, please make sure to read these important disclosures.
David Chapman is not a registered advisory service and is not an exempt market dealer (EMD) nor a licensed financial advisor. He does not and cannot give individualised market advice. David Chapman has worked in the financial industry for over 40 years including large financial corporations, banks, and investment dealers. The information in this newsletter is intended only for informational and educational purposes. It should not be construed as an offer, a solicitation of an offer or sale of any security. Every effort is made to provide accurate and complete information.
However, we cannot guarantee that there will be no errors. We make no claims, promises or guarantees about the accuracy, completeness, or adequacy of the contents of this commentary and expressly disclaim liability for errors and omissions in the contents of this commentary. David Chapman will always use his best efforts to ensure the accuracy and timeliness of all information. The reader assumes all risk when trading in securities and David Chapman advises consulting a licensed professional financial advisor or portfolio manager such as Enriched Investing Incorporated before proceeding with any trade or idea presented in this newsletter.
David Chapman may own shares in companies mentioned in this newsletter. Before making an investment, prospective investors should review each security’s offering documents which summarize the objectives, fees, expenses and associated risks. David Chapman shares his ideas and opinions for informational and educational purposes only and expects the reader to perform due diligence before considering a position in any security. That includes consulting with your own licensed professional financial advisor such as Enriched Investing Incorporated. Performance is not guaranteed, values change frequently, and past performance may not be repeated.


TopRanked.io Weekly Affiliate Digest: What’s Hot in Affiliate Marketing [1xBet Affiliate Program]
If you thought nobody liked cricket, then this week, we're proving you wrong. And by the time we're done, you'll...


Tether Seeks Big Four Audit to Boost USDT Transparency
Tether, issuer of USDT, plans a full audit by a Big Four firm to address transparency concerns over its $184...


H&M Advances Sustainability and Cuts Emissions by 2025
H&M Group reported that by 2025, 91% of materials were recycled or sustainably sourced, with recycled content reaching 32%. Emissions...


NHS Funds Breakthrough CAR-T Therapy Breyanzi for Lymphoma Treatment in Spain
Bristol Myers Squibb announced NHS funding for CAR-T therapy Breyanzi, enabling its use from April 1st in Spain for lymphoma...


Crypto Markets Volatile as Bitcoin Hovers, Solana Eyes AI Integration
Crypto markets remain volatile amid the Iran war, with Bitcoin near $70,000 and ETF inflows improving outlook. Ethereum faces declines...
 |
|
 |  |
 |
|
-

 Fintech1 week ago
PayPay Targets Global Expansion After Landmark IPO
-

 Crypto5 days ago
The Iran War Tests Bitcoin and Crypto Market Resilience
-

 Crypto2 weeks ago
Oil Surge and Iran War Lift Bitcoin as Crypto Sentiment Improves
-
 Crypto2 days ago
Crypto Markets Volatile as Bitcoin Hovers, Solana Eyes AI Integration