Featured
Markets Faltered this Past Week. Is the Rally Over?
The collapse of FTX and Sam Bankman-Fried continues to dominate. It prompted us to look at how long does it take to reach a bottom once a bubble bursts. Well it’s close to 3 years. We examine a number of earlier bubbles including the Roaring Twenties, the gold and silver bubble of the 1970’s, the Japanese land bubble, the dot.com bubble, and the housing bubble. We then apply it to the crypto bubble and the stock market bubble of 2009-2022.
The sudden and dramatic collapse of FTX, the crypto exchange built by former whiz kid Sam Bankman-Fried (aka SBF), in the space of a mere three years is one of the most dramatic collapses ever recorded—$32 billion to poof nada in a matter of three days. The Lehman Brothers collapse of 2008 that almost brought down the global financial system is looking like a mere skimpy imitator, even though they had debts estimated at $619 billion. Others are comparing the collapse to that of Bernie Madoff, the mastermind of what is considered the largest Ponzi scheme in history. Madoff’s empire was estimated roughly at $64.8 billion, but at least there were some assets available to sell. Investors in FTX are liable to receive only pixie dust.
The amazing part of FTX’s collapse is the list of who’s who that were invested in the exchange. But then so-called “smart money” is sometimes not nearly as smart as they wish or appear to be. We can’t name them all, but some names stood out, like Blackrock (the world’s largest investment manager), SoftBank (large Japanese investment company), seven-time Super Bowl Champion Tom Brady, star NBA player Stephen Curry, and, here in Canada, Ontario Teachers Pension Fund, who invested $95 million from their venture capital arm, Teacher’s Venture Growth. For Teachers, it represents less than 0.05% of assets under management (AUM). Others acting like roving ambassadors for the company included star tennis player Naomi Osaka and baseball player Shohei Ohtani. The Miami Heat named a stadium after the company. Famous “Shark Tank” investor Kevin O’Leary was also an ambassador and investor in FTX. Osaka and Ohtani should have taken their pay in U.S. dollars or gold. Instead, they received cryptos and now worthless shares in FTX. Apparently now, a number of them are being sued by investors. But did the investors read the small print that their investment could fall to zero?
As an aside, Ontario Teacher’s Pension wasn’t the only large Canadian pension fund investing in crypto. Earlier, the Quebec-based Caisse de dépôt et Placement wrote off a $150 million investment in crypto platform Celsius Networks.
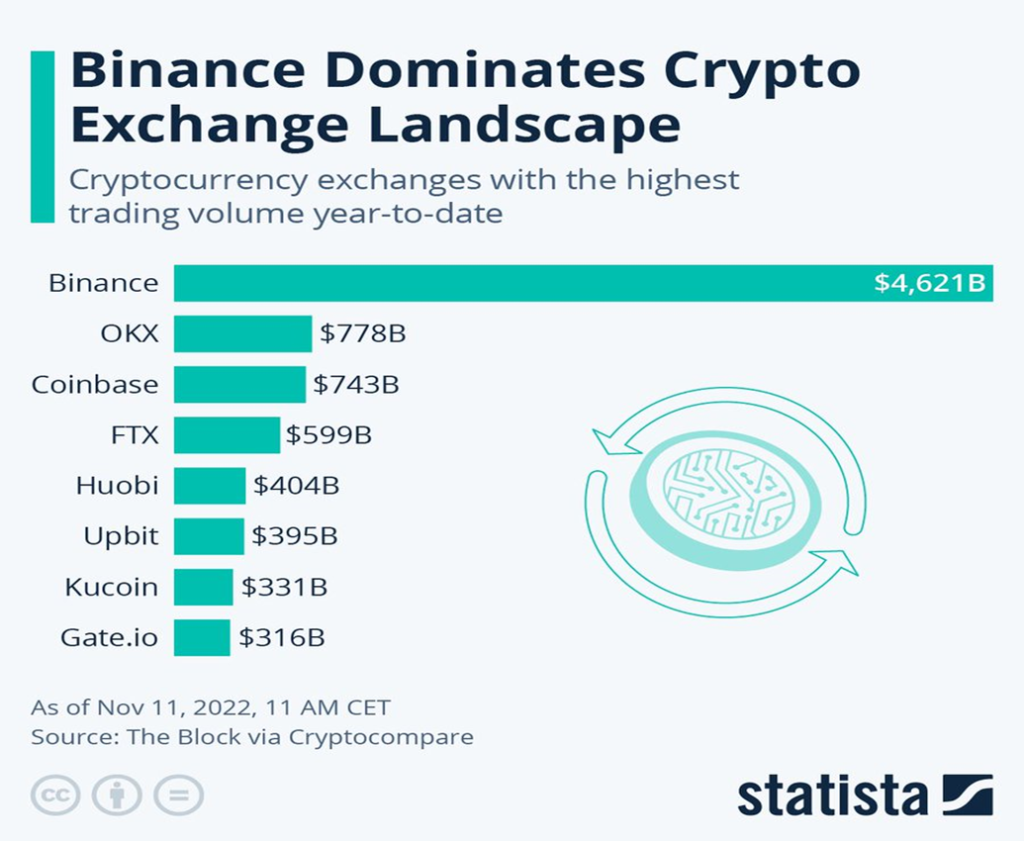
The big question that is now dominating the crypto universe is, will there be further contagion that knocks down not only other crypto exchanges but spreads into the broader financial world of hedge funds and more. Trading volumes are (or were) huge. The dominant player is Binance, founded by Chinese entrepreneur Changpeng Zhao. While evidence of contagion is just beginning to creep out, we are reminded that there was little evidence that FTX was in trouble just days before its ultimate collapse. The entire crypto world has been knocked down as the once $2.9 trillion market has collapsed to about $0.8 trillion since November 2021.
As to contagion, well, we now learn that trouble is spreading to other cryptos and exchanges. The billionaire Winklevoss twins Cameron and Tyler, both previously of Facebook fame, have had to halt withdrawals from their Gemini Earn crypto lending program. Investors are rushing in to get their money out before everything collapses. It’s like a bank run. We are also learning of other crypto bankruptcies, Voyager Digital, and on-the-brink crypto lender BlockFi. Crypto hedge fund Ikigai Asset Management has revealed that a big chunk of its assets was tied up in FTX. That no one has ever heard of these firms is not surprising. Crypto has wanted to fly under the radar of regulators from the get-go.
So far, any contagion is being limited to the crypto world—it’s the 2008 financial crisis, but only for those in cryptos. No word that it is spreading into the broader world of finance to any great extent. The full extent of this collapse is probably not yet known. Lousy credit practices and even lousier risk management have brought the crypto world to its knees.
That the boom in cryptos is over is not in question. The question is, do those who have been involved in the crypto market know that yet? The industry has been plagued with frauds, scams, and outright theft since it rose way back in 2013 when Bitcoin (BTC) started trading. Many claimed it was merely a way to launder money. However, even central banks have been examining crypto to create digital currencies that could lead to the end of paper currency. But now FTX and its guru Sam Bankman-Fried are under investigation, not only by regulators but also the FBI for possible criminal activities. Seems that somewhere along the line the words “fiduciary duty” were lost. Or maybe in the world of crypto they never existed. The world of crypto has been described as a bunch of 20-something whiz kids trading when they basically had no experience. Hype conquered substance.
Bitcoin
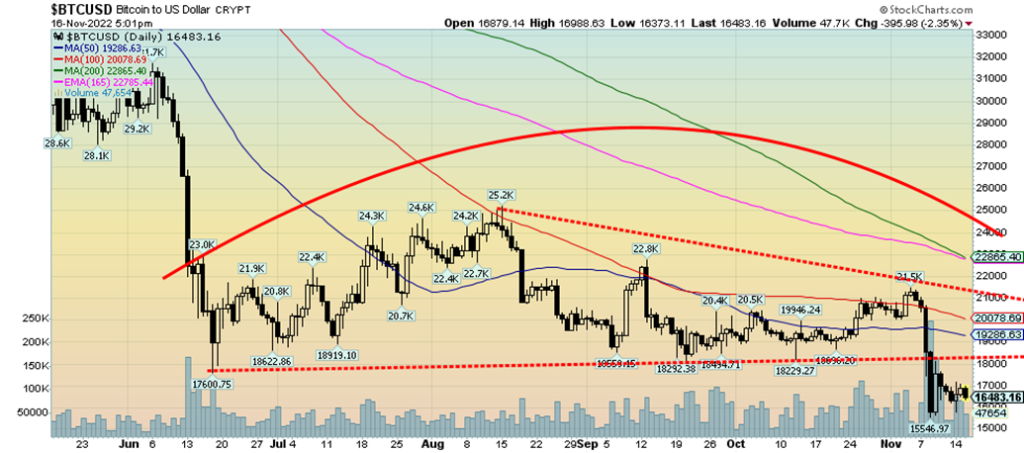
Our chart of Bitcoin shows the past six months of trading. Bitcoin formed a classic descending triangle with a relatively flat series of lows and lower or descending highs. The target, based on the descending triangle, is for Bitcoin to fall next to at least $10,400. After the initial breakdown that got underway on November 8, Bitcoin fell over a two-day period by almost 28%. Now Bitcoin appears to be in the process of forming a bear pennant. Once complete, Bitcoin should fall further towards targets. Bitcoin topped on November 10, 2021, at $68,978. Since then, it has fallen 76%. Bitcoin had gone up over 1,600% from a low back in March 2020. But if one goes back further to 2013 and its beginnings, Bitcoin’s rise was a mind-boggling 61,000% making it one of, if not the biggest, bubble in history. By comparison, the Bre-X Minerals bubble was a mere 13,000%. Tulipmania in 1634–1637 was only about 5,900%. No wonder there were so many 20-somethings becoming instant billionaires.
History is replete with bubbles that burst. The names resonate. Tulipmania may be the granddaddy of them all, unless we find out bubbles in ancient Greece, Rome, or China existed. But names are famous—the South Sea Bubble (1720), the Roaring Twenties bubble (1929), the Japanese land bubble (1990), the dot.com bubble (2000), and the gold and silver bubble (1980). We also saw bubbles in individual stocks at one time. Besides Bre-X, there were huge bubbles in Nortel, Citigroup, General Motors, Lehman Brothers, Merrill Lynch, and more recently Amazon and Netflix. During the housing financial crisis, we discovered the federally-backed mortgage companies Fannie Mae and Freddie Mac, which had gone up spectacularly during the housing bubble of the early 2000s, collapsed into bankruptcy. The list could go on. There were bubbles in memes, NFTs, trading platforms like Robinhood, and more. Bubbles are a rapid escalation of market value sparked by too much money chasing too few goods.
When the bubble bursts, the panic sets in and we have a crash as everyone tries to get out at once. The exit door, unsurprisingly, is narrow. Things like ultra-low interest rates, loose monetary policy, deregulation, loose lending practices, promotion, and securitization can all be found behind the bursting of bubbles. So, when the bubble bursts, how long does it take to reach the bottom?
We took a look at a number of earlier well-known bubbles and what we discovered was that it took roughly 34 months on average for them to reach their first good low. The range was 30 months to 44 months. In some cases, even lower lows were seen later on, but not before a significant rebound occurred. We used that first good low for our study.
The bubbles we examined were: the Roaring Twenties, followed by the stock market crash of 1929 and the Great Depression; the gold and silver bubble of the 1970s, culminating in the collapse in 1980 and a 20-year bear market; the Japanese real estate bubble and subsequent crash of the Nikkei Dow in 1990, followed by Japan’s long, never-ending recession; the dot.com bubble of the 1990s, ending with the collapse of the high-tech dominated NASDAQ in the 2000s; and the U.S. (and elsewhere) housing bubble of the 2000s that ended in the sub-prime crisis and eventual financial crisis, resulting in the collapse of Lehman Brothers. That period is now known as the Great Recession.
The question on our mind is, does the stock market run from 2009 to 2022 qualify as a bubble? The rise was 622% for the S&P 500 from the low in March 2009 to the top in January 2022. That’s on par with the rise of the Dow Jones Industrials (DJI) from 1921 to 1929 where the gain was only 497%. Gold rose almost 2,400% during the 1970s.
The Dow Jones Roaring Twenties Bubble
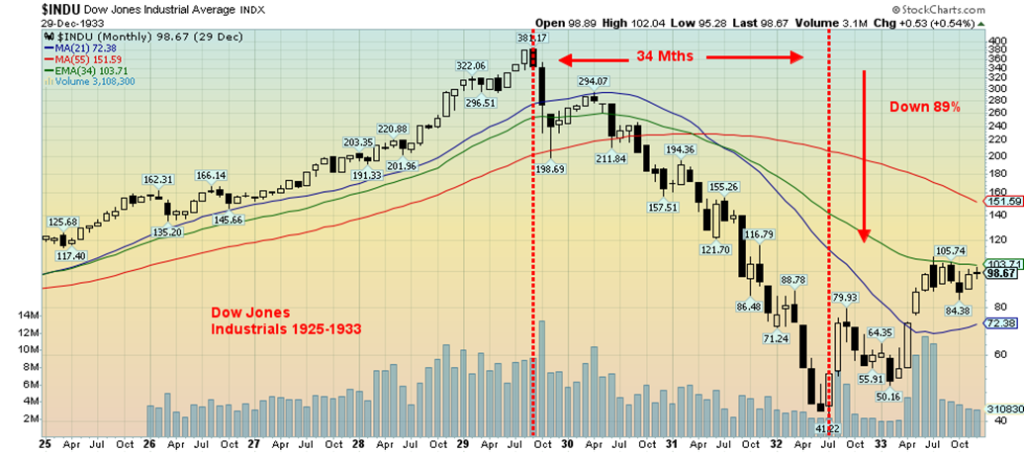
The Dow Jones Industrials (DJI) rose 497% from 1921 to 1929, culminating in the stock market crash of 1929 and the Great Depression. The final low was in July 1932, a period of 34 months where the DJI lost 89%. It took until 1954 before the DJI took out the highs of 1929. As bubbles go, it wasn’t that big, but the end result of the Great Depression makes it one of the most famous bubbles in history.
The Gold and Silver Bubble 1971–1980
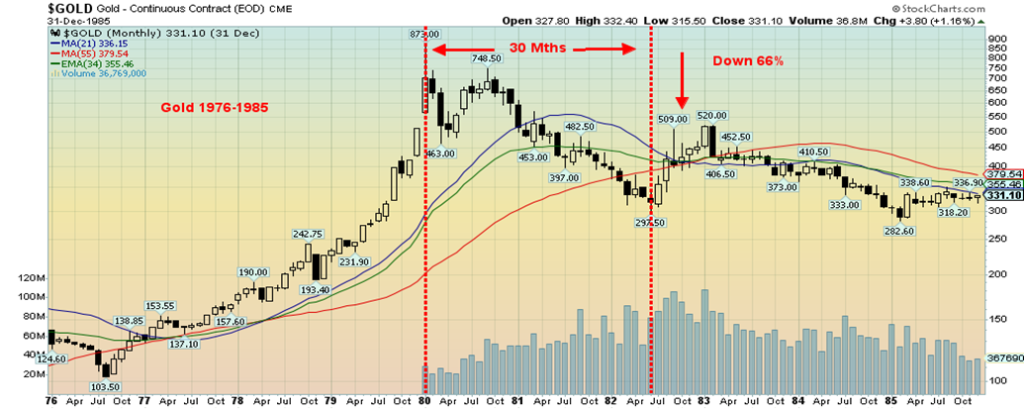
Gold, silver, and even oil and other commodities were the bubble of the 1970s. Gold rose over 2,400% from 1971–1980 and silver soared over 3,000% following the end of the Bretton Woods gold standard in August 1971. Oil rose 1,100% from 1973 to 1980, sparked by the Arab oil embargo of 1973–1974 and later the Iranian revolution in 1979–1980. Gold topped in January 1980, then crashed after Fed Chair Paul Volcker hiked interest rates to 20%. Gold made its first solid bottom 30 months later and following a solid rebound it made a second lower low in 1986. The final low for gold did not come until 1999 and 2001 near $250. Gold did not take out the highs of 1980 until 2008.
Japanese Real Estate Bubble/Tokyo Nikkei Dow
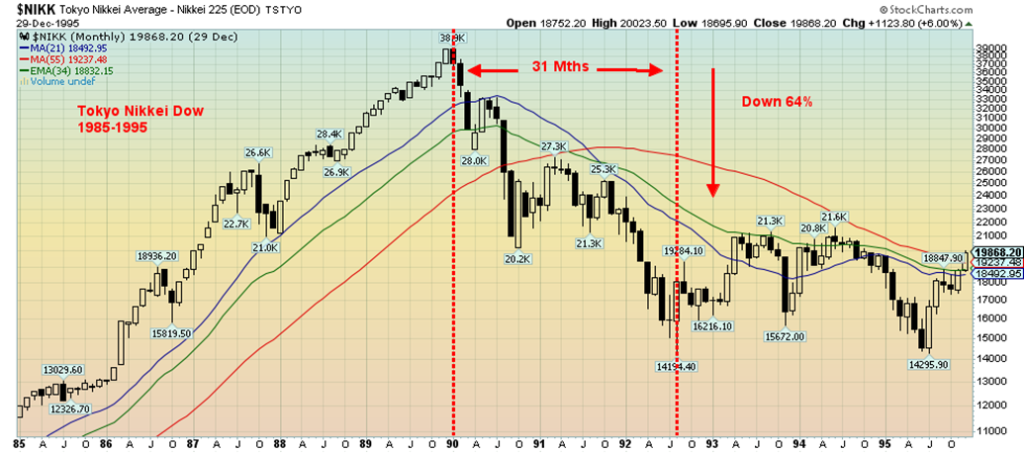
The Tokyo Nikkei Dow (TKN) rose over 1,000% almost uninterruptedly from a low in 1975 to its high in January 1990. It was driven by ultra-low interest rates, loose monetary policy, and easy credit. A massive real estate bubble followed that even saw the Japanese buying landmarks in the U.S. It was said that Japan would soon own America. The market crashed, making its first significant low 31 months later in August 1992. The ultimate low wasn’t seen until 2008 with the TKN down 82%. The TKN has never seen those highs again 32 years later. Japan appears to be in a constant recession but remains one of the largest economies in the world.
The Dot.Com Bubble 1990s, NASDAQ 1995–2005
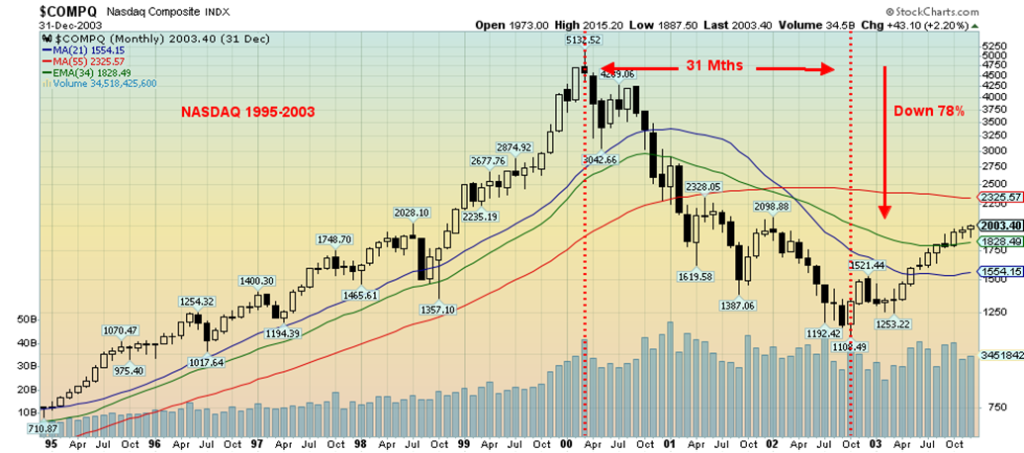
Many will more painfully remember the collapse of the dot.com/high-tech bubble of the 1990s. The collapse of the NASDAQ saw it fall 78% from March 2000 to its low in October 2002, a period of 31 months. The NASDAQ did eventually recover, but it took until 2015 before the NASDAQ took out 2000 high. Famous names that were at the heart of the collapse included Nortel Networks, Palm, Enron, WorldCom, 3Com, Pets.com, and many more.
The Housing Bubble 2002-2010
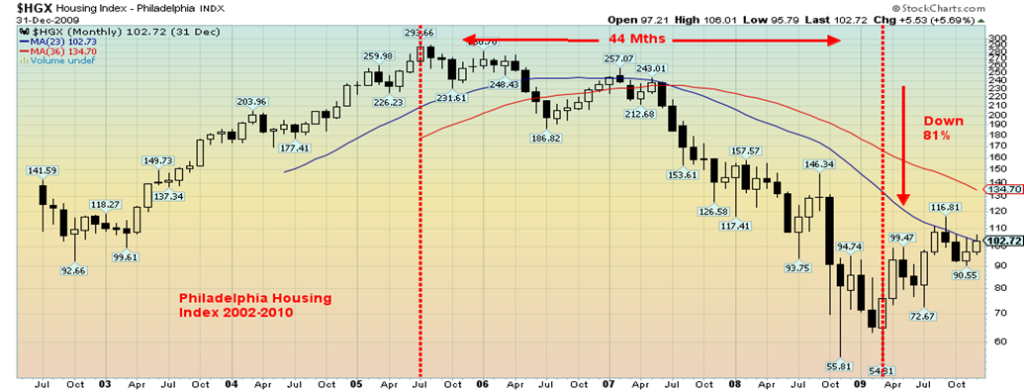
The bursting of the housing bubble of the 2000s was the major cause behind the financial crisis of 2008, the subsequent collapse of Lehman Brothers, and the Great Recession of 2007–2009. Securitization of mortgages, easy credit, promotion of housing, and deregulation were major factors creating the bubble. While the overall rise for the Philadelphia Housing Index (HGX) was a rather unspectacular 217%, the collapse was spectacular as the index fell 81% to a low in March 2009. Thousands lost their homes and the financial industry was shaken to the core, leading to the next period of ultra-low interest rates, quantitative easing (QE), and easy credit to prevent an even larger collapse.
The Granddaddy Bubble of them All—Tulipmania 1634–1637
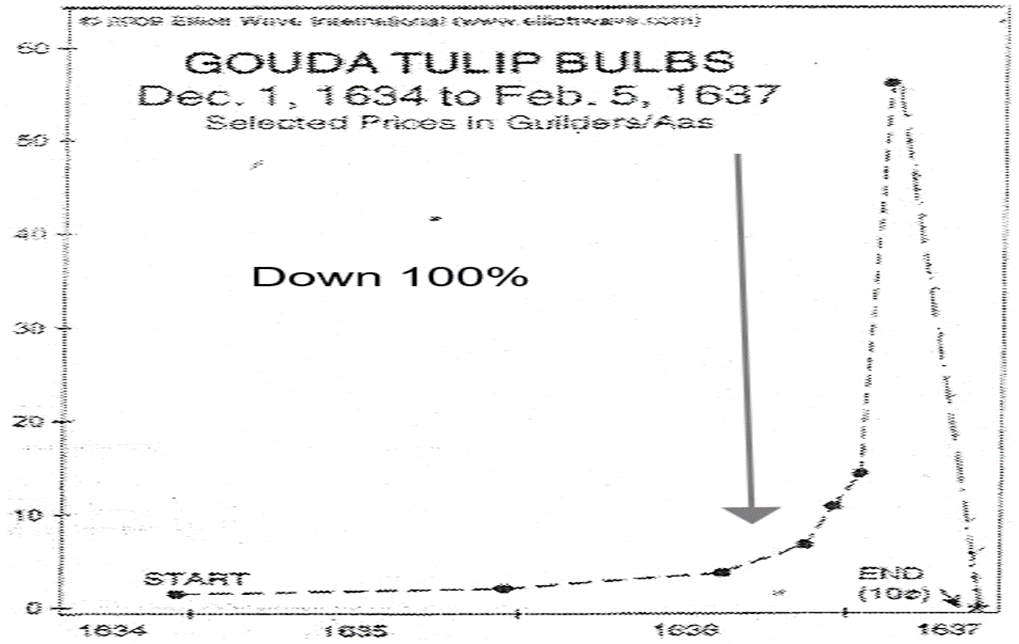
Well, we couldn’t leave without a chart of tulipmania. Tulipmania never did lead to any great economic crash. But it is noteworthy for being the subject of books and even movies—Tulip Fever (2017), a film that starred Alicia Vikander, Dane DeHaan, and Dame Judy Dench. The collapse of the tulip market did spark a number of bankruptcies, but no major trading companies went under. At the time, the Netherlands was one of the most powerful economies in the world with an economic empire that stretched around the world. Dutch colonies were found in both North and South America, Africa, Asia, and an expansive empire in what was known as the Dutch East Indies. The Dutch guilder was the reserve currency of its time during 1640–1720. Wars between the
Netherlands and France and Britain saw the Dutch empire collapse in the latter part of the 17th century. The tulip market was interesting for its use of futures and even options during its short-lived frenzy.
Bitcoin—The Bubble 2015–2022
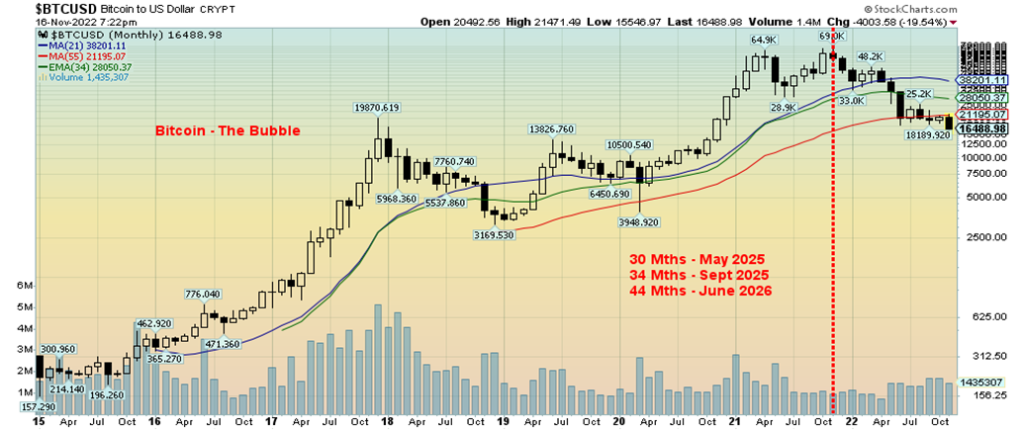
Applying what we learned about previous bubbles and how long it takes to make that first good low to Bitcoin resulted in us surmising that Bitcoin most likely won’t bottom until sometime between May 2025 and June 2026. How far will it fall? So far, Bitcoin has already fallen 76% from its November 2021 high. We suspect by the time the final bottom comes Bitcoin could be down over 90%. Are cryptos tulips?
The S&P 500 Bubble 2009–2022?
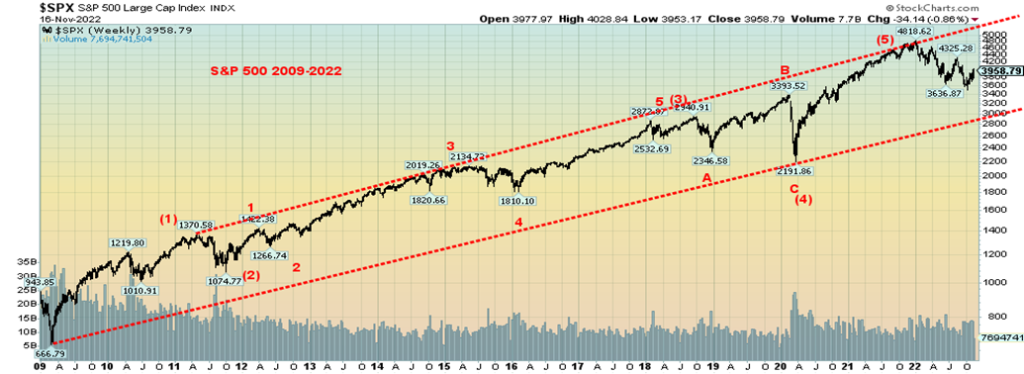
We note that the S&P 500 has made what appears to be five Elliott waves to a top in January 2022. The rise has been spectacular as the S&P 500 gained 622% from March 2009 to January 2022. That, as we noted earlier, is more than the DJI gained from 1921 to 1929. The punchbowl has been taken away as central banks move from easy monetary policy, quantitative easing, and ultra-low interest rates to quantitative tightening and hiking interest rates to combat the highest inflation seen since the 1970s. Now the piper must be paid and most likely we have entered a three-year bear market. According to the Stock Trader’s Almanac, the average bear market since 1900 has lasted only about 13 months. But the range goes out 31 months as seen with the long bear from 1939 to 1942. The Great Recession bear lasted only about 17 months.
Even bear markets have countertrend rallies. We have noted that we may be embarking on one now. But if the time between the high and the ultimate low holds as we saw with other bubbles, the final low for the S&P 500 may not come until sometime between June 2025 and July 2026. The most important long-term cycle for stocks is 18 years with the last one seen in March 2009, the low of the Great Recession bear 2007–2009. The range is 13–21 years, according to cycles analyst Ray Merriman (www.mmacycles.com), so the next 18-year cycle low could occur anywhere from 2022 to 2030, with the most likely sometime around 2025/2026. If that is correct, then this bear is lining up well. The decline could be anywhere from 20% to 50%. We have already achieved the former in the first wave down. We await the latter.
The collapse of FTX and the crypto market appears to be limited to the crypto world. Crypto billionaires will become ordinary once again. 20-something billionaires will just be 20-somethings turning 30. Some might go to jail. What happens to all their jets, yachts, and homes in Tuscany is unknown but a big fire sale could be coming. Crypto’s collapse is a lesson for everyone: what goes up in a spectacular fashion falls even faster and more spectacularly. History is replete with that scenario. Crypto is just the latest bubble that has burst as we await the next bubble. The collapse of crypto won’t bring down the financial system. However, it will leave a hole and may make governments rethink creating digital currencies. Some might survive but they will be regulated, which was what the crypto world was trying to avoid. The technology behind it, Blockchain, will likely survive as well.
The question now is, what will be the next bubble? Some believe gold could be next.
Chart of the Week
VIX Volatility Index S&P 500/Volatility Index CBOE Gold Ratio
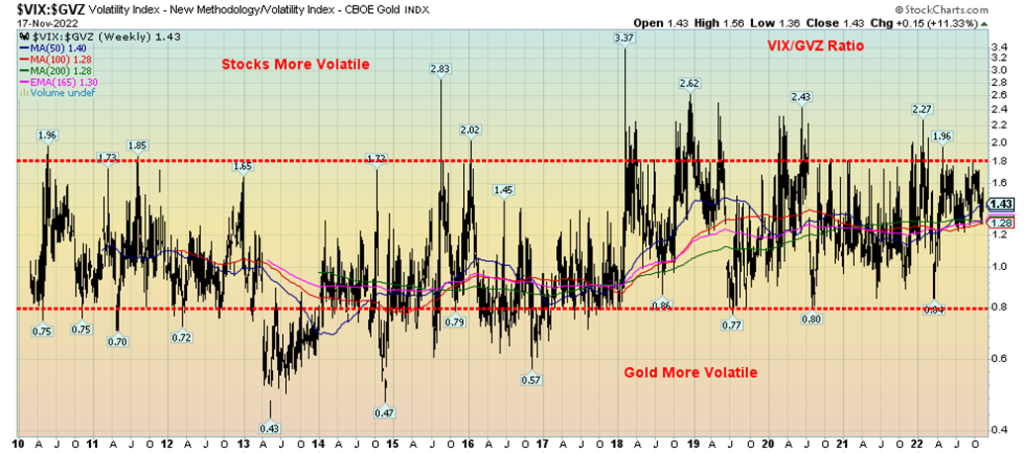
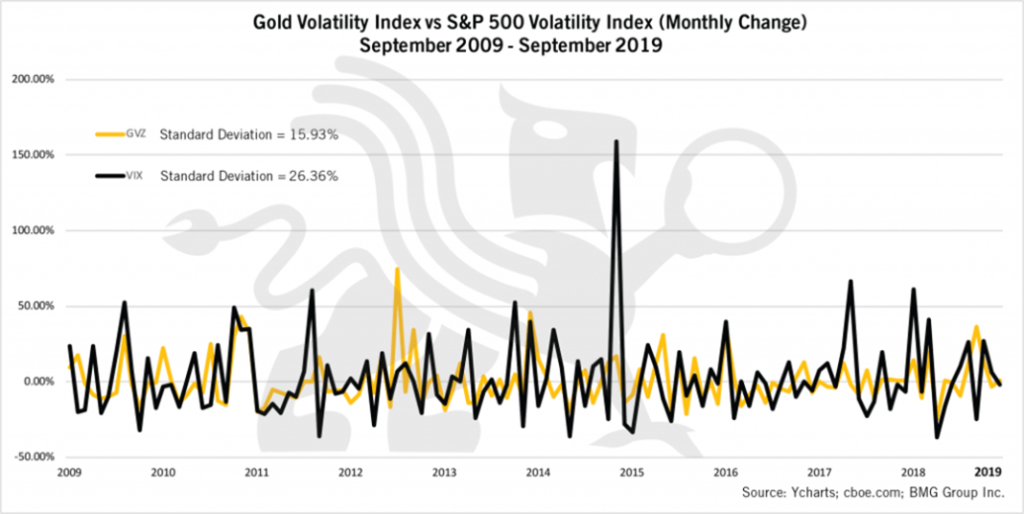
Is gold more volatile than stocks? Gold is considered a safe haven by some, while others view it as a highly speculative volatile commodity. Sometimes it depends on who you ask. The reality, however, is that gold’s volatility is not that significantly different than stocks. Our two measurements above show the ratio of the VIX Volatility Index (VIX) and the Volatility of the CBOE Gold Index (GVZ). The VIX Volatility Index is a measurement of the stock market’s expectation of volatility based on S&P 500 index options. The Volatility Index of the CBOE Gold Index is an estimate of the 30-day volatility of returns on the SPDR Gold Shares ETF (GLD) options. The result, as seen above, is that there is not a lot to choose between the two.
A Morningstar study showed that gold, over a period from 2001–2019, had high volatility of 21.52% with a maximum drawdown of 37%. Stocks, on the other hand, had only slightly less volatility at 19.66% but a higher maximum drawdown of 53.6%. Unsurprisingly, the same study showed emerging markets to be even more volatile, but surprisingly real estate was also higher. Another study from State Street Global Advisors showed gold’s volatility over a 30-year period to be 15.44%, not much higher than the S&P 500’s volatility of 14.32%.
Our chart above of the VIX Volatility Index/CBOE Gold Index Volatility VIX/GVZ showed that the ratio remained quite steady for the period from 2010 between 0.8 and 1.8. Stocks strayed above that level with higher volatility going into highs in 2015, 2018, and 2020. There was a lower high into the high of late 2021/early 2022. Gold’s spikes of volatility came on significant lows such as the crash that occurred in 2013 and the spike to major lows in 2015 and 2016.
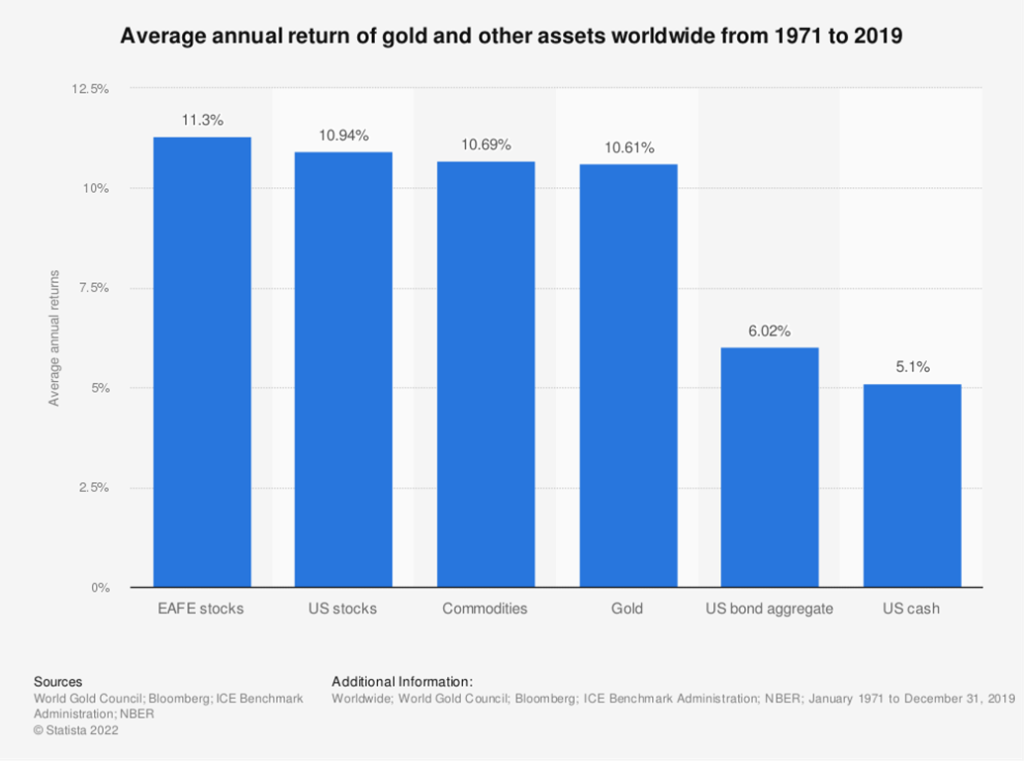
Gold is an asset class that has no liability, unlike stocks, bonds, and real estate. This a reminder that gold stocks are not gold. They are considerably more volatile and they have liability. Gold may not pay a dividend like stocks nor pay interest like bonds, but its long-term return is comparable. Since 1970, gold has returned 10.6% annualized since Richard Nixon took the world off the gold standard in August 1971 up until 2019. Stocks (total return) by comparison returned 10.94%, which is not that much higher.
According to the study below posted by BMG Group Inc. (www.bmg-group.com), the standard deviation for the GVZ was 15.93% while the VIX’s standard deviation was 26.36%. The period covers 2009–2019. Adding in the period from 2019 to 2022 shouldn’t change it that much.
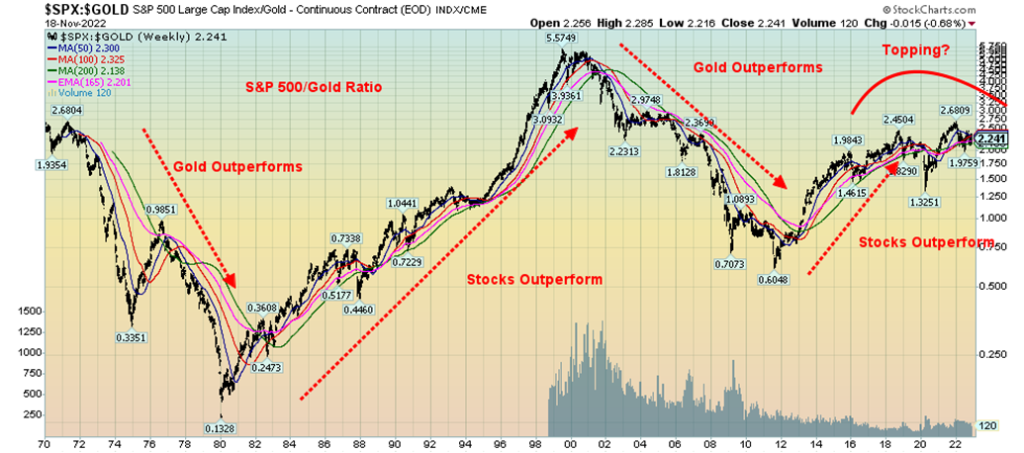
There is no argument that there are periods where one should hold gold over stocks and, vice versa, hold stocks over gold. That is best illustrated in the S&P 500/Gold Ratio, a different play on the traditional Dow Jones Industrials/Gold Ratio. But the result is the same.
The chart below is the S&P 500/Gold Ratio. Gold outperformed from 1970 to 1980, then stocks outperformed from 1980 to 2000. Gold once again shone from 2000 to 2011. From 2011 to the present stocks have outperformed, but the past four years from 2018 have seen the ratio flatten. However, gold was preferred over stocks during the March 2020 pandemic crash. What the ratio shows is that gold and stocks are for the most part non-correlated. The current ratio is 2.246%. If the S&P 500/Gold ratio were to fall to 0.1328 as it did in 1980, gold would be trading at $29,000, assuming the S&P 500 is constant.
It is noteworthy as well that during financial crises gold also outperforms. Gold rose during the 2008 financial crisis, Black Monday, October 19, 1987, the 2000–2002 high-tech/dot.com recession, during the Gulf War, the LTCM Asia/Russia crisis of 1998, the sub-prime mortgage crisis of 2007–2008, 9/11 in September 2001, and the trade wars of 2018.
Despite all of this, gold remains under-owned and underappreciated. The size of the gold market is estimated at $11.6 trillion while the U.S. stock market is estimated at $42.8 trillion. Globally, the stock market size is about $122 trillion. 61% of gold is held in the form of jewelry (53%) or is used in technology (8%). The remaining 39% is in investments (27%) and held by central banks (12%). If gold is so unimportant, why do central banks continue to hold gold, including having purchased a staggering 664 metric tonnes in 2022 up to Q3. That is 28% higher than in 2021 and is the highest annual purchase since 1967, during a period when the U.S. dollar was still backed by gold. Central banks have been responding to increased inflation and seeking safety during a year in which the bond market has performed poorly. The largest purchasers have been the central banks of Turkey, Uzbekistan, and India. Are central banks trying to tell us something? If central banks own gold, gold is hardly a barbarous relic as many call it. After all, gold has been around for at least 3000 years as both money and a currency.
S&P 500/Gold Ratio 1970–2022
A Barbarous Relic?
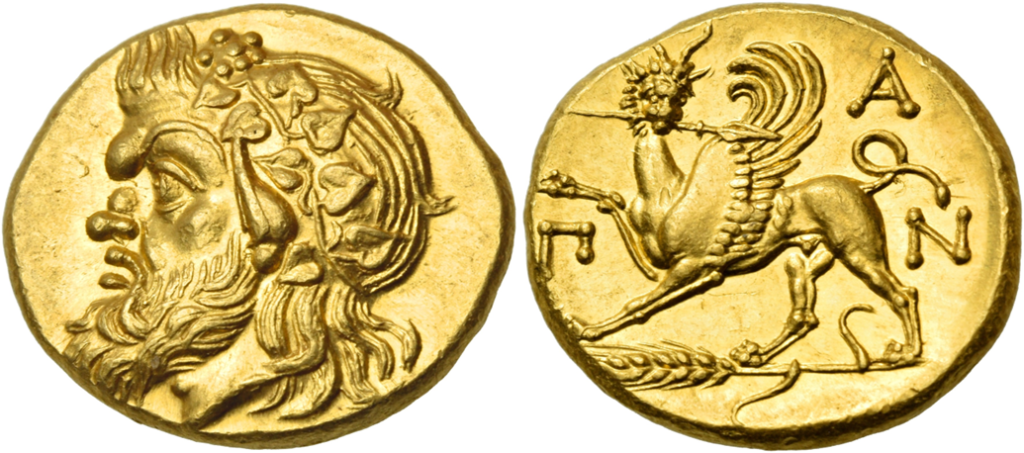
CIMMERIAN BOSPOROS. Pantikapaion. Circa 340-325 BC. Stater (Gold, 19.5 mm, 9.14 g, 11 h). Head of Pan to left, wearing a wreath of ivy. Rev. Π-Α-Ν Griffin standing on grain ear to leave, his head facing front, holding a spear in his mouth and with his right forepaw raised. Anokhin 1021. HGC 7, 20. Kraay & Hirmer 440. MacDonald 54. SNG BM Black Sea 867. Virtually as struck.
Lot 65: Nomos 25 – Closes November 20, 2022
Estimate: 75,000 CHF
Hammer: 90,000 CHF – US$94,000
Markets & Trends
| % Gains (Losses) Trends | ||||||||
| Close Dec 31/21 | Close Nov 18/22 | Week | YTD | Daily (Short Term) | Weekly (Intermediate) | Monthly (Long Term) | ||
| Stock Market Indices | ||||||||
| `S&P 500 | 4,766.18 | 3,965.34 | (0.7)% | (16.8)% | up | down (weak) | neutral | |
| Dow Jones Industrials | 36,333.30 | 33,745.69 | flat | (7.1)% | up | up (weak) | up | |
| Dow Jones Transport | 16,478.26 | 14,254.80 | (2.1)% | (13.5)% | up | neutral | up (weak) | |
| NASDAQ | 15,644.97 | 11,146.06 | (1.6)% | (28.8)% | up | down | down (weak) | |
| S&P/TSX Composite | 21,222.84 | 19,980.91 | (0.7)% | (5.9)% | up | neutral | upl | |
| S&P/TSX Venture (CDNX) | 939.18 | 575.88 | (4.0)% | (38.7)% | down | down | down | |
| S&P 600 | 1,401.71 | 1,218.14 | (1.1)% | (13.1)% | up | neutral | up (weak) | |
| MSCI World Index | 2,354.17 | 1,936.91 | 1.4% | (17.7)% | up | neutral | down | |
| Bitcoin | 47,907.71 | 16,682.03 (new lows) | (1.2)% | (65.2)% | down | down | down | |
| Gold Mining Stock Indices | ||||||||
| Gold Bugs Index (HUI) | 258.87 | 224.94 | 13.0% | (13.1)% | up | down (weak) | down | |
| TSX Gold Index (TGD) | 292.16 | 266.64 | 11.7% | (8.7)% | up | down (weak) | down | |
| % | ||||||||
| U.S. 10-Year Treasury Bond yield | 1.52% | 3.83% | flat | 152.0% | ||||
| Cdn. 10-Year Bond CGB yield | 1.43% | 3.13% | (0.6)% | 118.9% | ||||
| Recession Watch Spreads | ||||||||
| U.S. 2-year 10-year Treasury spread | 0.79% | (0.70)% (new lows) | (37.3)% | (188.6)% | ||||
| Cdn 2-year 10-year CGB spread | 0.48% | (0.85% (new lows) | (25.0)% | (277.1)% | ||||
| Currencies | ||||||||
| US$ Index | 95.59 | 106.83 | 0.6% | 11.8% | down | neutral | up | |
| Canadian $ | .7905 | 0.7473 | (1.0)% | (5.5)% | up | down | down | |
| Euro | 113.74 | 103.25 | (0.3)% | (9.2)% | up | down (weak) | down | |
| Swiss Franc | 109.77 | 104.77 | (1.4)% | (4.6)% | up | up (weak) | down | |
| British Pound | 135.45 | 118.82 | 0.4% | (12.3)% | up | down (weak) | down | |
| Japanese Yen | 86.85 | 71.23 | (1.3)% | (18.0)% | up | down | down | |
| Precious Metals | ||||||||
| Gold | 1,828.60 | 1,754.40 | (0.9)% | (4.1)% | up | down (weak) | neutral | |
| Silver | 23.35 | 21.00 | (3.1)% | (10.1)% | up | neutral | neutral | |
| Platinum | 966.20 | 984.30 | (5.2)% | 1.8% | up | up | up (weak) | |
| Base Metals | ||||||||
| Palladium | 1,912.10 | 1,938.90 | (4.3)% | 1.4% | down (weak) | down | neutral | |
| Copper | 4.46 | 3.63 | (7.3)% | (18.7)% | up | down (weak) | neutral | |
| Energy | ||||||||
| WTI Oil | 75.21 | 80.11 | (10.0)% | 6.5% | down | down | up | |
| Nat Gas | 3.73 | 6.30 | 7.2% | 69.0% | neutral | down (weak) | up | |
New highs/lows refer to new 52-week highs/lows and, in some cases, all-time highs.
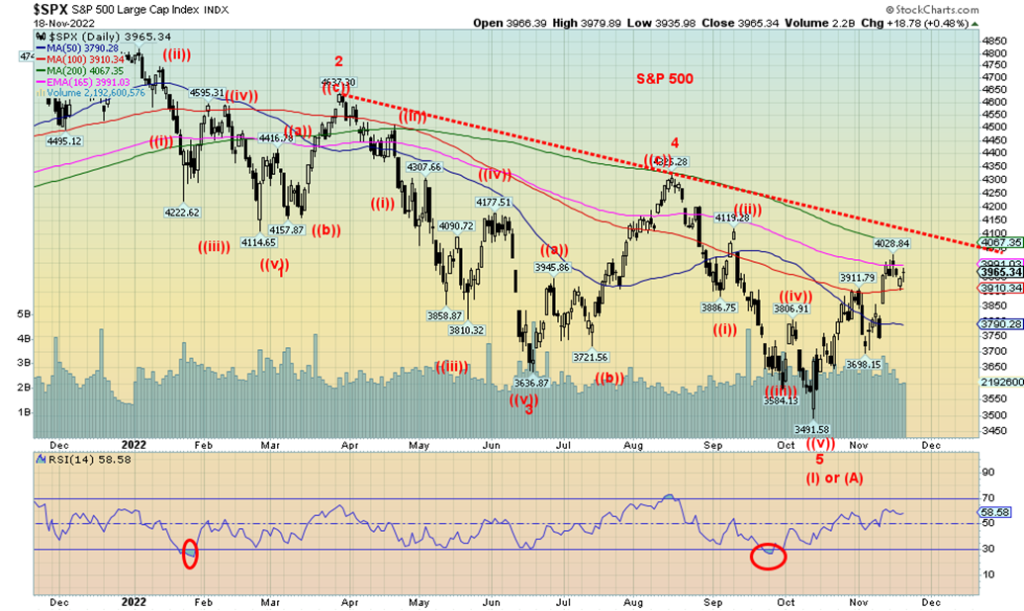
Following a nice run to the upside, stock markets faltered this past week, raising the possibility that this run may be over. We don’t believe so because we are headed into a bullish period. November may be a good month for stocks (second best), but Thanksgiving is rather mixed, although it definitely leans more towards bullish than bearish. And then it’s December and the traditional Santa Claus rally, followed by the January effect. Midterm elections are also good for stocks and this year’s midterms delivered gridlock, which is usually good for the stock market. At this point, we are viewing the pullback this past week as temporary.
The S&P 500 fell 0.7% this past week. The Dow Jones Industrials (DJI) was flat, the Dow Jones Transportations (DJT) was down 2.1%, while the NASDAQ lost 1.6%. The S&P 400 Midcap lost 0.9% while the S&P 600 small cap was down 1.1%. Elsewhere, the MSCI World Index was a winner, up 1.4%. In the EU, the London FTSE gained 1.1%, the Paris CAC 40 was up 0.8%, and the German DAX up 1.5%. Seems they are easing fears over there about the Russia/Ukraine war, despite high energy costs. The UK is falling into recession and they are planning on hiking taxes and cutting spending, which is not expected to make things better.
In Asia, China’s Shanghai Index (SSEC) was up 0.3% while the Tokyo Nikkei Dow (TKN) was a loser, down 1.3%. In Canada, the TSX Composite fell 0.7% while the TSX Venture Exchange (CDNX) was the weakest, down 4.0%. Bitcoin continued its downward journey making fresh 52-week lows, down 1.2%, while the crypto world continues to unravel.
The S&P 500 may have run into a wall. It is just shy of its downtrend line from the January high and the 200-day MA is currently at 4,067. It would take a move over 4,100 to suggest to us that we are breaking out and poised to move higher.
November may be a positive month for stocks, but we have seen highs here before. November 22 is the one-year anniversary of the NASDAQ’s all-time high; in 2018 the indices rallied into early December, then collapsed into Christmas; in 2015 it was the same, a quick rally into early December, then a collapse into January; and in 2002 the markets again rallied into early December, then plunged some 18% into March 2003. So, we shouldn’t be complacent about the rebound that has occurred this month. And we are at points of resistance that may prove difficult to get through. Markets tend to be a bit bullish after Thanksgiving but can turn around in December and pull back. We’ve never had any expectations of the market going straight up here. The pressure is still on for rate hikes and we are seeing some signs of a slowing economy. If markets hold together through December without a big fall, then a Santa Claus rally might carry us into early January.
But we do seem to be at a bit of crossroads here, given we are at or near downtrend lines and the 200-day MA that often acts as both bull support and bear resistance. So, while we’ve enjoyed a decent November, we are now more cautious going forward to see how it shakes out after Thanksgiving next Thursday. Markets are closed for Thanksgiving and the weekend usually turns into a long weekend with light trading after Thanksgiving on Friday, which is also Black Friday. Most markets close early that day. Support is seen at 3,900, but under that level a decline to 3,800 is likely to follow.
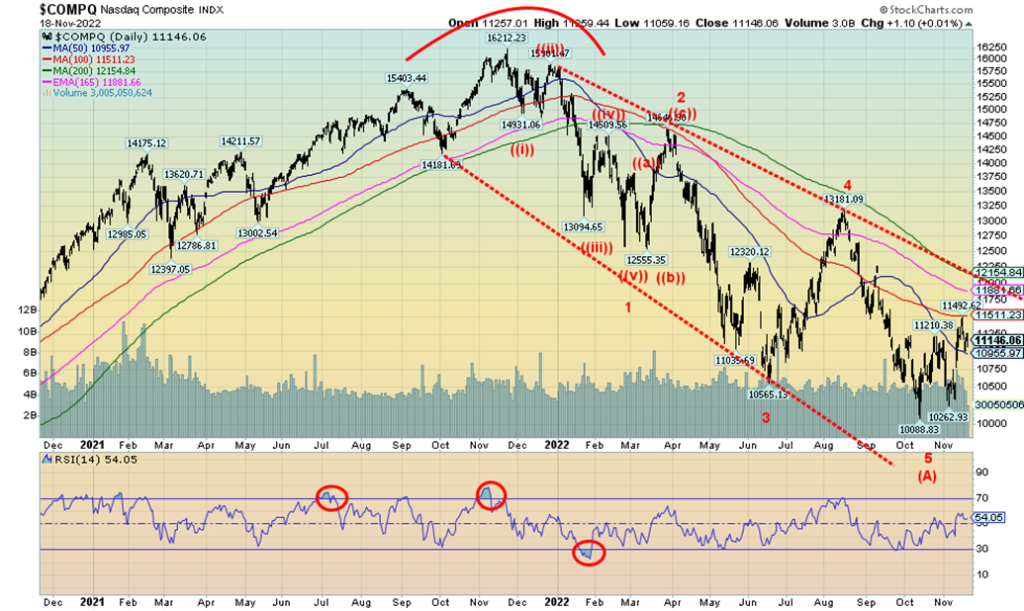
The NASDAQ continues to be just about the weakest of the major indices as it lost 1.6% this past week and remains down 28.8% in 2022. The NY FANG Index actually held in this past week, losing only 0.3%. Perhaps it is the Chinese stocks that saved the day as Baidu was up 7.2% and Alibaba up 13.7%. That Biden and Xi were talking seemed to ease some concerns there. The big loser on the week was Amazon, which is in the process of shedding some 10,000 jobs. It was down 6.6%. However, Elon Musk’s destruction of Twitter is impacting Tesla, as it fell 8.0% this past week. Tesla’s rising inventories aren’t helping, either. With Twitter coming apart at the seams and Tesla falling, maybe Mr. Musk will not be the world’s richest man for much longer.
The NASDAQ is struggling to break higher. It is still well away from that downtrend line and 200-day MA near 12,150. It is currently resting on support near 11,000, but it must break up through 11,500 if it is to challenge over 12,000. Under 10,400 and the NASDAQ is probably headed for new lows.
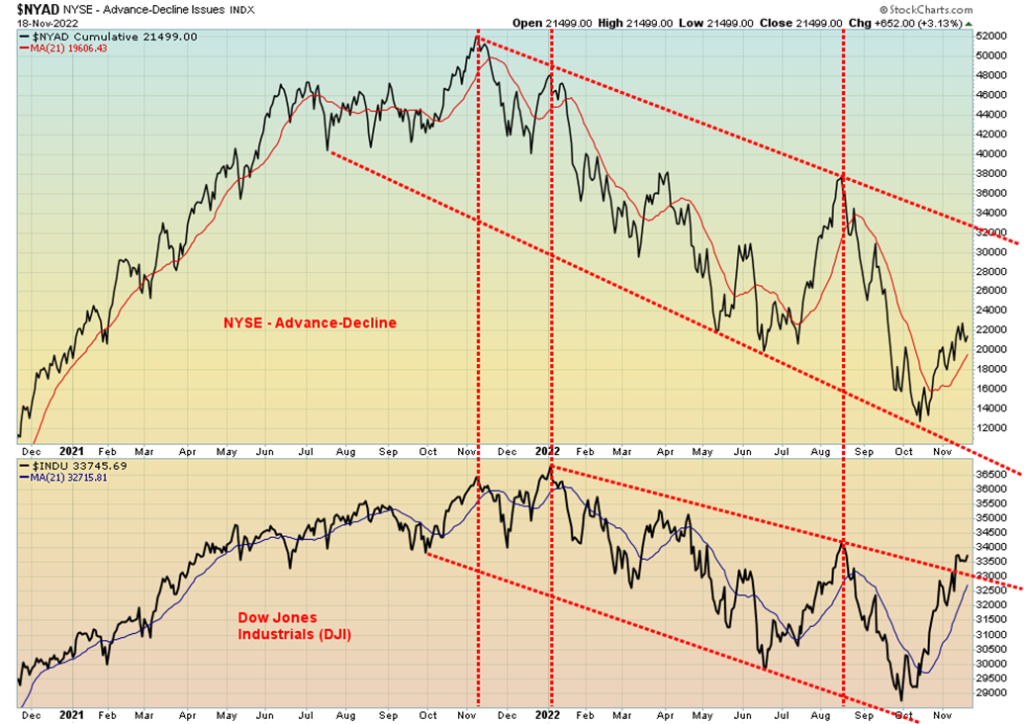
The Dow Jones Industrials (DJI) is the only index thus far that broke its downtrend line and is close to breaking above its August high. But the NYSE advance-decline (AD) line isn’t keeping up. Grant you, the AD line is on a broader range of stocks than the narrow blue-chip focus of the DJI. That the DJI is exhibiting relative strength vis-à-vis the broader indices suggests to us that there is some flight to safety going on and the DJI stocks are being viewed as the safest. Interestingly, the NYSE Index is not that far off its August high. The furthest from that August high is the NASDAQ. The NASDAQ contains the FAANGs and other high-tech stocks that have been leading the market down. Both Mid S&P 400 and small cap S&P 600 are exhibiting relative strength vis-à-vis the AD line. 55% of S&P 500 stocks are now trading above the 200-day MA but only 32% of NASDAQ stocks are above that level. Almost 72% of NYSE stocks are above their 50-day MA. The S&P 500 Bullish Percent Index BPSPX is at 72%, which is getting high but not in extreme territory yet. Put/call ratios are a rather neutral 60%. But there has been almost record put and call buying over the past few months as volumes have soared in the options pits.
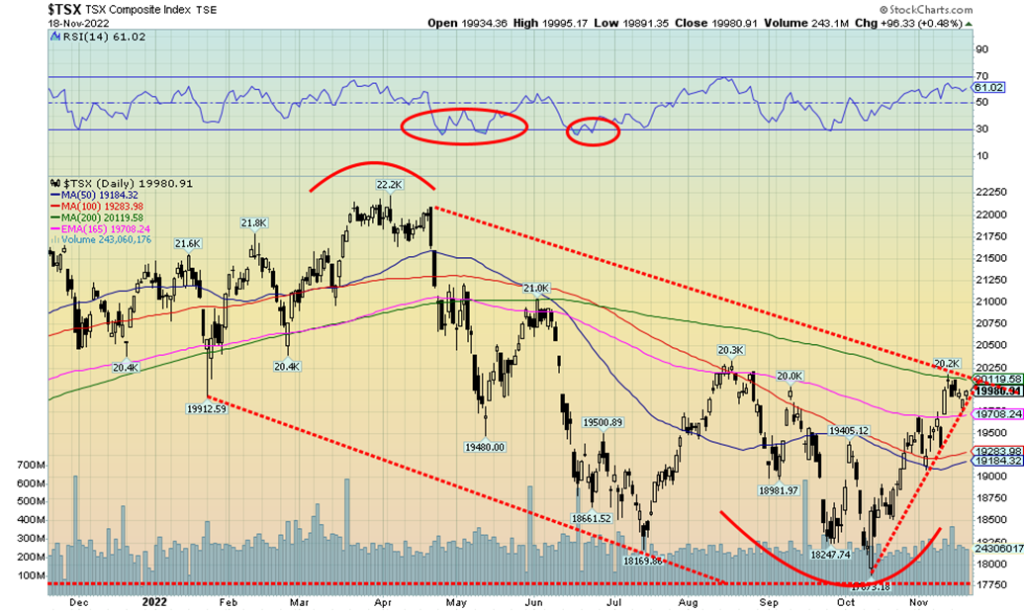
The TSX Composite hit the 200-day MA this past week and promptly fell back. It was probably expected. A firm breakout over 20,250 and especially over 20,500 would be more bullish. On the week the TSX was down 0.7%. The TSX Venture Exchange (CDNX) continues to struggle, losing 4% this past week. The CDNX was the weakest of the indices we follow regularly. Ten of the fourteen sub-indices were down on the week, led by Health Care (THC), off 4.3%. Other significant losers were Energy (TEN) down 2.8%, Golds (TGD) off 2.4%, Real Estate (TRE) down 2.7%, Information Technology (TKK) down 2.9%, Utilities (TUT) off 2.4%, and Materials (TMT) off 2.3%. Leading the winners was Industrials (TIN), up 2.0%. Consumer Discretionary (TCD) gained 1.9% and Consumer Staples (TCS) was up 1.7% while Telecommunications (TTS) gained 1.7% as well. The TSX is clinging to a support line. A break now of 19,900 would send the TSX down towards support near 19,700 and even down to 19,200. If we are going to get through the 200-day MA it may take some consolidation under that level before another good attempt is made. We do see resistance above that level at 21,000, but if we could get through there, we’d be looking at the March highs near 22,200. Consumer Staples has the best upside momentum and relative strength while Energy, which previously was the leader, still looks a bit toppy. Golds and Metals still appear to be trying to bottom here. Both are worth a look. Health Care, which has been a disaster all year, is so overdone to the downside that there might be some worth looking at.
10-year Treasury Bond/Canadian 10-year Government Bond (CGB)
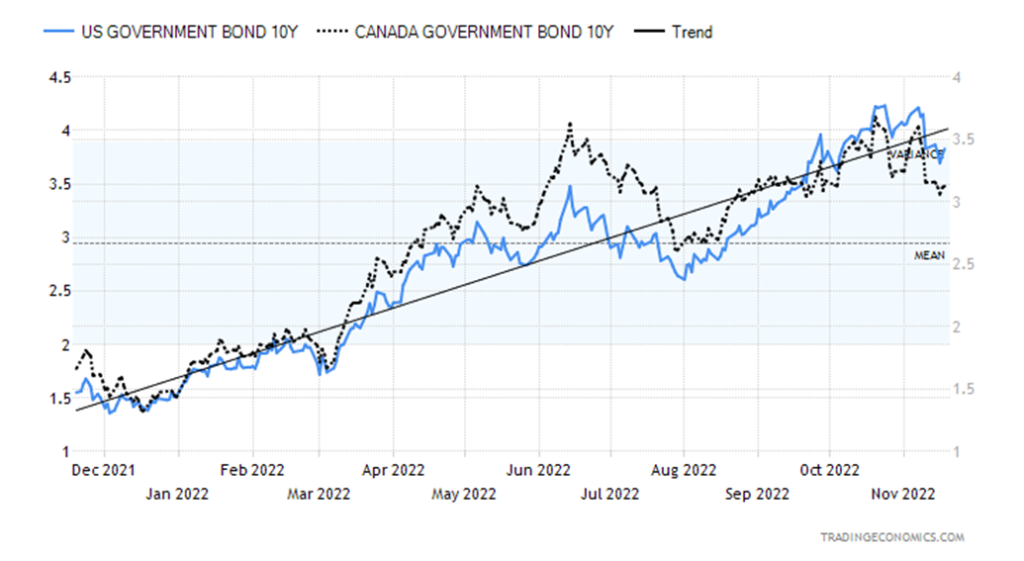
Bonds were fairly flat this past week despite a raft of numbers, with some pointing to a weakening economy and inflation coming in a bit below expectations. It is also still widely expected that the Fed will hike at least 50 bp at the FOMC on December 13–14. The U.S. 10-year treasury note was flat while the Canadian 10-year Government of Canada bond (CGB) was off 2 bp or 0.6%. However, the spreads widened with the U.S. 2–10 spread jumping to negative 70 bp from negative 51 bp and the Canadian 2–10 spread up to negative 85 bp from negative 68 bp. Both are lows for the year.
The October Producer Price Index (PPI) came in at 0.2% and year-over-year (y-o-y) it was up 8% vs. an expected 8.2%. The core for October was flat and y-o-y it was 6.7%, again below expectations of 7.1%. Retail sales for October were up 1.3%, well above the expected 0.5% gain. Y-o-y they were up 8.3%, again above expectations of 6.9%. Retail sales reflect both inflation and population growth. Industrial production for October was negative 0.1% and y-o-y it was 3.3%, below the expected 5.1%. Housing starts for October fell 4.2% when a decline of 2.7% was expected. The Philly Fed was negative 19.4, well below the expected negative 8.0. Existing home sales fell 5.9% in October, but that was better than the expected decline of 8%. During the week Fed officials speaking kept everyone on edge as to what might come next. The wide expectation is that the Fed hasn’t hiked rates enough to bring the economy to a lower level and thus lower the inflation sufficiently towards the Fed’s 2% goal.
The 10-year has been slowly falling with the next level of support near 3.60%. Below 3.40% we might expect even further declines. Regaining 4% would be negative and potentially suggest new highs.
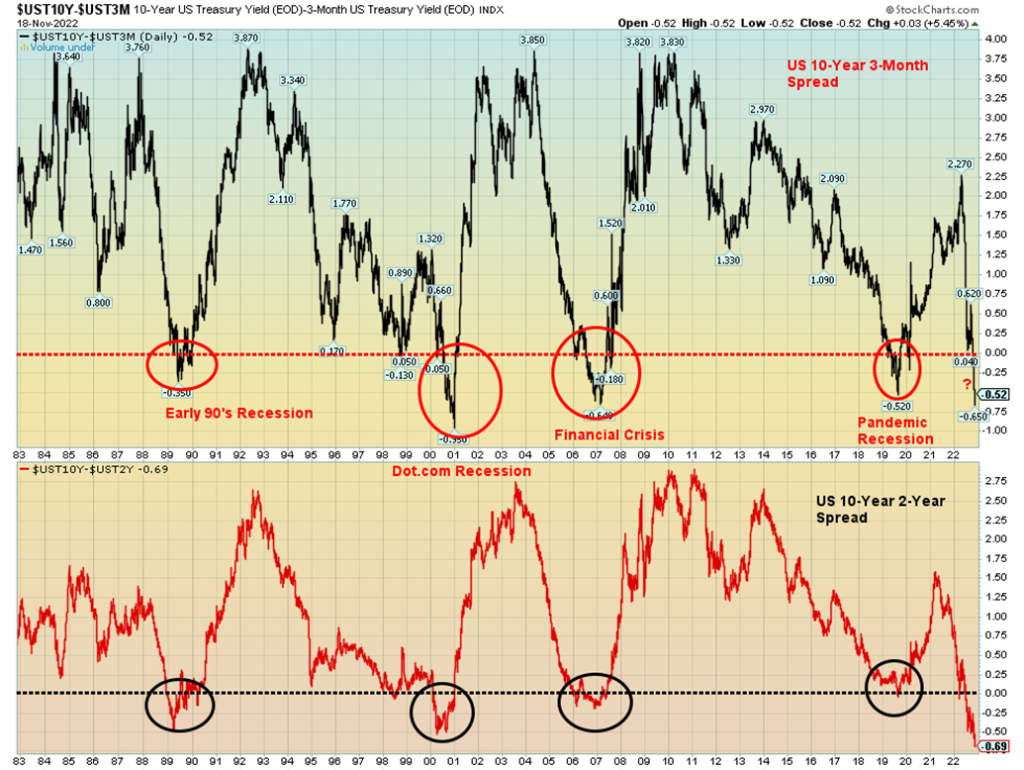
The yield spreads are as wide as we’ve ever seen them. Or at least as wide as has been seen over the past 40 years. The closely watched 2–10 spread is the widest seen, while the 3 mth–10 spread is wider than at any time since 2001 during the dot.com crash and 9/11. Trying to interpret what it means in terms of a coming recession is difficult. Is it pointing to a severe deep recession? Despite the steepness seen with the yield curve during the dot.com, 9/11 recession, that recession wasn’t particularly deep compared to the Great Recession of 2007–2009 or the short-lived but steep pandemic recession of 2020. The one thing for sure is we are headed for a recession, but officially we could still be up to six months away. The yield curve usually starts to normalize and even turn positive as the recession bears down. That’s usually because the bond market anticipates that the monetary authorities could start cutting interest rates. But this time is a little different in that it is driven by inflation that still shows few signs of abating substantially. Short rates are still not above the rate of inflation. A condition that is usually required to bring inflation down. But the widening spreads are indicating that potentially there remain more rate hikes to come. The FOMC on December 13–14 is still expected to see at least a 50 bp hike. Regardless of this, many are expecting it to also be the last one. But will it?
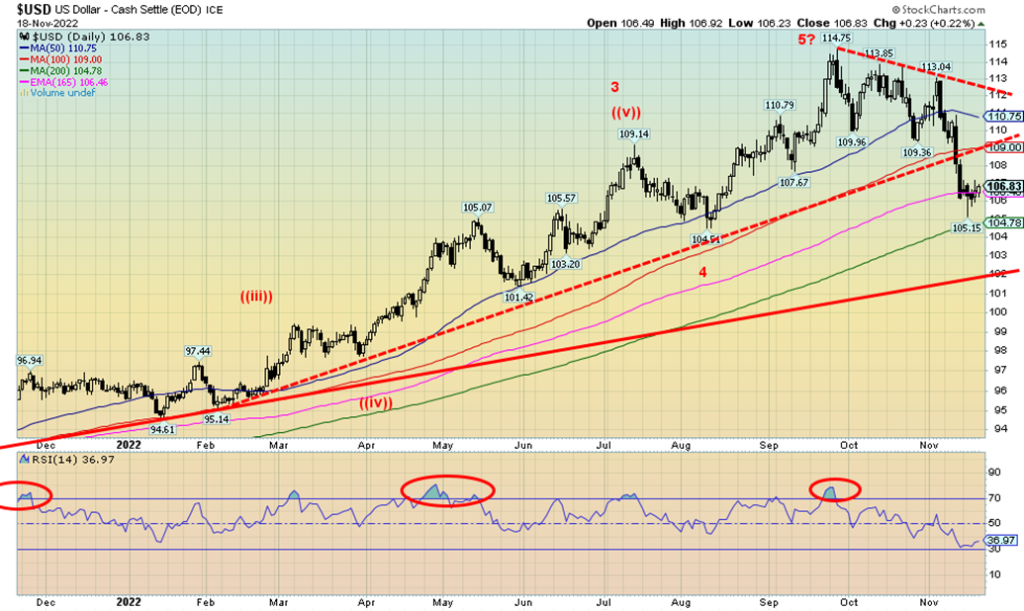
The US$ Index broke down, hitting our next good support zone near 106. So far, that appears to be holding. Given some oversold conditions, a bounce might be expected. This past week the US$ Index gained 0.6%, the euro fell 0.3%, the Swiss franc was off 1.4%, but the pound sterling rebounded about 0.4%. The Japanese yen fell 1.3% while the Canadian dollar was down 1.0%, thanks to falling oil prices. Somewhat lower-than-expected inflation plus weaker housing numbers helped push the US$ Index lower, but comments about interest rates and inflation from Fed officials helped prop the US$ Index back up again. Resistance now appears up to 109, but above that, we see further resistance up to 111. The recent low was 105.15 and if that breaks again, we could go through 105 down towards 102 where the US$ Index could find major support. Also helping the US$ Index this past week was the missile that hit Poland, which may change the dynamics in the Russian/Ukraine war.
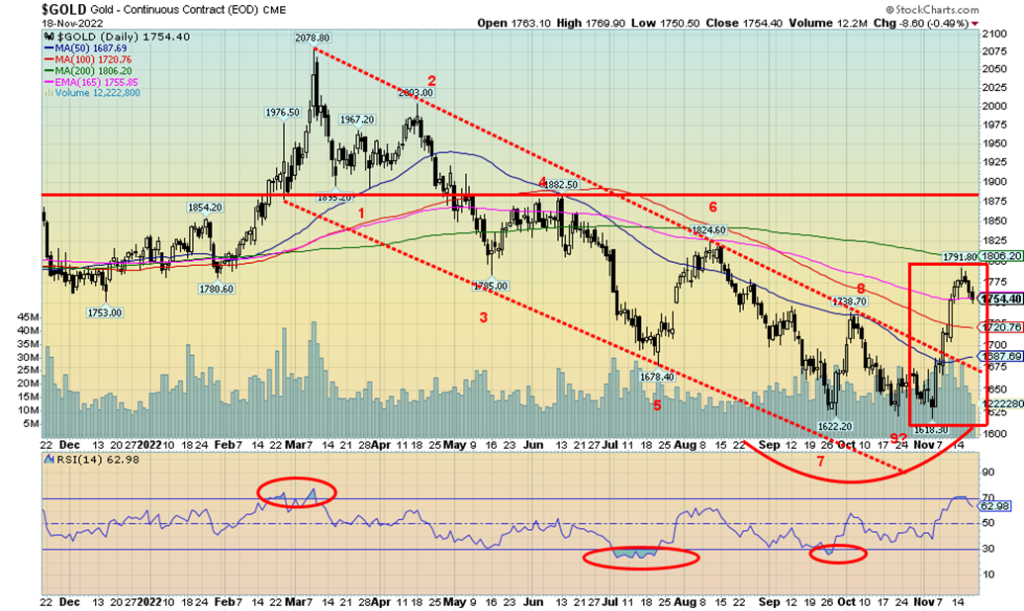
Following a swift 10.6% gain from the November 3 low at $1,618, gold stalled just under $1,800 (high was $1,792) and fell 0.9% this past week. Silver fared worse, off 3.1%. Platinum was down 5.2% while the near precious metals also fell, with palladium off 4.3% and copper down 7.3%. The gold stocks fell with the Gold Bugs Index (HUI) down 3.3% and the TSX Gold Index (TGD) off 2.4%. All except for platinum and palladium are down on the year. And those two are barely up under 2%. Gold has considerable resistance to overcome from $1,800 to $1,850. Even more important would be getting over $1,875. Above that level $1,900 becomes clearer. But with the drop this past week we need to focus on the downside just in case we fall further. Support is here at $1,750 and down to $1,720. Under that level, the next stop could be a decline to $1,675. Under $1,660 new lows are probable. We continue to form what we believe is a bottoming pattern, but we can’t rule out one more plunge to the downside into the December 13–14 FOMC. Important lows have taken place before in December, the most noteworthy being low in 2015 at $1,045 which still remains as the cycle low since 2008. We continue to note we are in the period for our important 7.83-year cycle low and the 23.5-year cycle low. But the range is 2022 to 2025 so we shouldn’t get too complacent just yet. Some continue to believe that gold could fall to $1,500 or lower before this cycle is complete. Other December lows of note were seen in 2016. So, a decline into December wouldn’t surprise us. After that, a much better rebound should get underway.
Gold is still worried about inflation and Fed rate hikes. A 50-bp hike is now widely expected for the December 13–14 FOMC. Rome wasn’t built in a day and a major gold rally is not being built in a day either. Throwing cold water on the gold bugs helps keep the focus on the real reasons gold might rise. The U.S. election results didn’t help either, as gridlock also keeps gold gridlocked. As well, WWIII didn’t happen following the missile that hit Poland, so that’s another sign that gold’s rise remains premature, at least for the moment.
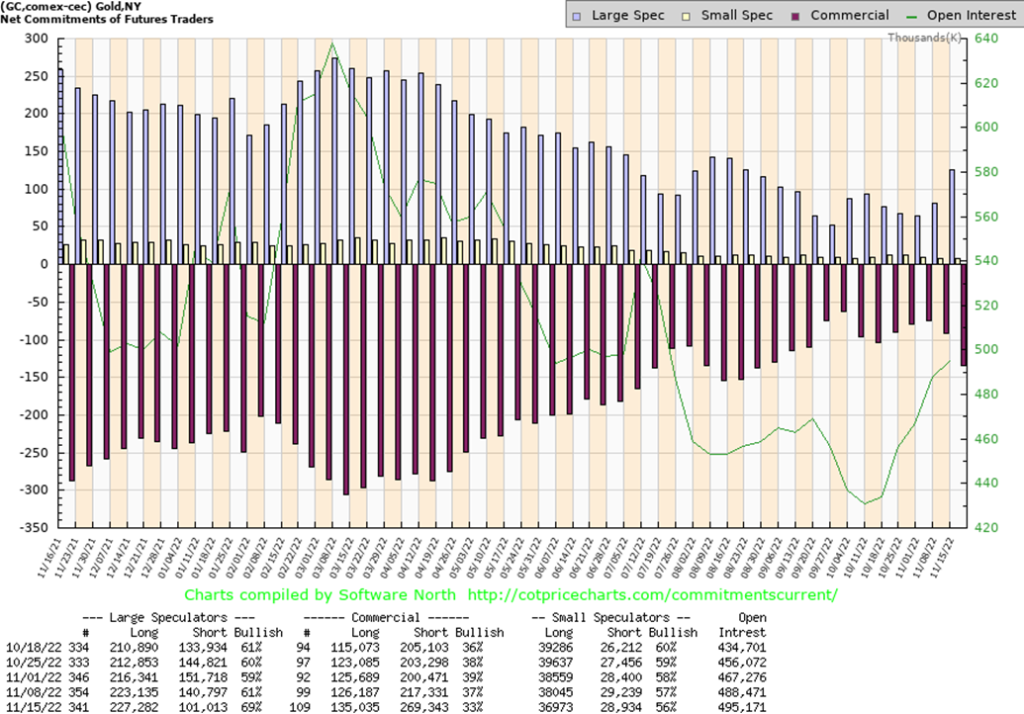
The gold commercial COT (bullion companies and banks) fell this past week to 33% from 37%. It shouldn’t have been unexpected as gold prices gained quickly following that low at $1,618. The gain was over 10% in a matter of days. Despite the drop in the commercial COT, long open-interest rose almost 9,000 contracts but short-open interest jumped more up roughly 52,000 contracts. That was dramatic. The large speculators COT (hedge funds, managed futures, etc.) leaped to 69% from 61% as they added about 4,000 longs but shed over 39,000 shorts. Short covering? Overall, open interest was up about 7,000 contracts. The gold COT is still somewhat bullish but weakened. A breakdown under 30% would be of bigger concern for the bulls.
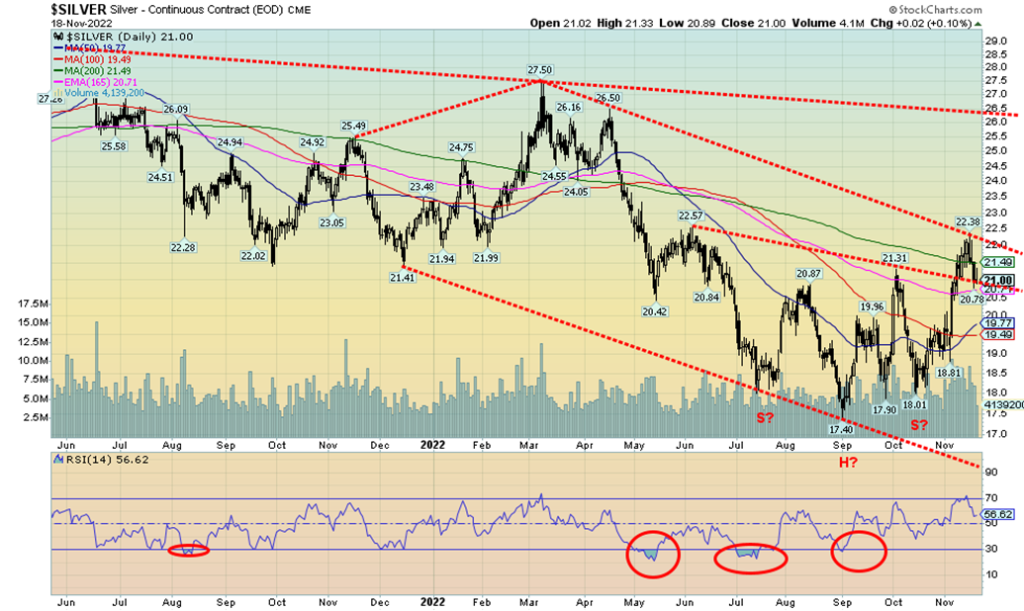
Following a swift 24% rise for silver prices, it is not surprising to see a bit of profit-taking going on. Volatility in silver prices has picked up and, as we noted with gold, we wouldn’t be surprised to revisit the lows with another key low to take place in December, around the time of the FOMC on December 13–14. It looks like a potential head and shoulders bottom, but the volume on the breakout wasn’t overly impressive. Currently, we are at support but there is better support down to $19.50. Silver has struggled to take out $22 and now it is threatening to dip back under $21. There may be shortages of silver and silver coins are trading at fat premiums to spot, but that doesn’t mean prices will just shoot up. The key area to hold is around $18.50. If that were to break, there is a good possibility we’ll see new lows below $17.40. The possible head and shoulders breaks down under $18. Silver tried to break above the 200-day MA, currently at $21.50, but it failed to hold. We need to regain that level as a minimum to suggest higher prices. Higher prices are coming, but we remain in a period that could still see significant lows.
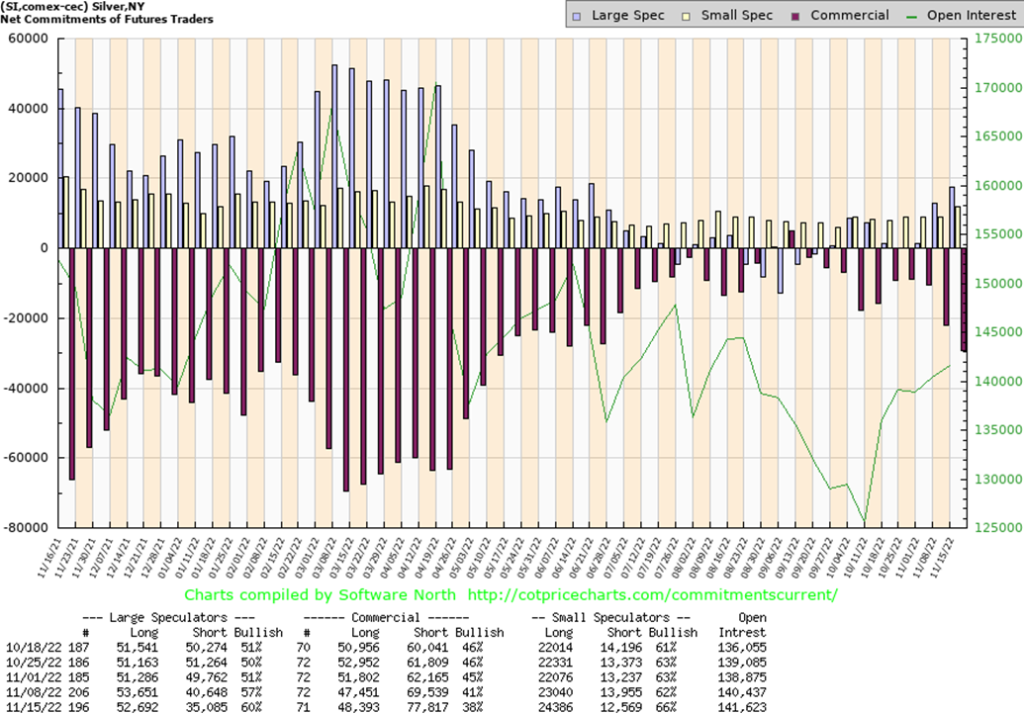
As with the gold commercial COT, the silver commercial COT fell this past week to 38% from 41%. Longs were actually up roughly 1,000 contracts, but shorts rose by over 6,000 contracts. Overall, open interest rose by about 1,000 contracts. The large speculators COT rose to 60% from 57% as they shed about 1,000 longs but shed even more shorts, off 5,500 contracts. The drop is only mildly negative at this stage. Following the good up move we’ve had, it is not surprising to experience a bit of weakening in the COT. We would be a bit concerned if we fall under 35% and even more cautious if we were to fall under 30%.
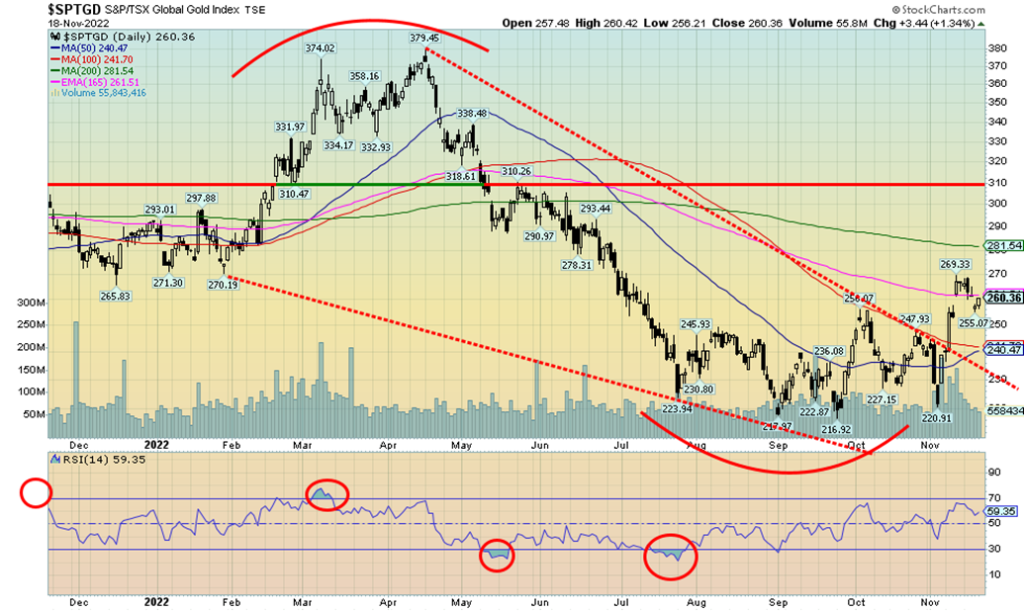
The TSX Gold Index (TGD) broke out of a bottom pattern, but has now stalled at the 165-day EMA (currently 261.51). With both gold and silver down this past week, the TGD dropped 2.4%. The Gold Bugs Index (HUI) fared worse, losing 3.3%. The TGD is filling a small gap left from November 10, but we could fall further to better support near 240. Further support is seen down to 230. Only under 230 could we see new lows below the last low of 221 and even the September low of 217. Initially the TGD jumped quickly, gaining almost 22% in a manner of days. However, swift up moves followed by down moves are not unusual. As long as we hold above 230, we should be okay. The Gold Miners Bullish Percent Index (BPGDM) is only at 41.4, so we are nowhere near overbought. That suggests that we could just consolidate here before moving higher once again. There is resistance up to 280 then up to 310. Above 310 we would break out further and could then challenge the March 2022 high of 379. Above 340 new highs should be seen. What’s key now is to hold above 230 on any pullback.
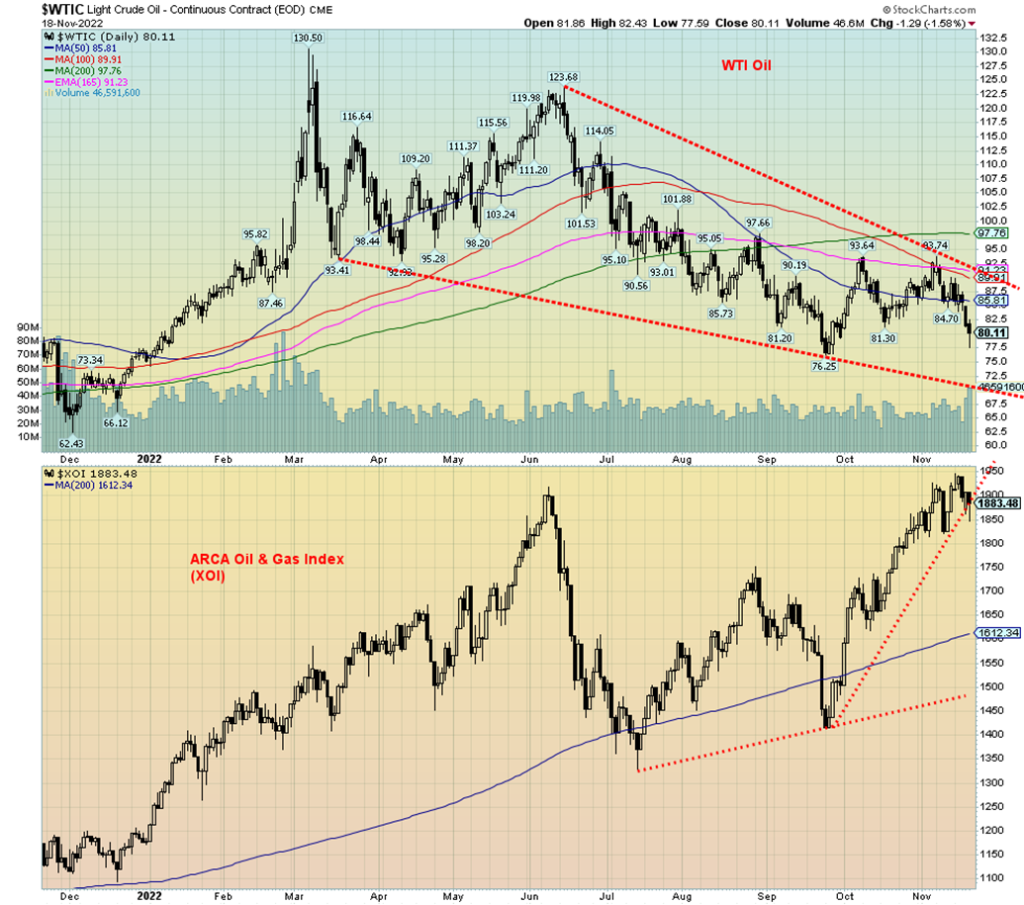
There was some expectation that oil prices were going to move higher once they broke above $90. Instead, WTI oil did not hold above $90 and we appear poised to break back under $80. So, what happened? Well, it’s China, of course. They told the Saudis to ship less oil in December. Seems that the after-shocks of their extreme lockdowns are still kicking in. China is the second-largest consumer of oil behind the U.S. China consumes an estimated 11.8 million bpd. That’s still well behind the U.S. who consumes some 19.7 million bpd. Oil prices could fall to the bottom of the bear channel currently near $69. What might be a double top on the charts also projects to $69.
WTI oil fell 10% this past week, one of the steepest drops since oil topped back in June. Brent was down 8.7%. Natural gas (NG) fared much better, rising 7.2% to $6.30 while EU NG at the Dutch Hub leaped 18%. The mixed energy market saw the ARCA Oil & Gas Index (XOI) fall 1.9% while the TSX Energy Index (TEN) dropped 2.8%. Oil still dominates the companies.
That it was China that dominated the price action this past week was odd to say the least, considering there was at least a brief threat that we might enter WWIII after that missile fell in Poland and there was a drone attack on an oil tanker in the Middle East. Slowing inflation was also a boost on thoughts that demand might perk up as a result. However, China’s extreme lockdowns won out, despite growing protests in the country against the lockdowns. Another factor, albeit a lesser one, was the failure of COP27, the U.S. climate summit in Egypt. Calls to cut back on use of fossil fuels continue to fall on deaf ears, even as it is now being freely admitted holding the world to a 1.5° rise is merely a fantasy of climate activists. Given increasing global droughts, wildfires, fierce hurricanes, and flooding, all one can do is follow the old Boy Scout motto: be prepared. It’s noteworthy that almost the entire U.S. West and South is under drought conditions, with the worst being seen in major growing belts like California.
Strategic supplies of oil have improved in the U.S., but there remains a serious shortage of diesel fuel as gasoline stocks continue to deteriorate. The reality is that with WTI oil knocking on $80, the odds favor further declines this coming week. The one piece of good news is that, despite the fall, we are moving into the best period for oil, gas, and energy stocks. We just have to find the current low which, as noted, could see WTI oil fall to $69.
__
(Featured image by geralt via Pixabay)
This article may include forward-looking statements. These forward-looking statements generally are identified by the words “believe,” “project,” “estimate,” “become,” “plan,” “will,” and similar expressions. These forward-looking statements involve known and unknown risks as well as uncertainties, including those discussed in the following cautionary statements and elsewhere in this article and on this site. Although the Company may believe that its expectations are based on reasonable assumptions, the actual results that the Company may achieve may differ materially from any forward-looking statements, which reflect the opinions of the management of the Company only as of the date hereof. Additionally, please make sure to read these important disclosures.
Copyright David Chapman, 2022
David Chapman is not a registered advisory service and is not an exempt market dealer (EMD) nor a licensed financial advisor. He does not and cannot give individualised market advice. David Chapman has worked in the financial industry for over 40 years including large financial corporations, banks, and investment dealers. The information in this newsletter is intended only for informational and educational purposes. It should not be construed as an offer, a solicitation of an offer or sale of any security. Every effort is made to provide accurate and complete information. However, we cannot guarantee that there will be no errors. We make no claims, promises or guarantees about the accuracy, completeness, or adequacy of the contents of this commentary and expressly disclaim liability for errors and omissions in the contents of this commentary. David Chapman will always use his best efforts to ensure the accuracy and timeliness of all information. The reader assumes all risk when trading in securities and David Chapman advises consulting a licensed professional financial advisor or portfolio manager such as Enriched Investing Incorporated before proceeding with any trade or idea presented in this newsletter. David Chapman may own shares in companies mentioned in this newsletter. Before making an investment, prospective investors should review each security’s offering documents which summarize the objectives, fees, expenses and associated risks. David Chapman shares his ideas and opinions for informational and educational purposes only and expects the reader to perform due diligence before considering a position in any security. That includes consulting with your own licensed professional financial advisor such as Enriched Investing Incorporated. Performance is not guaranteed, values change frequently, and past performance may not be repeated.


Ecobnb Turns Sustainable Tourism Into Measurable Impact
Ecobnb’s sustainable tourism platform generated significant environmental and social impact in 2025, avoiding 58,207 kg of CO₂ and adding 583...


Sugar Markets Balance Biofuel Demand and Global Supply
Sugar markets in New York and London were mostly unchanged as the Iran conflict renewed interest in biofuels. Drought concerns...


The $40 Trillion Trap: Disinflation Is Not Deliverance
U.S. debt has reached $40 trillion, with $24 billion weekly interest, while deficits accelerate. Despite disinflation in CPI, from cooling...


FinTech Matures as AI and Infrastructure Drive the Next Growth Phase
Fintech markets are entering a mature phase, shifting from rapid growth to consolidation, specialization, and sustainable business models. Zurich and...


Bitcoin, and Ethereum Rise, While Cardano Enters Transition
Bitcoin and Ethereum posted modest weekend gains, supported by ETF inflows. A new proposal may protect Bitcoin from quantum threats....
 |
|
 |  |
 |
|
-
 Fintech1 week ago
Withings Achieves Profitability in 2025 with 90% Growth Since 2018
-

 Biotech2 weeks ago
Circulating Tumor DNA Guides Chemotherapy Decisions in Colorectal Liver Metastases
-

 Biotech6 days ago
Emily.AI: Personalized Oxygen Therapy Earns Global AI Recognition
-

 Fintech2 weeks ago
Revolut Updates Crypto Rules for Deposits and System Errors