Markets
Markets Waver as Gold Shines, Fed Holds, and Global Tensions Rise
Stocks rebounded slightly, while gold hit new highs before pulling back. The Fed held rates but eased quantitative tightening. Inflation remains high, and signs of stagflation are emerging. Market turmoil favors gold, while U.S. political instability raises concerns. Oil prices edged up amid global conflicts. Key economic indicators this week include GDP, PCE prices, and consumer confidence.
It was no surprise to many that the Fed left rates unchanged at the FOMC meetings of March 18–19. This had been widely expected. Ongoing chaos from Trump’s tariff wars, the scatter gun approach of Elon Musk’s DOGE in removing federal workers, plus unknown future chaos, including threats to annex Greenland, the Panama Canal, and Canada has everyone jittery. Markets chaos and uncertainty have become the calling cards of the Trump administration. And as well, we’re now facing the possibility of a constitutional crisis with threats to impeach judges whose decisions the Trump administration disagrees with.
The U.S. system has three pillars; four, actually. They are the executive (the White House administration led by Trump), the legislative (Congress and Senate), and the judiciary. The fourth pillar is the media. All are governed by segregation of powers to act as checks and balances. The legislative has been largely neutered as Republicans control both Congress and the Senate, the judiciary is under attack and threatened, and the media is also under attack—at least, the media that regularly criticizes the executive and the legislative.
Attacks on the judiciary could result in a constitutional crisis. Federal judges have ruled that the Trump administration has flouted the law more than a dozen times. The Trump administration, instead of taking the cases to next level and eventually the Supreme Court, is challenging the judges’ decisions and threatening them with impeachment or just ignoring the rulings. Rule of law? Instead, chaos and volatility.
The Fed is caught between a rock and hard place—damned if they do, and damned if they don’t. The Fed is independent, responsible for mainly monetary policy. Also, they are responsible for promoting financial stability, supervising financial institutions, ensuring an efficient and stable payments system, and providing consumer protection. Trump wants lower interest rates no matter what. Other Fed responsibilities he’d most likely want to do away with.
The Fed reports to Congress but is not governed by the White House or Congress, so as to ensure its independence. Its owners are the banks, especially the money center banks.
The Fed is driven by data in their attempt to set interest rate levels. The Fed sees inflation remaining sticky at somewhat elevated levels. Inflation was last reported at 2.8% year over year (y-o-y). That’s better than the previous month but still above the Fed’s target of 2%. Economic numbers continue to come in better than expected. The labour market, despite upheaval, still appears strong. The latest initial weekly claims came in at 223,000, below the expected 225,000 but a bit above the previous week’s 221,000. Where is the expected rise in claims? Workers who took the buyout are still on the payroll until September. Many other firings are tied up in court cases. The uncertainty may have many holding off applying.
The Philly Fed (manufacturing index) came in at 12.5, below the previous month’s 18 but above the consensus 8.5. Existing home sales were 4.26 million, better than the expected 3.95 million and even more than the previous month’s 4.09 million. Industrial production, expected at 0.2%, came in at 0.7%, while housing starts rose 11.2%, beating forecasts of down 1.9% and the previous month’s down 11.5%. Retail sales were a bit weaker than expected while the NY Empire State manufacturing index came in at negative 20, well below the expected +2. Recession? What recession? Will it be the Goldilocks economy?
Tariffs are expected to add to inflation, not help pull it down, creating a rock and a hard place for the Fed. A slowing economy but no recession. With Trump’s desire for lower interest rates no matter what, a fight between him and Fed Chair Powell seems inevitable. That in turn would be disruptive for markets, particularly bond markets. Stagflation is more likely than a cut in interest rates. This is no longer the Fed’s economy as it has been seized by Donald Trump. The Fed has no idea what the Trump administration may do next; all they can do is respond. The Fed does not have a magic answer to tariffs or for that matter deportations, which can also have a negative impact on the economy. One is inflationary, while the other slows the economy. But tariffs also act as a drag on the economy. All are at cross purposes to each other. No wonder the Fed has lowered its outlook. Still, the market expects only two rate cuts in 2025.
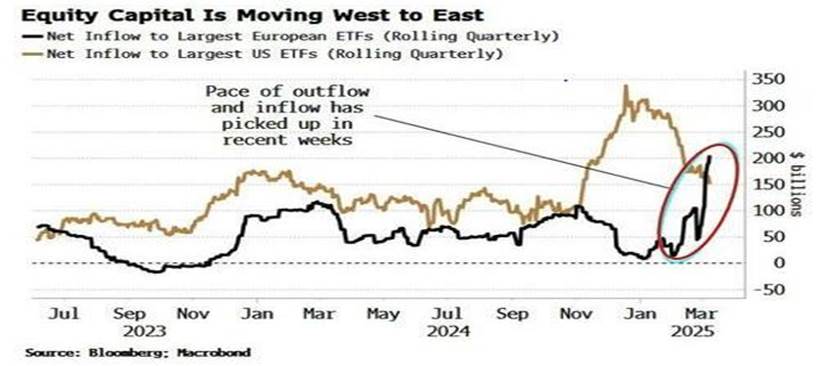
We are seeing signs of trouble. The chart above suggests that capital is leaving the U.S., primarily for the EU but also Asia. This is not a good sign. It puts downward pressure on both the U.S. dollar and U.S. stock markets. Normally we see funds flow into the U.S. However, that no longer seems to be happening. If the U.S. is not seen as the safe haven it used to be, then that could upend things in unpredictable ways. Pressure on the U.S. dollar could put its reserve status into question. All the result of political uncertainty.
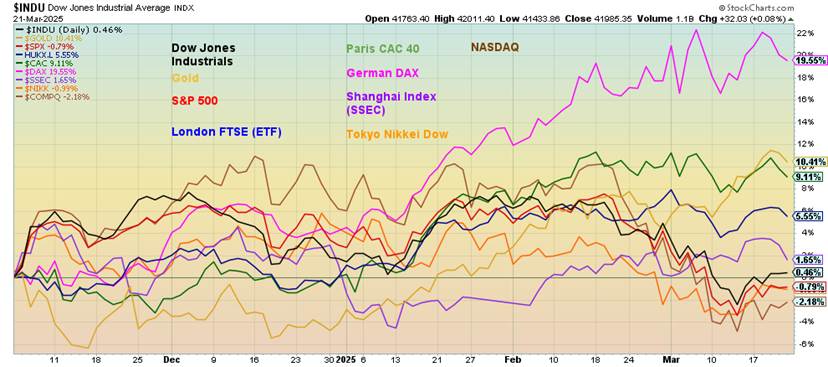
It is then no surprise to see foreign stock exchanges performing better than U.S. exchanges in 2025. Since the election on November 5, 2024, the best-performing index noted in the following chart has been the German DAX, up 21.6%. It’s primarily as a result of Germany’s announcement to up defense spending in the wake of the U.S. seemingly backing away from supporting Ukraine and in turn supporting Russia. Also up are the London FTSE and the Paris CAC 40. In Asia, China’s Shanghai Index (SSEC) is in the plus column, although the Tokyo Nikkei Dow (TKN) is off. U.S. indices are down including the S&P 500 and the NASDAQ. Gold acts as a safe haven and is up since November 5.
Another sign of trouble has been the Fed’s tightening program that has been ongoing since a peak in Fed assets in May 2022. The Fed has been running off bonds at the rate of $20 billion a month. Now they’ve announced they are lowering it to $5 billion/month. What impact that might have on the stock market is unknown at this time. Since the global financial crisis in 2008, Fed assets grew as we went through Q1, 2, and 3 plus other liquidity measures. In 2018, the Fed began quantitative tightening, rolling off the big asset build-up.
Then the pandemic came along and the Fed once again unleashed quantitative easing (on steroids) to prevent the economy from falling into a steep recession or worse. Stocks were hammered but it was all short-lived. The deluge of funds plus lowering of interest rates to virtually zero unleashed a stock market and housing bubble, and then eventually a spike in inflation that sparked a stock market sell-off in 2022. We recovered and markets
peaked out in 2024. Given that inflation was global and not specific to the U.S., there were other factors impacting inflation including global supply disruptions, sanctions, and war. Now another stock market sell-off is underway after a lengthy period of the Fed running off assets. This is the first sign we’ve seen that the Fed might just be a little concerned about the ongoing economic disruption coming out of the White House. Tariffs, deportations, and disruptive firings in the Federal government are only part of the chaos that has been unleashed. Now we have defying of judges, threatening a constitutional crisis. Inflation vs. a slowing economy. A rock and a hard place.
Federal Reserves Assets 2003–2025 (Billions)
We are going through a period of unknown chaos. Admittedly, it is difficult to plan or even forecast in a period like this as the fundamentals are all thrown into the unknown. Fortunately, this is where technical analysis comes in handy. Technical analysis uses patterns, along with support/resistance and trends to make predictions.
And right now, the trend has turned down. But gold’s trend has turned up. In times of geopolitical tensions, economic uncertainty, political chaos, and loss of faith in government, gold becomes a staple for a portfolio. It has no liability. In what appears to be a growing period of stagflation, cash can become “trash.” Value stocks and inflation-protected bonds are also safe havens, along with some exposure to foreign markets and foreign currencies.
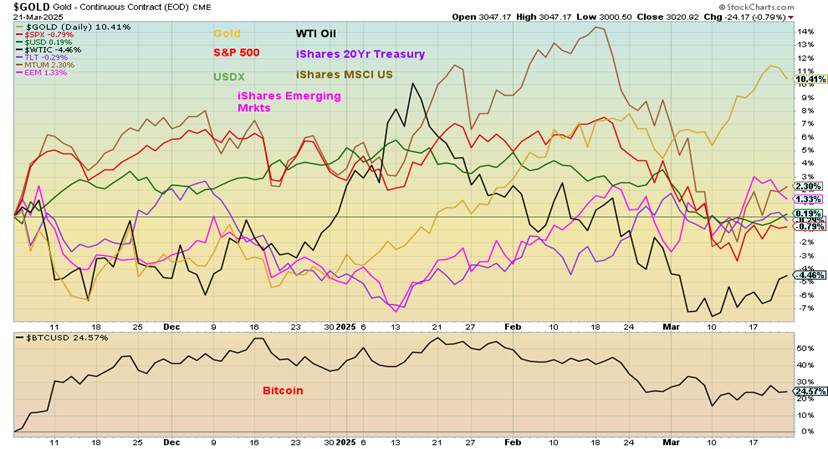
Our performance chart since November 5, 2024 is shown once again. Gold remains in the lead while oil, the S&P 500, and the US$ Index remain down. It is no surprise that uncertainty is rising. We provide the uncertainty index chart as well. It is no surprise that it is spiking as it has done before when a crisis is upon us.
Since 1997, we have faced the dot.com crisis, 9/11 and the War on Terror, the Global Financial Crisis and Great Recession, the period of Trump #45, and the pandemic. Smaller spikes were seen during the 1997 Asian Financial Crisis along with the Russian/Long Term Capital Management (LTCM) crisis 1997 and 1998, the EU/Greek debt crisis in 2011–2018, and the inflation and Russia/Ukraine crisis in 2022. It seems that unstable systems have become the norm and we may be facing our greatest crisis yet.
Global Economic Policy Uncertainty Index 1997–2025
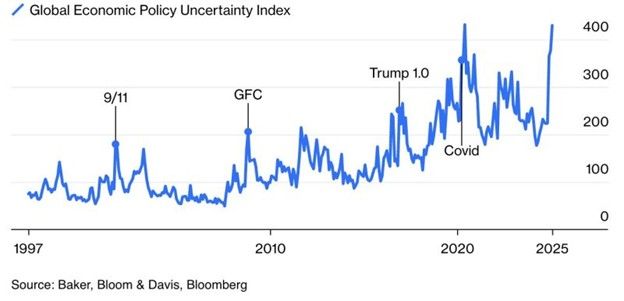
Chart of the Week
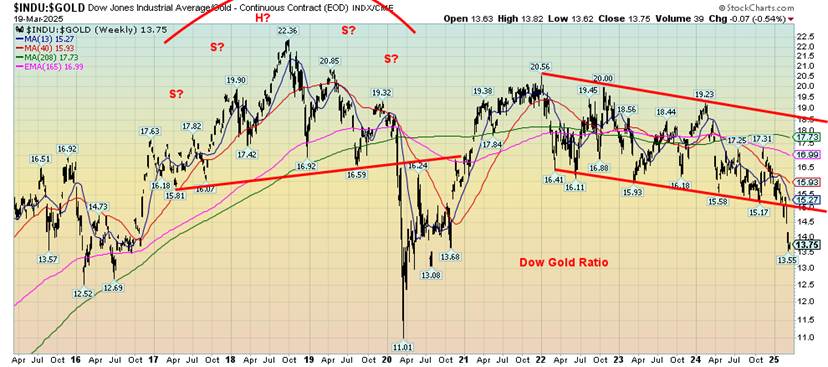
With gold finally capturing a little bit of the headlines, along with the stock market wobbling due to the chaos going on in the U.S., it is probably not surprising that the Dow/Gold ratio is beginning to break down in favour of gold. What the Dow/Gold ratio suggests is that gold is now favoured over stocks. Similar charts can be seen for the S&P 500/Gold ratio and also the NASDAQ/Gold ratio.
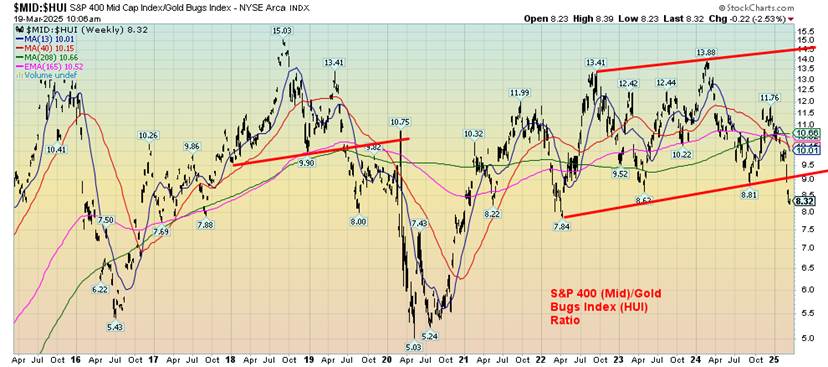
We can take the ratio between stocks and gold another step forward. The S&P 400 (Mid)/Gold Bugs Index (HUI) ratio is also showing the same action. For the Dow/Gold, what appears as a descending triangle has broken to the downside. Objectives appear to be down to around 9.60, which puts it below the ratio seen at the pandemic low in 2020. It still suggests a long way to go before the reaching the records seen in 1933 at 2 and the 1980 level just above 1. The first one came during the depths of the Great Depression while the second came during the massive run-up for gold prices in 1979 that peaked in 1980. At the same time the stock market was falling.
As for the Mid/HUI ratio, the answer remains the same. Only this time the ratio broke an ascending sideways pattern (rarely seen). This time the projection is for a decline to around 3 which is below the low seen at the pandemic low in 2020. Here the all-time low was at 1.3 seen at the high of the gold market rush in 2011. Not to be outdone, the TSX/TSX Gold Index (TGD) ratio is also breaking down in favour of the TGD.
The target here is down to at least 30, which once again puts it below the level seen during the pandemic 2020. As with the others, the previous low was actually seen in 2009 during the 2001–2011 gold rush. 2009 would be during the height of the 2008 financial crisis and Great Recession.
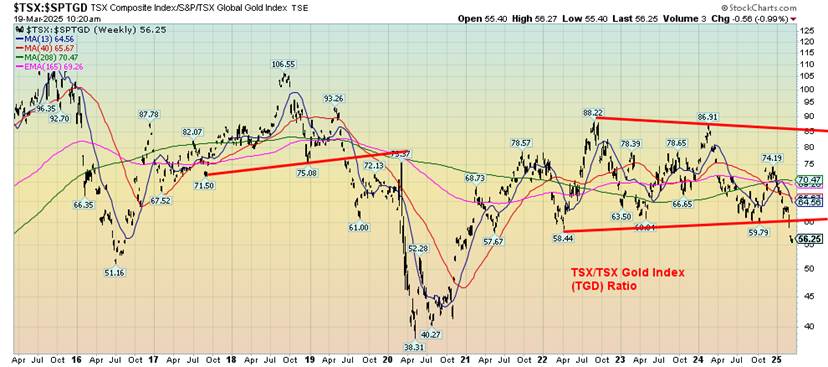
All of these charts suggest we’re in the early stages of a gold rush and the highs for the gold and gold stocks (HUI) (TGD) are still to come. Conversely, there may be lows for the broader stock market to come. The message is the same—buy gold and gold stocks.
Bonus Chart of the Week
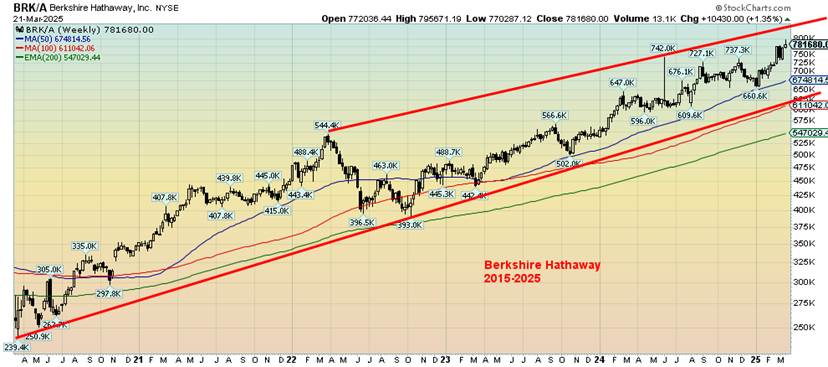
We couldn’t resist. While the stock market has been falling, the MAG7 are entering a bear market, and Tesla is heading for oblivion, Warren Buffett’s Berkshire Hathaway (BRK.A and BRK.B) have been making all-time highs. The power of Warren Buffett? Remember that Berkshire Hathaway had raised some $325 billion in cash before this recent collapse.
While Berkshire has shown a positive return since the election on November 5, 2024, it is no surprise that both MAGS (an ETF of primarily the MAG7) and the NASDAQ are both down. Maybe Buffett knows something the rest of us don’t. Nonetheless, this past week’s action in Berkshire suggests we may have topped. However, we have some distance to go to confirm that. Last weekly low was at 660,600 over 15% below current levels. Early warning may be a break under 725,000.
Markets & Trends
| % Gains (Losses) Trends | ||||||||
| Close Dec 31/24 | Close Mar 21/25 | Week | YTD | Daily (Short Term) | Weekly (Intermediate) | Monthly (Long Term) | ||
| ne | ||||||||
| S&P 500 | 5,881.63 | 5,667.56 | 0.5% | (3.6)% | down | down (weak) | up | |
| Dow Jones Industrials | 42,544.22 | 41,985.35 | 1.2% | (1.3)% | down | neutral | up | |
| Dow Jones Transport | 16,030.66 | 14,608.59 | 1.0% | (8.1)% | down | down | neutral | |
| NASDAQ | 19,310.79 | 17,784.05 | 0.2% | (7.9)% | down | down | up | |
| S&P/TSX Composite | 24,796.40 | 24,553.40 | 1.7% | 1.0% | down (weak) | up (weak) | up | |
| S&P/TSX Venture (CDNX) | 597.87 | 637.79 | 2.7% | 7.7% | up | up | neutral | |
| S&P 600 (small) | 1,408.17 | 1,287.57 | 0.6% | (8.6)% | down | down | neutral | |
| MSCI World | 2,304.50 | 2,512.93 | 1.4% | 9.0% | up | up | up | |
| Bitcoin | 93,467.13 | 83,990.91 | (0.3)% | (10.1)% | down | neutral | up | |
| Gold Mining Stock Indices | ||||||||
| Gold Bugs Index (HUI) | 275.58 | 352.14 (new highs) | 2.7% | 27.8% | up | up | up | |
| TSX Gold Index (TGD) | 336.87 | 442.72 (new highs) | 2.5% | 31.4% | up | up | up | |
| % | ||||||||
| U.S. 10-Year Treasury Bond yield | 4.58% | 4.26% | (1.4)% | (7.0)% | ||||
| Cdn. 10-Year Bond CGB yield | 3.25% | 3.02% | (2.3)% | (7.1)% | ||||
| Recession Watch Spreads | ||||||||
| U.S. 2-year 10-year Treasury spread | 0.33% | 0.28% | 3.5% | (15.2)% | ||||
| Cdn 2-year 10-year CGB spread | 0.30% | 0.50% | flat | 66.7% | ||||
| Currencies | ||||||||
| US$ Index | 108.44 | 104.13 | 0.4% | (4.0)% | down | down (weak) | up | |
| Canadian $ | 69.49 | .6971 | 0.1% | 0.3% | down (weak) | down | down | |
| Euro | 103.54 | 108.15 | (0.6)% | 4.5% | up | neutral | down | |
| Swiss Franc | 110.16 | 113.28 | 0.3% | 2.8% | up | neutral | neutral | |
| British Pound | 125.11 | 129.18 | (0.1)% | 3.3% | up | neutral | neutral | |
| Japanese Yen | 63.57 | 66.95 | (0.5)% | 5.3% | up | up (weak) | down | |
| Precious Metals | ||||||||
| Gold | 2,641.00 | 3,020.92 (new highs) * | 0.7% | 14.4% | up | up | up | |
| Silver | 29.24 | 33.02 | (4.1)% | 12.9% | up | up | up | |
| Platinum | 910.50 | 977.30 | (3.5)% | 7.3% | neutral | up | up (weak) | |
| Base Metals | ||||||||
| Palladium | 909.80 | 948.00 | (2.6)% | 4.2% | down | neutral | down | |
| Copper | 4.03 | 5.11 (new highs) | 4.3% | 26.8% | up | up | up | |
| Energy | ||||||||
| WTI Oil | 71.72 | 68.07 | 1.3% | (5.1)% | down | down | down | |
| Nat Gas | 3.63 | 3.97 | (2.9)% | 9.4% | neutral | up | neutral | |
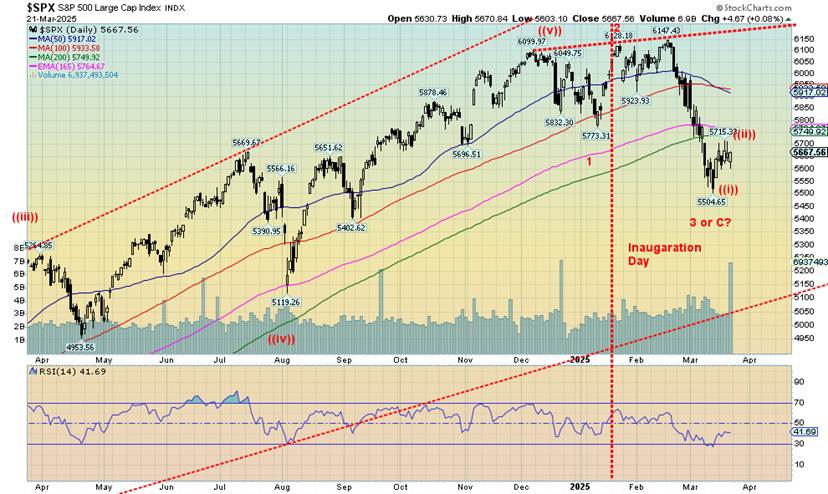
It’s bounce back time. But will it continue or fizzle out here? Supposed easing of the Russia/Ukraine war, the on-again, off-again, on-again, who-knows tariffs creates uncertainty, the chaos enveloping federal employees, but the market seems to be getting used to it and is not responding as negatively as it did at the outset. Nonetheless, stock markets are below their 200-day MA, an area that could now provide resistance on any rebound.
On the week, the S&P 500 rose 0.5%, the Dow Jones Industrials (DJI) was up 1.2%, the Dow Jones Transportations (DJT) gained 1.0%, while the NASDAQ was up a small 0.2%. The S&P 400 (Mid) rose 0.6% while the S&P 600 (Small) was up 0.6% as well. The S&P Equal Weight Index gained 0.6% and continues to at least marginally outperform the weighted S&P 500. The NY FANG Index was flat. Bitcoin lost a small 0.3% and is down 10.1% so far in 2025.
In Canada, the TSX was up 1.7% while the TSX Venture Exchange (CDNX) gained 2.7% and has been the best performer of the indices we closely follow. In the EU, the London FTSE was up 0.3%, the EuroNext up 0.8%, and even made all-time highs, the Paris CAC 40 gained 0.2%, while the German DAX made all-time highs, then reversed and closed down 0.4%. Has the DAX topped?
In Asia, China’s Shanghai Index (SSEC) fell 1.6%, the Tokyo Nikkei Dow (TKN) gained 1.7%, while Hong Kong’s Hang Seng (HSI) fell 2.2% after making all-time highs. Those are interesting reversals for both the DAX and the HSI. The MSCI World Index gained 1.4% and continues to support emerging markets.
The chaos of the Trump administration continues to play havoc with markets, largely because of the unknown. At best, we appear headed for a recession but continue to see some signs of growth, or at least the markets not falling much—yet. The biggest laggard is unemployment, even as we expect it to rise.
The recent low was near 5,500, so if that breaks, we are headed for the next level near 5,400. A break of 5,400 is more serious and could trigger a panic. Markets are bouncing off oversold, even as the oversold indicators did not get hugely oversold. The Fear & Greed Index is still registering extreme fear. Keep in mind the old adage of when everyone is fearful, buy.
Certainly, dip buying has been a characteristic of this market. It only fell into correction territory and barely at that. The NASDAQ has been the worst performer. Small cap and mid cap stock indices have also been weak, along with the DJT. If we don’t experience a crash, it may instead be a stair-step decline as we saw during the 1973-1974 bear market.
To the upside, we’d need to see a break above 5,800 to suggest going higher. Breaking above 5,900 appears more remote at this time. We’d have to get above 6,000 to suggest new highs. So far, this is just a bounce but it could take us to at least 5,700/5,800 before petering out and turning down again.
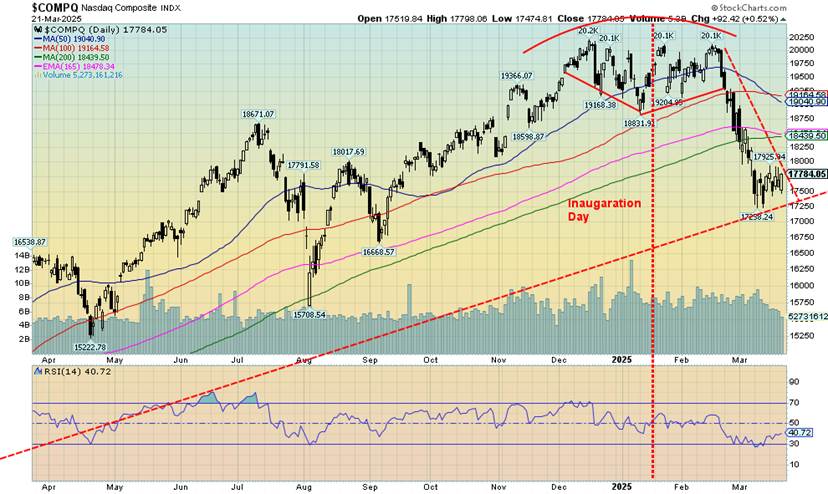
The NASDAQ squeaked out a 0.2% gain this past week. Weakness in the MAG7 continues to weigh on the index. MAGS, the ETF that represents the MAG7, fell 0.8% this past week and is now down 13.1% in 2025, in corrective territory. The biggest loser, of course, is Tesla, down 38.4% in 2025 and down 49% from its all-time high in 2024. We’re hard-pressed to find any MAG7 stocks up on the year, but Meta is still clinging to a 1.8% gain. All the others are down on the year. It’s no surprise to find Trump Media (DJT) down 40.6% in 2025 and down 88.5% from its 2021 all-time high. Both DJT and TSLA are in serious bear markets.
DJT and TSLA’s declines may not be over. The NASDAQ hit an up-support line at the recent low of 17,238. A break of that would send the NASDAQ lower, towards 15,700. A move over 18,000 would be positive and suggest we may be able to rally to next good resistance at 18,400/18,500. We’d be surprised if it could do better than that. The NASDAQ is down 7.9% on the year and is down 11.9% from its all-time high as of Friday in correction territory. At its recent low it was down almost 15%. The NY FANG Index was flat this past week but is down 8.1% in 2025 and down 14.2% from its all-time high.
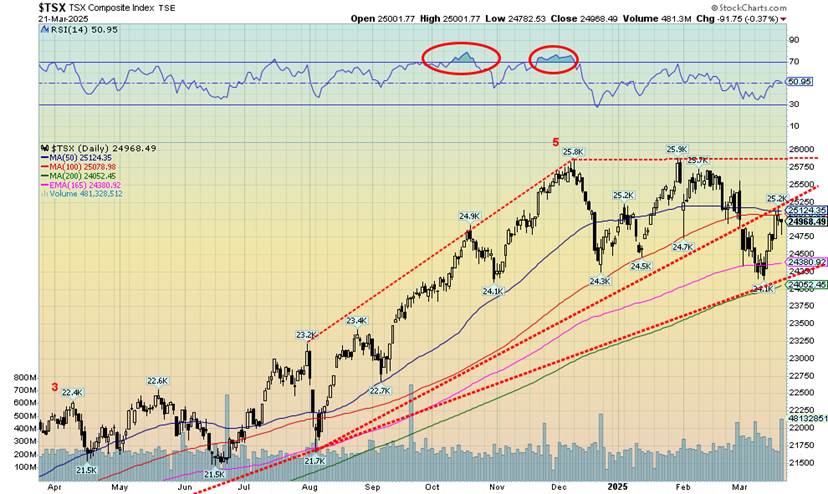
The TSX Composite had the best return of the major indices this past week, gaining 1.7%. The TSX Venture Exchange (CDNX) did even better, gaining 2.7%, and is now up 6.7% on the year. Eleven of the 14 sub-indices gained on the week led by Energy (TEN), up 4%. Other good performers were Consumer Staples (TCS) and Golds (TGD), both up 2.5%. The dog of the week was Telecommunications (TTS), down 3.6%. The best-performing sub-indices in 2025 are Golds (TGD), up 31.4%, Materials (TMT), up 20.1%, and Metals & Mining (TGM), up 13.5%.
At the other end are Health Care (THC), down 14.3%, Information Technology (TTK), off 3.3%, and Financials (TFS), down 2.6%. Our theme of commodities for 2025 is performing well. The TSX has rallied into what might be resistance. A move above 25,250 could suggest further gains to come. On the other hand, a drop back under 24,750 could be the sign of trouble. A break under 24,050 could set off a larger down move. The TSX continues to trace out what we believe is a topping pattern, irrespective of a short-term rebound. A move above 26,000 would be quite good with probably more upside to come.
Canada Rates – Inflation, Bank of Canada (BofC) Rate and 10-year Government Bond (CGB) 2015–2025
Inflation in Canada unexpectedly turned higher for February. The market had expected a rise month over month (m-o-m) of 0.6% due to the end of the HST tax break. Instead, it rose 1.1% while annually it was up 2.6% vs. the expected 2.2%. In January it rose 1.9%. Core inflation also rose up 2.7% year over year (y-o-y) vs. the expected 2.2%. It all came as a bit of a surprise. As a result, it’s having a dampening effect on the Bank of Canada (BofC) lowering interest rates at the next meeting in April.
As our previous chart shows, inflation is rising (blue), the BofC rate has come down, currently 2.75%, while the 10-year Government of Canada bond (CGB) is down but has perked up a bit, currently at 3.06%. The result is we’re getting closer to potentially negative interest rates, meaning the BofC rate and the 10-year rate are below the rate of inflation. A positive yield curve would have the interest rates above the rate of inflation. All this is happening while the U.S. and Canada conduct a trade war (which is ultimately inflationary), Canada has called an election for April 28, and a recession is looming, if not already underway.
U.S. 10-year Treasury Note, Canada 10-year Bond CGB
The global bond market is the largest in the world, estimated to be near $140 trillion. The global stock market by comparison is estimated at roughly $115 trillion. Everyone follows the stock market, but few follow the bond market, even though the bond market has more sway over lots of things including mortgages. The stock market hogs the limelight while the bond market just putters along. Given fears of recession, it was probably no surprise that bonds rallied a bit this past week.
The Fed standing pat at its March 18–19 FOMC meeting was also no surprise. The 10-year U.S. treasury bond fell 6 bp or 1.4% to 4.26%. In Canada, the Government of Canada 10-year bond (CGB) fell 7 bp to 3.02%. Both remain above recent low yields. The U.S. continues to have bond auctions and so far they have not run into any signficant problem filling their needs. The recession spreads were steady this past week with the U.S. 2–10 spread at +28 bp and the Canada 2–10 at +50 bp. After a long period of a negative yield curve (short rates above long rates), the curve has now normalized (short rates below long rates). That usually is a sign that a recession could soon be upon us, if it hasn’t already started.
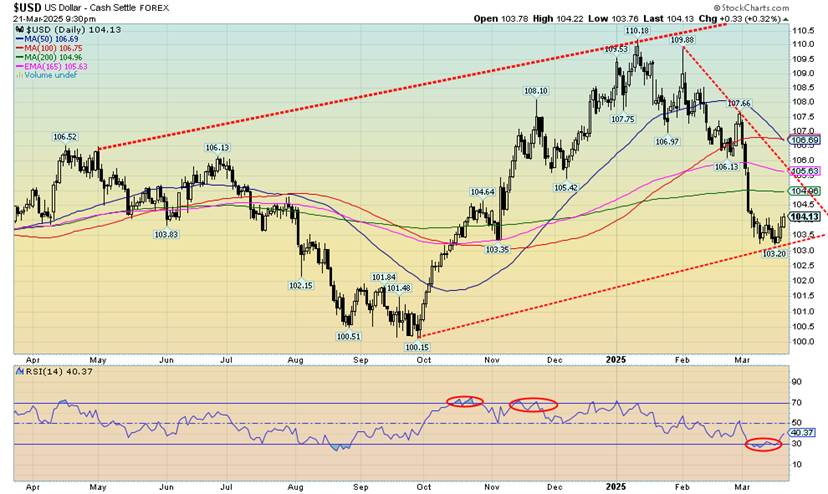
Having fallen roughly 6% since earlier in 2025, the US$ Index rebounded this past week, gaining 0.4%. It was pretty small movement everywhere else as well. The euro fell 0.6%, the Swiss franc was up 0.3% (perceived safe haven currency), the pound sterling fell 0.1%, while the Japanese yen was down 0.5%. The Canadian$ was up 0.1%. All in all, a pretty quiet week for the currencies. The US$ Index has come under pressure due to the tariff wars being conducted by the U.S. and as well some outflow of funds from the U.S. to the EU and Asia due to growing concern about the future direction of the U.S.
Ultimately, this could threaten the U.S. dollar as the world’s reserve currency. However, it is too early to say that just yet. We’ve noted previously that the US$ Index tends to perform poorly under Republican presidents, so maybe its drop is no surprise. A breakdown now under 103 could set the stage for the next zone of support down near 100. The rebound this past week was overdue as the US$ Index had become oversold. However, to suggest we’ve made a low we’d have to break out over at least 105.50. However, we can’t rule out a corrective rally taking us up to at least 105. New lows below 103.20 would end any thought of a further rally and the downtrend would continue. So far, all this looks like is a corrective bounce.
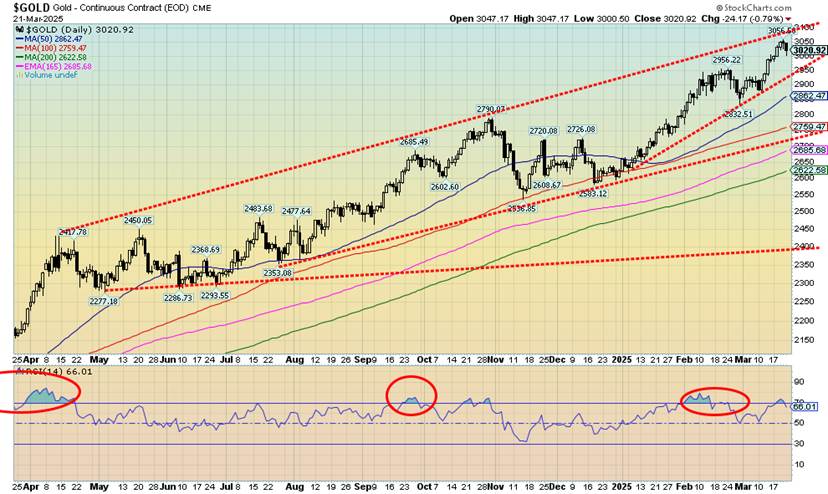
Once again, gold soared to all-time highs this past week. The high was $3,056.60. $3,100 looms closer. On the week, gold gained 0.7%. The other metals, with the exception of one, were down on the week. Silver fell a sharp 4.1%, platinum was down 3.5% while of the near precious metals, palladium fell 2.6%. Not so for copper which once again led the way, up 4.3% to close at $5.11 and inching closer to fresh 52-week highs in the process. The last one was $5.20, seen in May 2024. Copper leading is positive for gold and ultimately the precious metals and precious metals stocks. It’s no surprise that copper stocks are moving higher.
The big one is Freeport McMoran (FCX/NYSE). FCX is up only 6% in 2025, lagging the metal by a wide margin as copper is up 26.8%. FCX is nowhere near its 52-week and all-time high near $55 (last at $40.25). Still, we view copper as a leading indicator. That seems odd when the economy is slowing, but copper’s rise has more to do with supply disruptions and tariffs being imposed. Neither are positive for copper so the price rises. Chile is the world’s largest copper producer, followed by Peru, the Democratic Republic of Congo, and China. Chile also has the world’s largest reserves of copper, but also holding large reserves are Russia, Australia, Peru, and the Democratic Republic of Congo.
Gold continues to be driven as a safe haven from the turmoil being unleashed: geopolitical tensions (Russia, Iran, Israel, U.S.A.) and economic uncertainty (tariffs, recession, and loss of faith in government, particularly the U.S.A.). Gold still seems to have room to climb to $3,100 where it would next meet resistance. While the RSI got over 70 it was never seriously overbought. Support is seen down to $2,950; however, we’d prefer to see $3,000 hold on any pullback. Danger comes in under $2,925 and under $2,830 a top is confirmed. Pullbacks can occur any time but as long as good supports hold the trend is up.
Nonetheless, the weakening stock market is seeing some of those funds being redeployed into gold as a safe haven. Gold has no liability, unlike stocks. And crypto remains too volatile as it continues to have problems with scams and theft. Trade wars are spooking the stock markets and the beneficiary is gold. A pending recession can also be positive for gold. If the stock market falls sharply, gold tends to fall as well but the drop is less than for other assets. Gold has also shown a propensity to be the first out of the chute once things turn around.
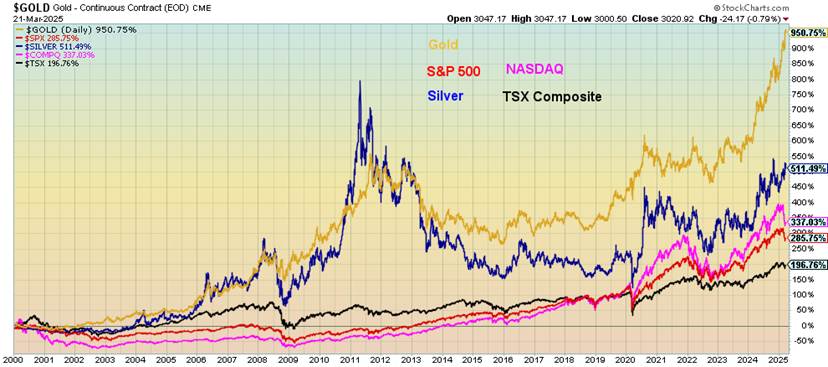
Gold has been the best-performing asset since 2000 over a few other assets. Gold is up 950% since 2000 compared to the S&P 500 which is up 286%. Silver has done well, up 511%, the NASDAQ is up 337%, while the TSX Composite is up 197%. Not included in this comparison were REITs, representing real estate, or bonds and cash. Just too many REITs to pick one. Housing prices are estimated to be up 400% to 450% since 2000 but that can vary. Small cap stocks also outperform large caps. The S&P 600 (Small) is up roughly 550% since 2000. Holding gold in one’s account can pay dividends, stabilize portfolios, and be key during periods of economic uncertainty.
Performance Selected Assets 2000–2025
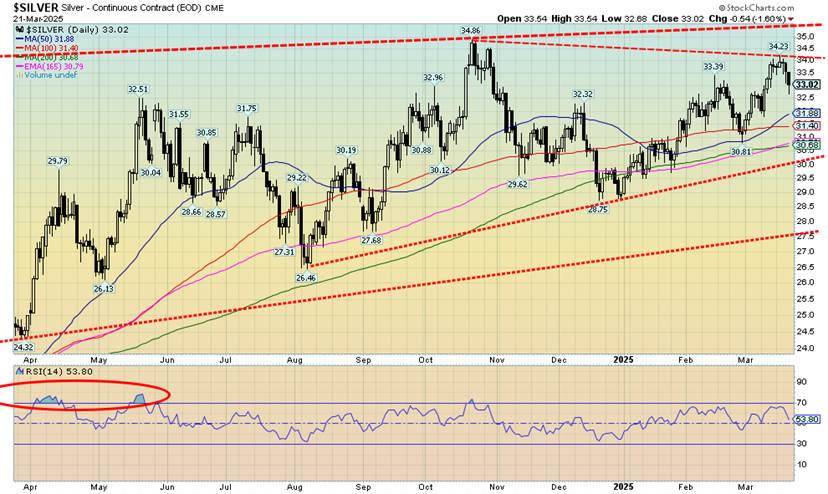
Admittedly, silver is a very frustrating commodity when placed alongside gold. While gold makes all-time highs, silver is still trying to make 52-week highs and is nowhere near its all-time high near $50 (hit twice, 1980 and 2011). This has driven the gold bugs, or should we say the silver bugs, crazy. Silver fell 4.1% this past week while gold was gaining 0.7% to new all-time highs. This divergence between the two has caused great consternation.
Even on the year, silver lags up 12.9% to gold’s 14.4%. Silver stocks have been more volatile following the price of silver. One of the leading silver stocks, Endeavour Silver (EDR/TO) is up 26% this year but remains short of recent highs seen in October 2024. It’s still down 49% from its all-time high seen in 2011. Silver is down only 34% from its all-time high.
We seem to have hit a ceiling so far at $34. We need to firmly break that level if we want to see new highs above $34.86. We still have targets up to $38/$39, but the longer we trade at current levels it looks more and more remote. There is support down to $32. Only under $30 would we declare the silver rally over. Irrespective of this, we continue to see along with others that silver has great potential and should eventually trade sharply higher. First, we need to break above $34 and hold above it, then make the move to break above $35. The first signs of trouble come under $32.
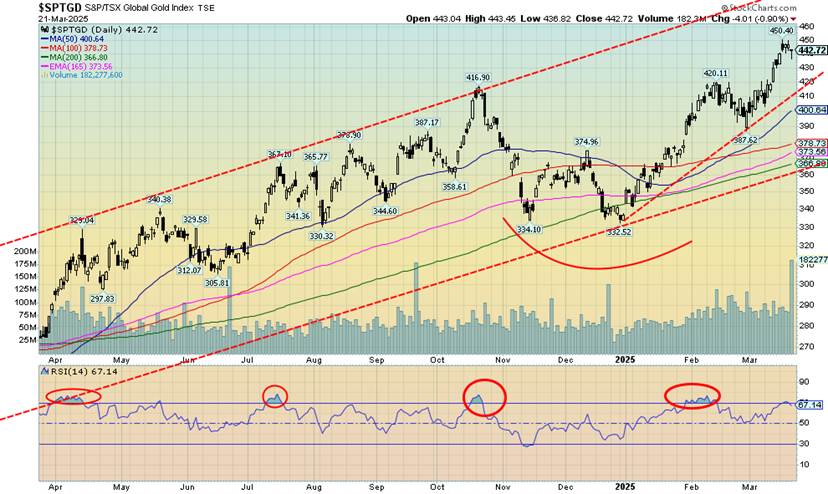
Gold stocks continued their upward march this past week as the TSX Gold Index (TGD) gained 2.7% while the Gold Bugs Index (HUI) was up 2.5%. Both indices made 52-week highs. The TGD fell five points short of an all-time high when it topped at 450.40 this past week before pulling back. At the highs, the RSI was marginally overbought, but earlier highs had seen the RSI at higher levels for a longer period. We have decent support down to the 410/420 area, but below that a fall to 400 or even lower becomes possible.
Naturally, that last low near 388 becomes important as a break of that level signals at least a temporary top. To the upside, we have more room to move higher within the current bull channel. We remain positive towards the sector. If this is a third wave to the upside, an objective of at least up to 475 remains possible. Just watch those downside breaks as they could signal lower prices. The question is, will 455 the 2011 high remain elusive? We’d have to reach at least 627 to equal the 2011 high on an inflation-adjusted basis.
The HUI remains well off its 2011 high, still down 45%. Different components spell why one index has done better than the other. Given that gold continues to hit new all-time highs, the gold stock indices have been laggards.
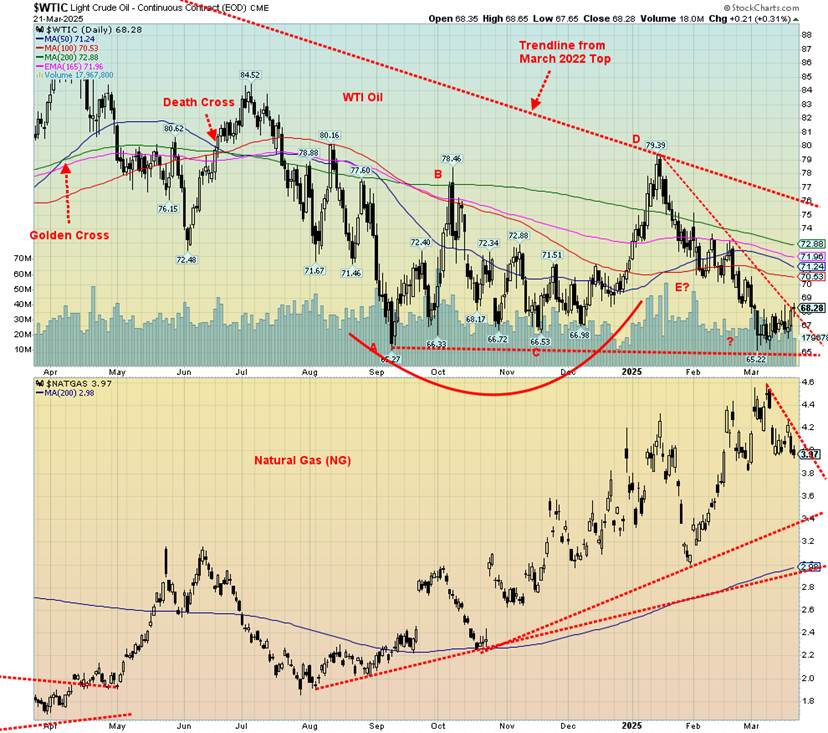
Oil prices rose modestly this past week, buoyed by OPEC’s desire to keep prices elevated and Trump’s continued threats directed at Iran. WTI oil rose 1.3% while Brent crude was up 2.2%. Increased output and warmer weather helped push natural gas (NG) prices lower. NG at the Henry Hub fell 2.9% back under $4, while NG at the EU Dutch Hub rose 0.8%. The price at the EU Dutch Hub rose due to ongoing attacks by both Russia and Ukraine on each other’s energy facilities, despite a supposed cease-fire.
Warmer weather also played a role as did low gas reserves, currently at around 34% of capacity. Low oil reserves are also prevalent in North America as storage levels are 27% below last year and 11.9% below the five-year average. U.S. distillate stocks and NG stocks are also at low levels, suggesting a need to replenish them.
All this appears to point to higher prices ahead. WTI oil may be trying to break above that downtrend line from the January peak. So far, the lows have been holding and the odds of a plunge to new lows below $65 now seem more remote. Nonetheless, there is considerable resistance above ranging from $70.50 to $73. We need to break firmly over and hold it over $76 now to suggest a better run to the upside. NG looks lower, but if we can regain back above $4.20 the odds then point to higher prices. A break of $3.80 could suggest a decline to the $3.40 area.
We are still in a period that is favourable to energy prices. It lasts until at least June. But, even then, hurricanes can play a role. The energy stocks responded positively this past week and their rise may portend higher oil and gas prices. The ARCA Oil & Gas Index (XOI) rose 3.4% while the TSX Energy Index (TEN) was up 4.0%. That’s decent gains when both oil and gas remain essentially on their heels.
__
(Featured image by Oren Elbaz via Unsplash)
DISCLAIMER: This article was written by a third party contributor and does not reflect the opinion of Born2Invest, its management, staff or its associates. Please review our disclaimer for more information.
This article may include forward-looking statements. These forward-looking statements generally are identified by the words “believe,” “project,” “estimate,” “become,” “plan,” “will,” and similar expressions, including with regards to potential earnings in the Empire Flippers affiliate program. These forward-looking statements involve known and unknown risks as well as uncertainties, including those discussed in the following cautionary statements and elsewhere in this article and on this site. Although the Company may believe that its expectations are based on reasonable assumptions, the actual results that the Company may achieve may differ materially from any forward-looking statements, which reflect the opinions of the management of the Company only as of the date hereof. Additionally, please make sure to read these important disclosures.
Copyright David Chapman 2025
David Chapman is not a registered advisory service and is not an exempt market dealer (EMD) nor a licensed financial advisor. He does not and cannot give individualised market advice. David Chapman has worked in the financial industry for over 40 years including large financial corporations, banks, and investment dealers. The information in this newsletter is intended only for informational and educational purposes. It should not be construed as an offer, a solicitation of an offer or sale of any security. Every effort is made to provide accurate and complete information.
However, we cannot guarantee that there will be no errors. We make no claims, promises or guarantees about the accuracy, completeness, or adequacy of the contents of this commentary and expressly disclaim liability for errors and omissions in the contents of this commentary. David Chapman will always use his best efforts to ensure the accuracy and timeliness of all information. The reader assumes all risk when trading in securities and David Chapman advises consulting a licensed professional financial advisor or portfolio manager such as Enriched Investing Incorporated before proceeding with any trade or idea presented in this newsletter.
David Chapman may own shares in companies mentioned in this newsletter. Before making an investment, prospective investors should review each security’s offering documents which summarize the objectives, fees, expenses and associated risks. David Chapman shares his ideas and opinions for informational and educational purposes only and expects the reader to perform due diligence before considering a position in any security. That includes consulting with your own licensed professional financial advisor such as Enriched Investing Incorporated. Performance is not guaranteed, values change frequently, and past performance may not be repeated.


TopRanked.io Weekly Affiliate Digest: What’s Hot in Affiliate Marketing [Bovada Affiliate Program]
This week, we're mashing up 80s tech with 2020s private messaging apps. Why? Because Big Tech just dropped a big...


Euro Stablecoins Struggle to Compete with Dollar Dominance in Crypto Markets
Euro stablecoins remain marginal despite the euro’s global importance, with minimal trading volume compared to dollar rivals like USDT and...


Gilead Sciences Advances Growth Strategy with Focus on HIV, Oncology, and Innovation
Gilead Sciences focuses on developing treatments for HIV, cancer, and inflammatory diseases, driven by blockbuster drugs like Biktarvy. Growth relies...


Casablanca Stock Exchange Profits Surge in 2025 as Growth Momentum Strengthens
In 2025, Casablanca Stock Exchange profits rose 40% to MAD 50.9 billion. Net income grew 22.3%, driven by strong industrial...


Credibur Scales Rapidly: €2 Billion in Structured Debt Facilities in Six Months
Infrastructure fintech Credibur has added over two billion euros in structured debt facilities within six months. Its platform connects lenders,...
 |
|
 |  |
 |
|
-

 Impact Investing5 days ago
Italian Unlisted Banks Lag on ESG Sustainability
-

 Crypto2 weeks ago
The Iran War Tests Bitcoin and Crypto Market Resilience
-
 Crypto2 days ago
Euro Stablecoins Struggle to Compete with Dollar Dominance in Crypto Markets
-

 Crypto1 week ago
Crypto Markets Volatile as Bitcoin Hovers, Solana Eyes AI Integration