Markets
How Income & Wealth Inequality, and the Buffett Indicator Impacted Markets
Markets once again made all-time highs. Well at least some did, including the S&P 500 and the NASDAQ. The DJI did not make new all-time highs as it does not have the Magnificent Seven to any extent, only Apple and Microsoft. Interestingly the Equal Weight S&P 500 is also not making new all-time highs as equally weighting the components lessens the impact of the Magnificent Seven given that 3 of the 7 made new all-time highs this past week

Whatever happened to “sell in May, and go away”? Maybe they didn’t receive the message. Instead, the stock markets, or at least parts of it, keeps soaring to new all-time highs.
Thank you, Nvidia, now the world’s largest company, having surpassed both Apple and Microsoft in the $3 trillion dollar club (well, the world’s largest for a moment, at least). While 2024 GDP numbers are not in, all three are now as big as India, the world’s fifth largest economy. Germany and Japan are now within their sights.
Wealth inequality
Over at Forbes Real-Time Billionaires list (www.forbes.com/real-time-billionaires/#2a2f9b793d78), Elon Musk tops it as the richest man in the world, with a net worth of $212 billion. It is not clear whether it includes his recent $56 billion pay packet. To put things in perspective, even at $212 billion Musk would be bigger than T-Mobile and China Mobile as the 55th and 56th largest corporations in the world. Or almost as big as Greece, number 54 by GDP in the world. His pay packet alone is as big as the GDP of the DR Congo, a country of almost 100 million.
No wonder many note that GDP per capita is misleading. Once you eliminate the uber-wealthy, the GDP per capita drops precipitously. U.S. median income is under $25,000, nowhere near the nearly $75,000 GDP per capita. Even mean income is only just above $30,000, and again, if the uber-wealthy were excluded, the U.S. mean income would drop accordingly.
Nonetheless, for those who have had the big three—Nvidia, Apple, and Microsoft—in their portfolios, they have enjoyed a very good year. Well, Nvidia has had a good year, up roughly 180% in 2024 vs. 18% for Microsoft and 10% for Apple. The S&P 500 is up 15% and the NASDAQ up 18%. Far superior to the Dow Jones Industrials (DJI), up just over 3% or the Dow Jones Transportations (DJT) that is actually down in 2024, off over 5%.
Divergences, divergences, divergences. The state of diverging is everywhere, whether it be indices diverging (S&P 500 and NASDAQ vs. the DJI, and DJT), or indices and stocks diverging with their indicators. The stocks making higher highs, the indicators make lower highs. It’s all a warning sign that something is amiss. Similarly, something is amiss when corporations and billionaires are bigger than countries.
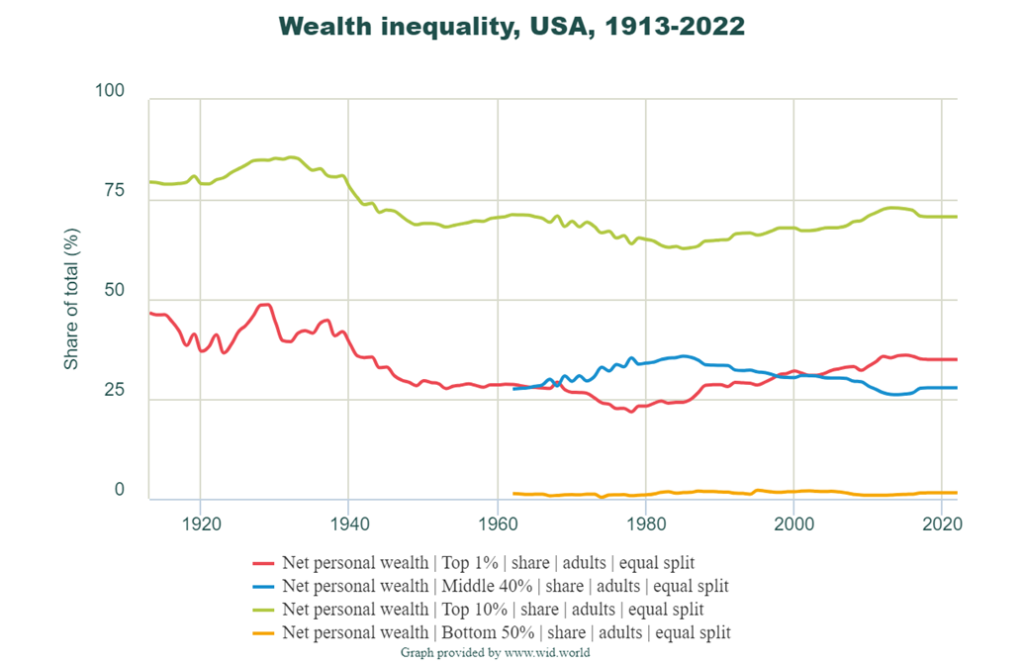
Growing inequality, both the wealth and income kind, is behind some of the current malaise and social unrest currently in the West, particularly the EU, the U.S. and Canada. The inequality can trigger a populist backlash electing governments willing to upset the status quo good and bad. In the U.S., the latest figures available to 2022 show that the 1% hold roughly 35% of the wealth. The top 10% control over 70% of the wealth. That leaves the middle 40% controlling only about 28%, while the bottom 50% control less than 2%. Many in that group have a negative net worth. Since 2000 it has become progressively worse for the bottom 50% while the top 10% and 1% have benefitted.
Despite that, it was worse during the 1920s. However, the Great Depression and World War II changed that and the share of the 1% declined from roughly 1930 to 1980 before it started to rise again. It has been shown that a rise in income and wealth inequality is a drag on economic growth and fosters political and social dysfunction. It’s the old adage. Give a poor man $1,000 and he spends it. Give a rich man $1,000 and he may park it offshore with the rest of his assets.
Unemployment rate
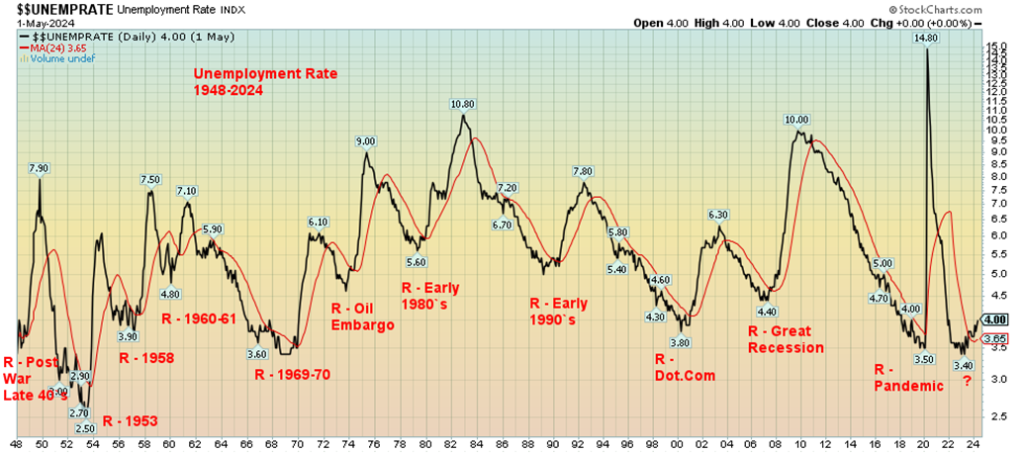
A sign that we are possibly headed for a recession is a rising unemployment rate (U3). At one point the U.S. unemployment rate fell to its lowest in 70 years when it dropped to 3.4% before starting to rise again. Last reported, it had hit 4%. Canada also saw its unemployment fall to a record low before starting to rise once again. What we found out is that the recent rise is also signaling a coming recession.
According to a study by Crescat Capital (www.crescat.net), every time over the past 75 years that the U.S. unemployment rate broke above its 24-month moving average, a recession followed. We are now over the 24-month MA which is at 3.65%. Like the inverted yield curve which we have highlighted a number of times, this signal has been proven to be a sure-fire predictor of a recession. An official recession is two consecutive quarters of negative GDP growth. No, we are not there yet, but the signs are building that one is coming. The signal doesn’t say how deep the recession could be, only that one is looming.
Unemployment Rate with 24-Month MA 1948–2024
Buffett Indicator
Another signal of a potential recession is what is known as the Buffett Indicator. The Buffett Indicator or Buffett Ratio (named after Warren Buffett), as it is also called, is the market capitalization of the U.S. equity market divided by the gross domestic product (GDP) of the U.S. My colleague Mike Ballanger of GGM Advisory noted it in a recent missive (June 20, 2024). It’s worth repeating.
Actually, the numerator can be defined as the market capitalization of the S&P 500, the Dow Jones Industrials (DJI), or even the Wilshire 5000, divided by GDP. The chart we show below is the market capitalization of the U.S. equity market divided by GDP. The results are largely the same, no matter which one is used, but differences do exist. The differences show up with some making new highs for the indicator while others make lower highs.
What we show is the market cap of the U.S. equity market and its diverging. Despite seeing record highs on the S&P 500 and the NASDAQ along with record highs for the Magnificent Seven, the Buffett Indicator is making a lower high, as noted below. This past week saw retail sales come in below expectations, weekly claims rise above expectations, existing home sales falling more than expectations, the Philly Fed manufacturing index below expectations, and the Conference Board leading index also falling below expectations. More signs of an impending recession?
Add in other indicators such as the advance/decline falling even as the indices rose to new all-time highs, the new highs/new lows seeing new lows rising while new highs fall, the bullish percent indices also falling, and the number of stocks in the S&P 500 trading above their 50-day MA being below 50%. All this despite record highs for the indices. Divergences everywhere. Thursday, June 20 saw some potential key reversals in the market. Nvidia made new all-time highs but closed lower and below the low of the previous day. Nvidia closed lower on the week. A sign that the market has topped?
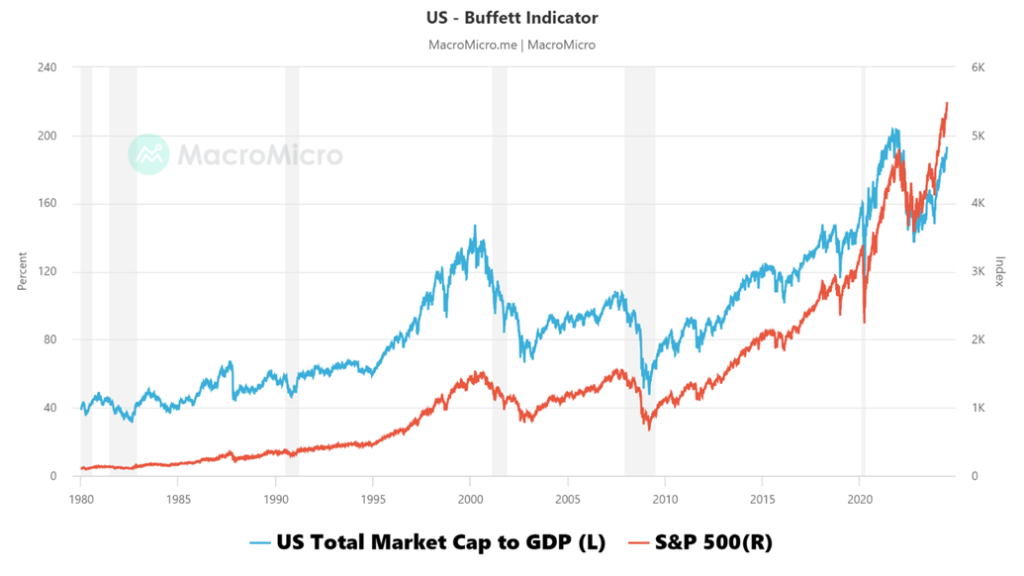
Chart of the Week
Dow Gold Ratio 1914–2024
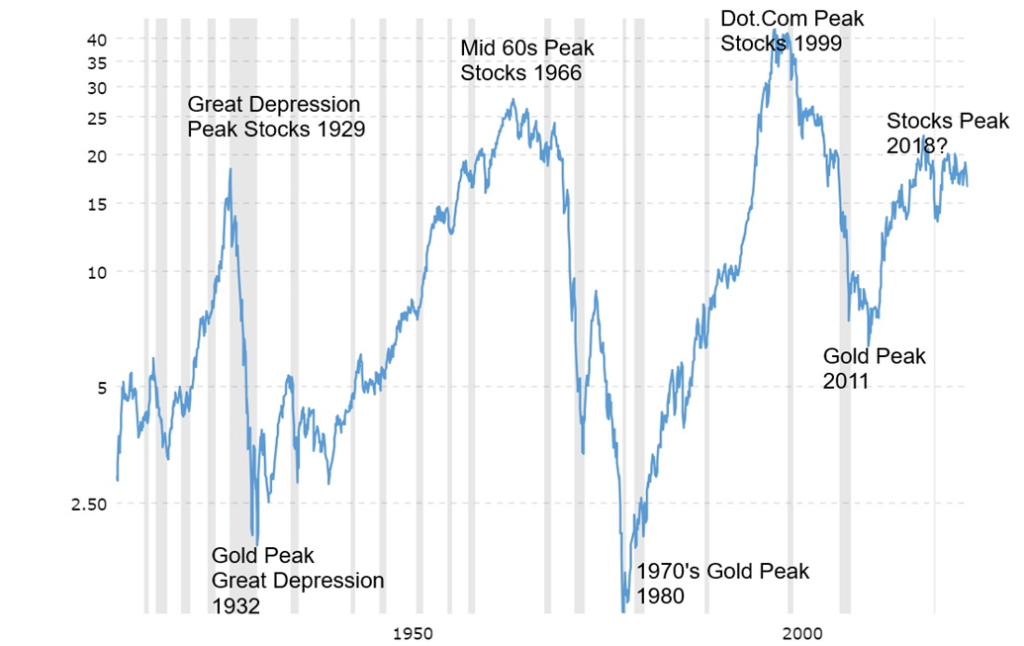
The Dow/Gold Ratio has long been followed. The purpose of the ratio is to determine whether one should be in stocks (Dow Jones Industrials – DJI) or in gold (bullion). The ratio has a long history and has successfully called stock bull markets and gold bull markets. As can be seen from this 100+ year old chart of the Dow/Gold Ratio, stock peaks and gold peaks are often the result of a spike in one or the other. Stock peaks came in 1929, 1966, and 1999 while gold peaks occurred in 1932 and 1980. We could also call the gold peak of 2011 except the ratio did not reach the extremes it did during other gold bull markets.
It’s possibly not surprising that the rebound hasn’t really been much of a deal. Yes, the ratio favoured stocks over gold, then peaked in 2018. After the pandemic, stocks ran once again to new all-time highs, then came the 20% + bear of 2022. None of it resulted in much of a drop for Dow/Gold, nor did the rebound rise resonate, either. If anything, the failure of the Dow/Gold Ratio to make new highs over 2018 despite the record highs in the stock market signals that the ratio may be the one that is rolling over. If that is correct, then the next move should be to the downside for Dow/Gold Ratio, one that favours gold over stocks.
Dow/Gold Ratio 2017–2024
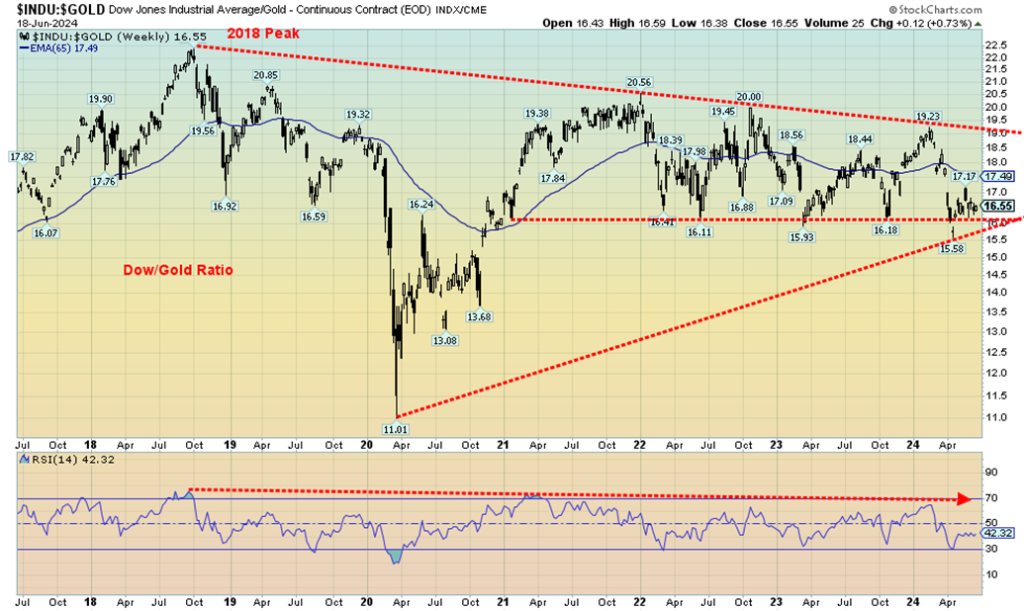
A closer look reveals that since that peak in 2018 we have been making lower highs. That’s a downtrend for the ratio in favour of gold. Since rebounding in 2020–2021, stocks made new highs but the Dow/Gold Ratio made a lower high. That suggests strength for gold as well. Gold went on to new all-time highs as well and has generally outperformed the DJI. Now we note a fairly flat bottom since 2020 as well.
Lower highs, flattish bottoms suggest to us that this is potentially a descending triangle that should be resolved with a break to the downside. That would favour gold over stocks. The breakdown should get underway once the ratio is under 15.5. Note as well that the RSI has also been making lower highs along with the price.
The relationship generally holds if we use the S&P 500/Gold Ratio, except that ratio peaked in 2021 rather than in 2018. Nonetheless, since then the ratio has been making lower highs as well. All this is keeping with our thoughts that the coming recession will favour commodities over stocks. In the example we are using gold bullion. Not surprisingly, we discovered the DJI/CRB Ratio topped back in 2020 before a downswing in favour of the CRB. Since then, the ratio has recovered but is showing signs of rolling over.
The possible descending triangle pattern should break to the downside and have measuring implications to around 11.60. All things being equal, that would equate to gold at $3,300–3,400, assuming the DJI remained at current levels.
While the ratio uses gold bullion vs. the DJI, some investors may wish to leverage by using gold stocks. But unlike gold bullion, gold stocks have liability.
Markets & Trends
| % Gains (Losses) Trends | ||||||||
| Close Dec 31/23 | Close Jun 21, 2024 | Week | YTD | Daily (Short Term) | Weekly (Intermediate) | Monthly (Long Term) | ||
| Stock Market Indices | ||||||||
| S&P 500 | 4,769.83 | 5,464.62 (new highs)* | 0.6% | 14.6% | up | up | up | |
| Dow Jones Industrials | 37,689.54 | 39,150.33 | 1.5% | 3.9% | up (weak) | up | up | |
| Dow Jones Transport | 15,898.85 | 15,113.33 | 2.1% | (4.9)% | down (weak) | down (weak) | neutral | |
| NASDAQ | 15,011.35 | 17,689.36 (new highs)* | flat | 17.8% | up | up | up | |
| S&P/TSX Composite | 20,958.54 | 21,554.86 | (0.4)% | 2.9% | down | up | up | |
| S&P/TSX Venture (CDNX) | 552.90 | 570.71 | (0.6)% | 3.2% | down | up | down | |
| S&P 600 (small) | 1,318.26 | 1,282.37 | 0.8% | (2.7)% | down | up (weak) | up | |
| MSCI World | 2,260.96 | 2,337.33 | (0.3)% | 3.4% | down (weak) | up | up | |
| Bitcoin | 41,987.29 | 64,348.95 | (2.1)% | 53.3% | down | up | up | |
| Gold Mining Stock Indices | ||||||||
| Gold Bugs Index (HUI) | 243.31 | 267.20 | 2.0% | 9.8% | up | up | up | |
| TSX Gold Index (TGD) | 284.56 | 315.55 | 2.2% | 10.9% | up | up | up | |
| % | ||||||||
| U.S. 10-Year Treasury Bond yield | 3.87% | 4.26% | 0.7% | 10.1% | ||||
| Cdn. 10-Year Bond CGB yield | 3.11% | 3.37% | 1.8% | 8.4% | ||||
| Recession Watch Spreads | ||||||||
| U.S. 2-year 10-year Treasury spread | (0.38)% | (0.46)% | 6.1% | (21.1)% | ||||
| Cdn 2-year 10-year CGB spread | (0.78)% | (0.58)% | 1.7% | 25.6% | ||||
| Currencies | ||||||||
| US$ Index | 101.03 | 105.80 | 0.3% | 4.7% | up | up | up | |
| Canadian $ | 75.60 | 73.15 | 0.3% | (3.2)% | neutral | down | down | |
| Euro | 110.36 | 106.94 | (0.1)% | (3.1)% | down | down | down (weak) | |
| Swiss Franc | 118.84 | 112.18 | 0.3% | (5.6)% | up | neutral | neutral | |
| British Pound | 127.31 | 126.47 | (0.3)% | (0.7)% | neutral | up | neutral | |
| Japanese Yen | 70.91 | 62.66 | (1.4)% | (11.6)% | down | down | down | |
| Precious Metals | ||||||||
| Gold | 2,071.80 | 2,331.20 | (0.8)% | 12.5% | neutral | up | up | |
| Silver | 24.09 | 29.61 | 0.5% | 22.9% | up (weak) | up | up | |
| Platinum | 1,023.20 | 996.40 | 3.9% | (2.6)% | neutral | up | up (weak) | |
| Base Metals | ||||||||
| Palladium | 1,140.20 | 924.60 | 2.9% | (18.9)% | down (weak) | down | down | |
| Copper | 3.89 | 4.44 | (1.1)% | 14.4% | down | up | up | |
| Energy | ||||||||
| WTI Oil | 71.70 | 80.73 | 3.4% | 12.5% | up | neutral | neutral | |
| Nat Gas | 2.56 | 2.84 | (1.4)% | 10.9% | up | up | down (weak) | |
The divergences between markets continue. This past week, the S&P 500 (SPX) once again made new all-time highs, gaining 0.6% on the week. The Dow Jones Industrials (DJI) gained 1.5% but is nowhere near making all-time highs. The Dow Jones Transportations (DJT) are even further from making all-time highs, but did manage to gain 2.1% this past week. The DJT remains down 4.9% in 2024. The NASDAQ did make all-time highs, then reversed and finished flat on the week. The S&P 400 (Mid) rose 1.3% this past week while the S&P 600 (Small) was up 0.8%.
In Canada, the TSX Composite fell 0.4% and the TSX Venture Exchange (CDNX) was down 0.6%. In the EU, the London FTSE was up 1.1%, the EuroNext was up 1.5%, the Paris CAC 40 gained 1.7%, and the German DAX was up 0.9%. European markets had a bounce-back week, following some earlier sharp losses due to political uncertainty and the rise of far-right parties. In Asia, China’s Shanghai Index (SSEC) was down 1.1%, the Tokyo Nikkei Dow (TKN) fell 0.6%, but Hong Kong’s Hang Seng (HSI) rose 1.1%. The MSCI World Index fell 0.3%. And, for the record, Bitcoin lost 2.1% and dropped under $65,000. For Bitcoin, $60,000 remains support.
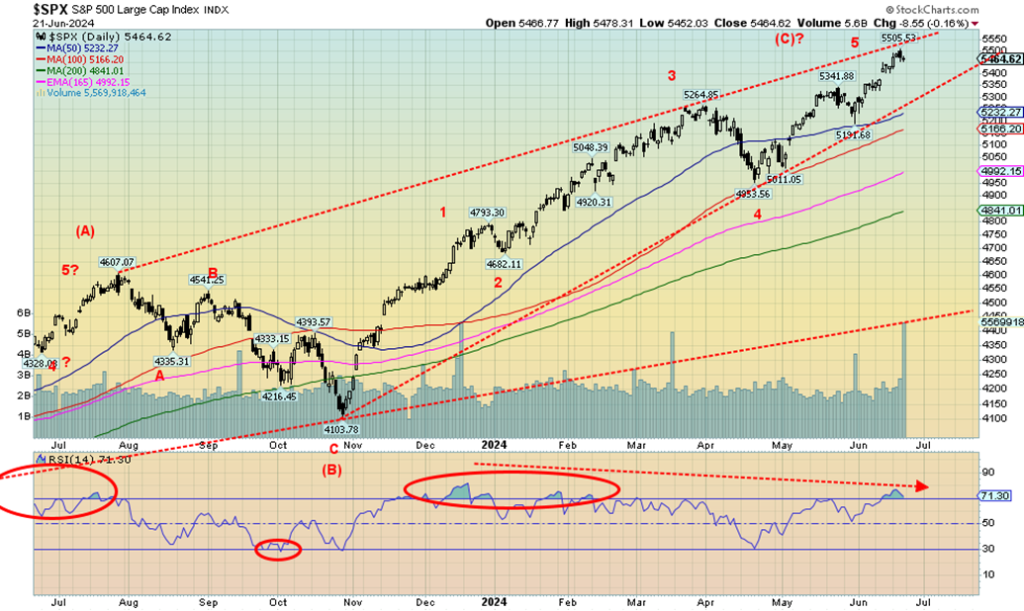
That reversal on Thursday for the SPX was a possible key reversal day. But it needs downside follow-through to prove that it was real. New highs would end thoughts of a down move. But, as we have been pointing out, there are just far too many divergences—between indices, indicators, and more. It can happen once, but the divergences have widened as the stock market moves higher and the indicators make lower highs.
After three divergences (new highs on index, lower highs on indicators), it usually suggests a more serious drop could get underway. 2024 is an election year and stock markets tend to do well in election years. However, this is a deeply divisive election and neither side may be willing to accept the results if the other side wins. The election is currently suggesting it could be close. Add in deepening geopolitical divisions and none of this could be positive for stock markets. However, it could be positive for gold and commodities, particularly given continuing inflation.
The breakdown for the SPX doesn’t happen until under 5,190 on the daily charts and under 4,950 on the weekly charts. For the monthly charts, the breakdown comes under 4,100 but preferably 3,800, the low of 2023. SPX is up 56% from the low of October 2022. But it has been mostly because of the powerful performance of the FAANGs. The Nifty Fifty rally of 1972–1973 preceded an eventual 50% drop in 1974. Does history repeat itself with the FAANGs rally instead of the Nifty Fifty? History will determine.
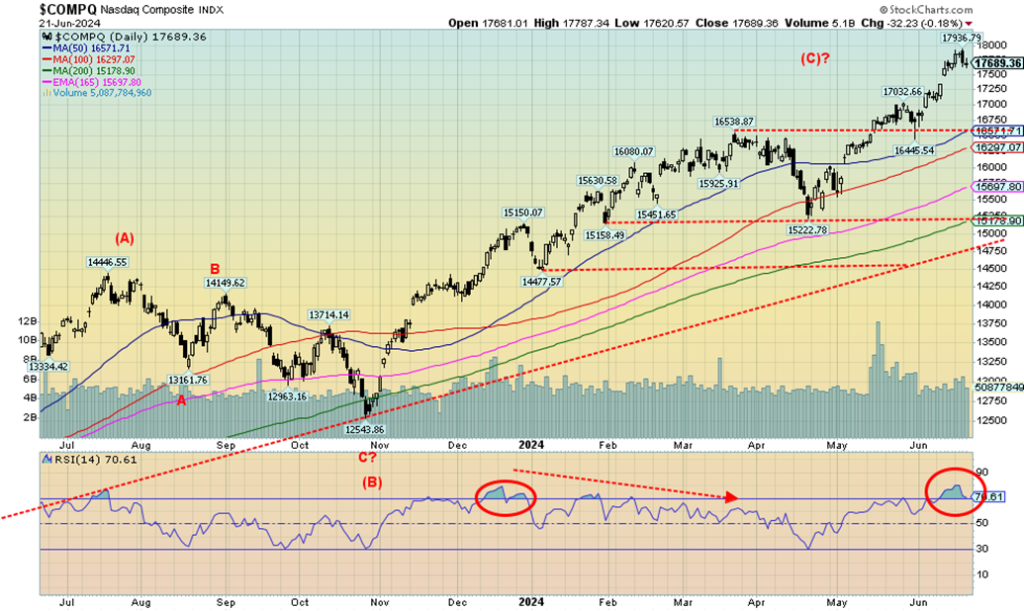
Once again, the NASDAQ made new all-time highs this past week, thanks once again to the surging FAANGs. Thursday saw an outside day reversal that might have been a key reversal day. If that is correct, we expect that lower prices could lie ahead. Only new highs would dispel that thought. We are coming down from overbought levels and an RSI well over 70. The danger point doesn’t come in until the NASDAQ breaks under 16,450. Under 15,200 it is all over and a bear market may develop.
The uptrend line is near 14,750. The NASDAQ has gained about 43% from that low seen last October 2023—all thanks to the FAANGs. This past week, five of them made new all-time highs: Netflix, Google, Microsoft, Nvidia (see below), and Broadcom. All saw reversals this past week. To us it signals trouble ahead. We had an unusual full moon accompany the seasonal change from spring to summer, which may have explained some of the volatility.
Also, a change in seasons often signals trend changes in markets—if not on the solstice, then usually by the first week of July (or January if going from fall to winter). We also see a small gap that could be filled in the coming days. That gap exists between 17,345 and 17,490. If that gap is filled, then it most likely could be signaling lower prices. New highs would change that, but right now we don’t see it as there have been too many divergences between markets and indicators. Only some 45% of NASDAQ stocks are trading above their 50-day MA, despite new all-time highs. This is not strength, it’s weakness.
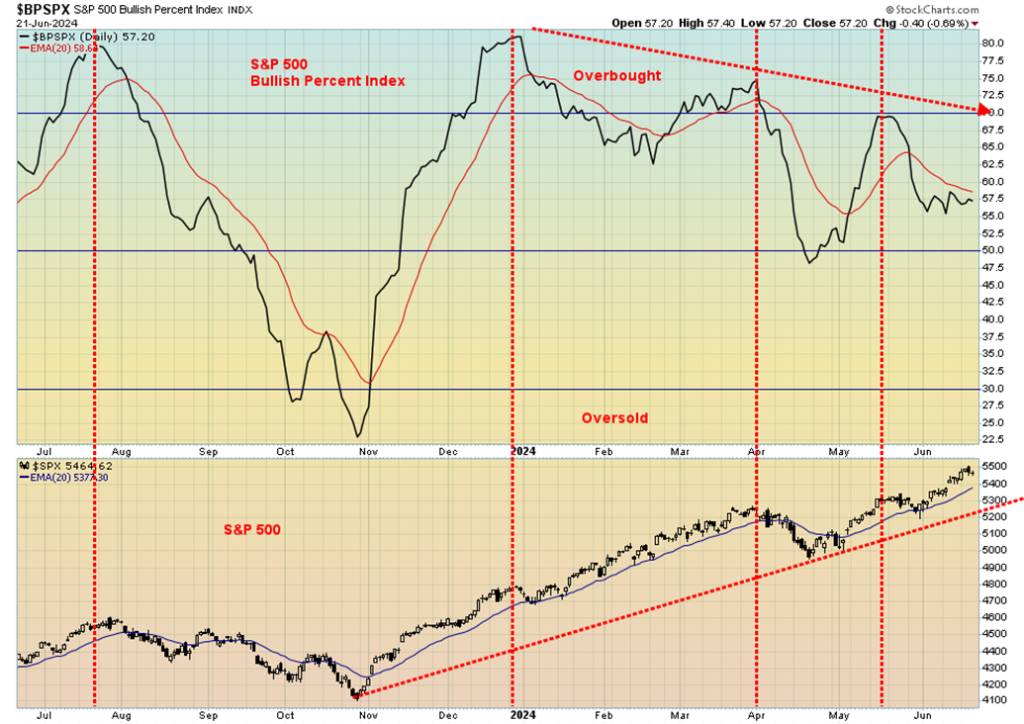
This is another example of an indicator rolling over. Whether it is MACD, Oscillators, Momentum indicators, RSI, bull bear indicators, new highs/new lows, or advance/decline lines, the message is the same. The market moves higher but the indicators move progressively lower. Eventually the index (or stock) breaks as well. Three strikes and you’re out? Yes, three new highs for the SPX and three lower highs for the BPSPX.
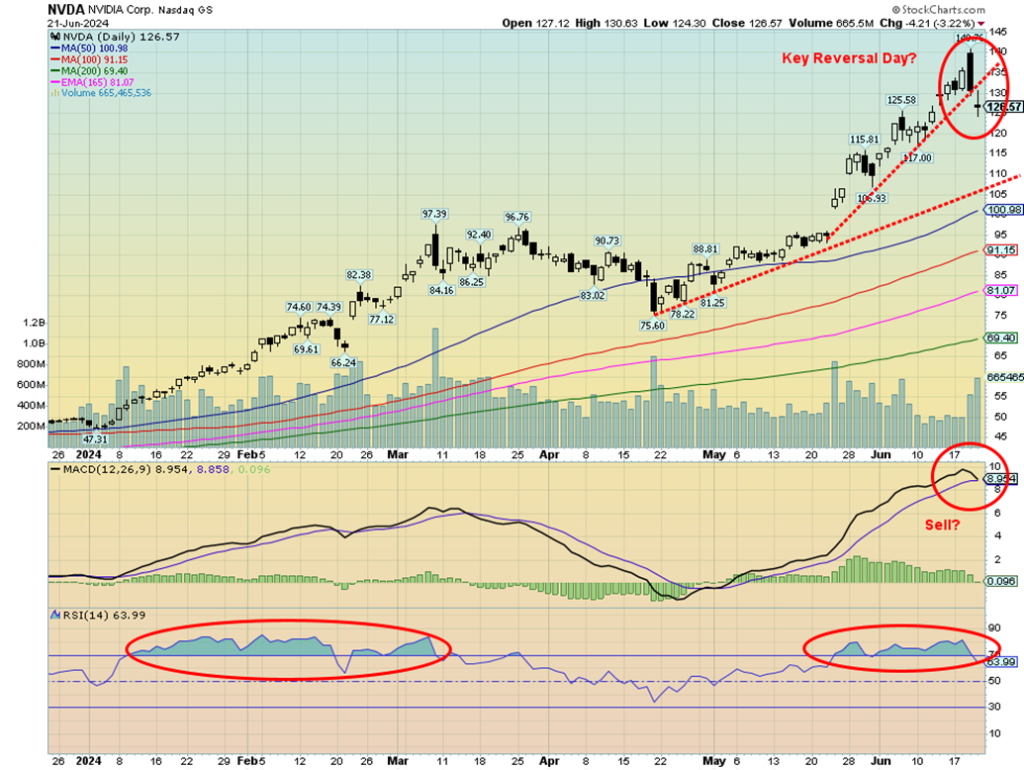
Nvidia, the darling of the tech/AI world. Is the party over? For a very brief time Nvidia became the largest company in the world, surpassing Apple and Microsoft. Then—poof, just like that, Nvidia is back at number 3. Not that a $3.1 trillion market cap company is anything to sneeze at. But in the space of a couple of days, some $200 billion in market cap was wiped out.
A key reversal happens when an index, stock, etc. makes an all-time high intraday and then reverses to the downside, taking out the low of the previous day and closing lower. Nvidia made an all-time high on Thursday, then reversed. On the week, Nvidia fell 3.7% (but, no worries, it is still up 157% on the year). The steep uptrend is gone but the next uptrend line is down around $106. The 50-day MA, a logical target, is currently at $101. That’s another 20% lower. So, once again, we ask—is the party over?
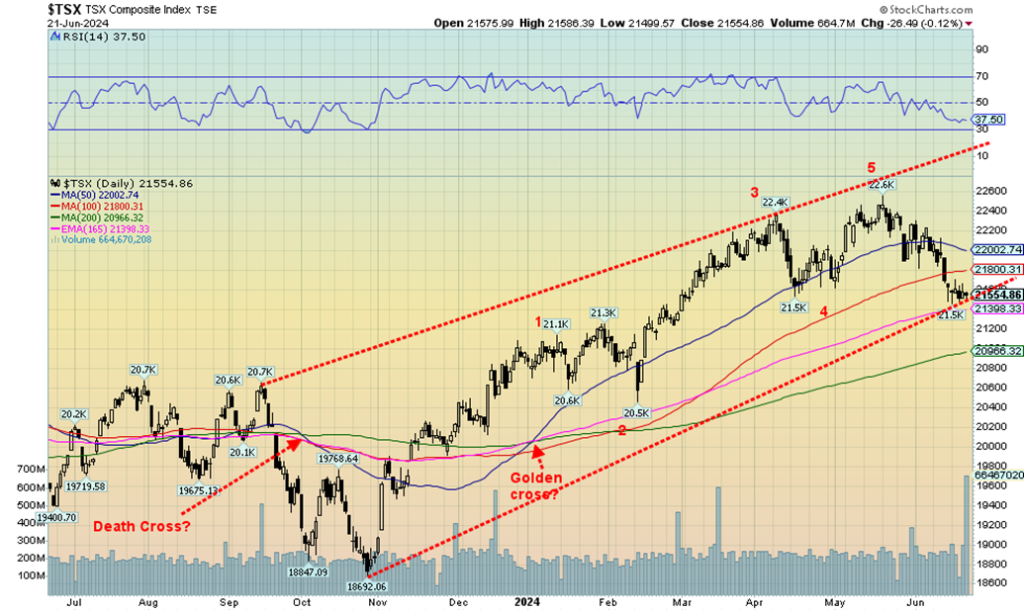
The TSX Composite continues to falter but hasn’t yet broken down. This past week the TSX fell 0.4%. The TSX Venture Exchange (CDNX) continues its poor performance, down 0.6% even as it is up 3.2% so far in 2024. Of the 14 sub-indices, seven were up this past week and seven were down. Leading the ups was Golds (TGD), gaining 2.2%. Metals & Mining (TGM) was up 1.1%. Interest-sensitive sectors took the hits with Utilities (TUT) down 2.1%, Income Trusts (TCM) down 2.2%, and Real Estate (TRE) off 1.4%. Financials (TFS) fell 0.5%.
This aligns with our thoughts that commodities will remain the place to be while one should avoid interest-sensitive stocks, despite bonds improving. The TSX is hanging on the 165-day EMA near 21,400. A firm break under 21,300 could send the TSX lower to the 200-day MA near 21,000. A small downtrend is in place and the TSX appears to have completed a five-wave advance from that low in October 2023. The danger point is the TSX falling under 20,400. Under 19,600 new lows below October 2023 are possible. Right now, only regaining 22,200 could suggest higher levels.
U.S. 10-year Treasury Note, Canada 10-year bond CGB
Bond yields ticked up this past week, mostly on the back of the stronger than expected PMI numbers that came out on Friday. The Global Composite PMI, the Manufacturing PMI, and the Services PMI all came in higher than expected on Friday, suggesting business is alive and well in the U.S. That was despite poor retail sales numbers earlier, higher than expected weekly claims numbers, housing sales that fell more than expected, and a falling Conference Board Consumer Confidence.
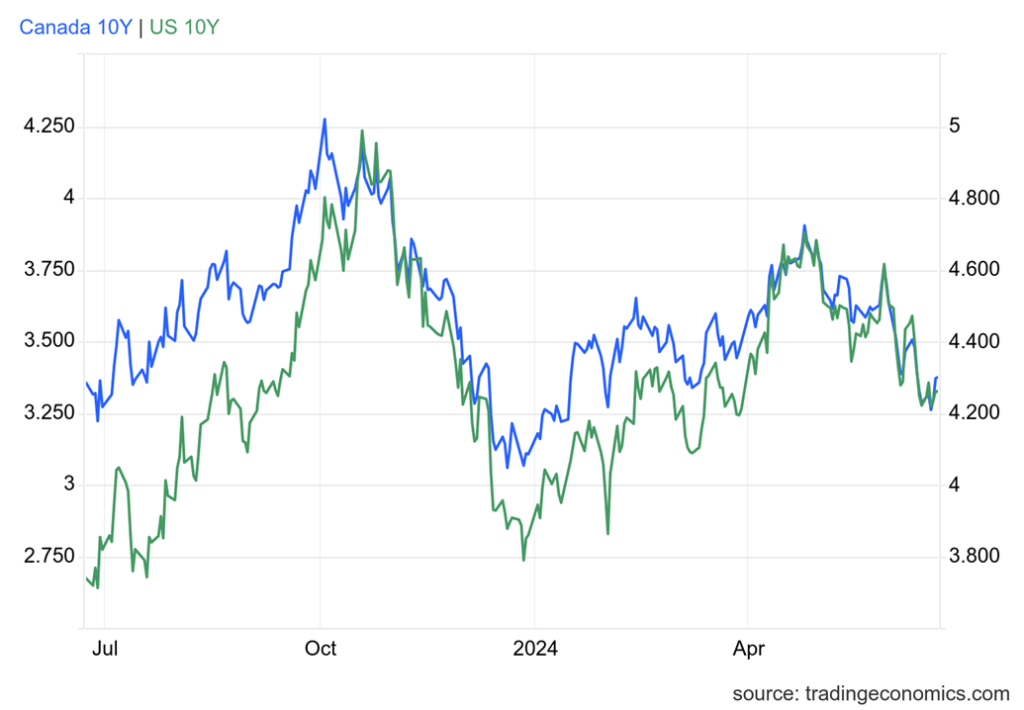
It was the PMI numbers that helped hike rates as the U.S. 10-year treasury note rose to 4.26% from 4.23% and the Government of Canada 10-year bond (CGB) rose to 3.37% from 3.31% the previous week. The inverted yield curve became less inverted as the 2–10 spread in the U.S. dropped to 46 bp from 49 bp and the Canada 2–10 spread fell to 58 bp from 59 bp. Both are still pretty high. Usually by the time a recession starts, the yield curve is close to normalizing. Despite the hike in rates this past week, small as it was, the recent downtrend for rates is still in place.
Maybe there will be more fireworks this coming week with house prices coming out. They are expected to be weaker. The big fireworks will be on Friday when PCE prices are out and GDP for Q1 (final) is out Thursday. GDP is expected to be revised down to 1.3% from 3.4% and PCE prices are expected to be lower. The following week is a holiday week with July 1 in Canada and July 4 in the U.S. On July 5 the June job numbers are out and are also expected to be lower from the lofty numbers of the previous month. Current expectations are 160,000 nonfarm payrolls vs. 272,000 in May.
Many are still expecting the Fed to cut rates in September. Current expectations are 62%. Our expectation is that long bond rates should continue to ease, despite this past week’s uptick.
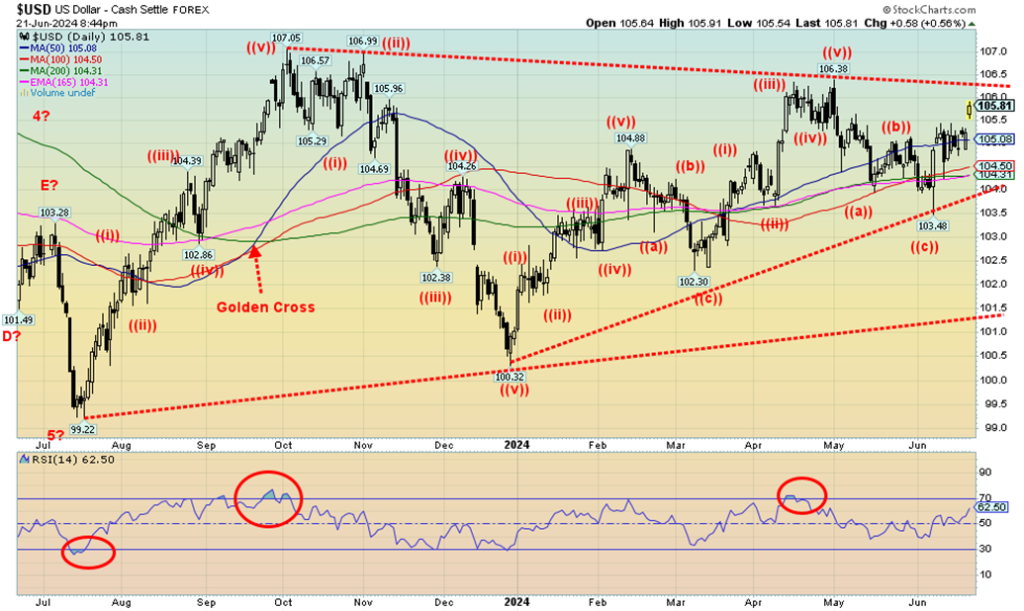
The stronger than expected business activity numbers on Friday helped the US$ Index to jump about 0.6%. On the week, the US$ Index rose 0.3% so Friday saved it. The euro was the main victim, falling 0.1% but it was the sinking Japanese yen that really helped the U.S. dollar. The yen fell 1.4% and continues to be the whipping boy for currencies. It is prompting the BOJ to consider raising interest rates further. The Cdn$ and the Swiss franc both rose 0.3% on the week.
Just above is a potentially significant breakout level near 106.25. We don’t see a major move coming for the US$ Index, but one can’t be ruled out. The U.S. economy, despite showing signs of slowing, is still doing better than other G7 partners. And that encourages capital inflows. The wars are also helping capital inflows into the U.S. Support for USDX is down to 105, then down to 104.30. A breakdown could get underway under 104.
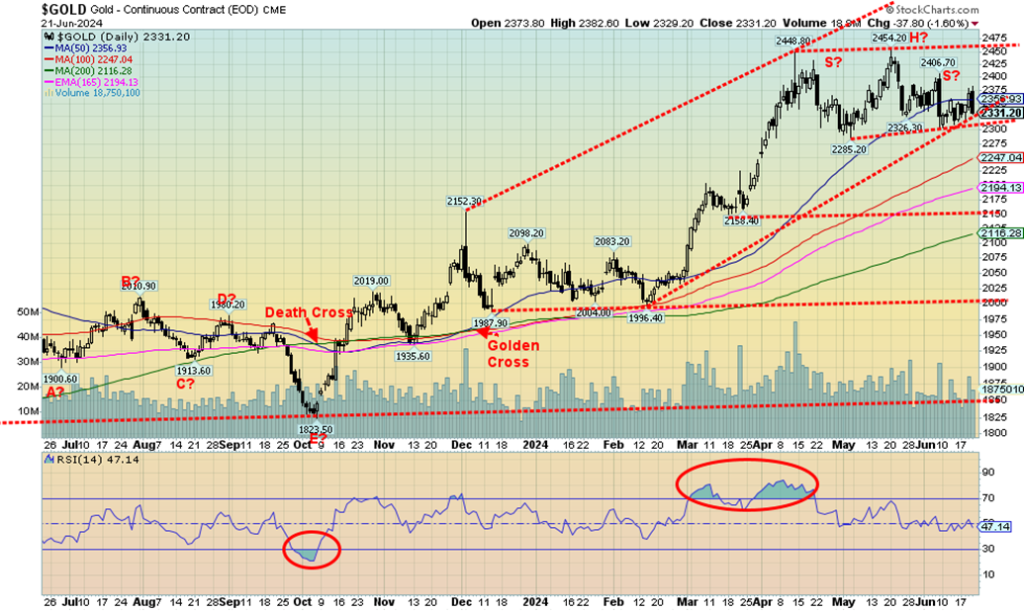
Gold prices faltered this past week as gold fell 0.8% while silver was up barely 0.5%. Platinum rebounded, gaining 3.9%, while the near precious metals saw palladium rise 2.9% but copper fall 1.1%. The past week or two has been volatile with a number of sharp up days followed by sharp down days. That was seen, especially on Thursday and Friday when gold rose over $22 Thursday, then promptly fell $38 on Friday. Feeling whipsawed? Friday was also a reversal day, given a higher high, lower low and lower close. Reversal days are not uncommon but we don’t want to see significant follow-through. Gold continues to suggest a head and shoulders top. A breakdown under $2,300 then could project down to around $2,150.
While poor retail sales and a sliding housing market helped gold rise stronger than expected earlier in the week, the rise in business activity that came out Friday sunk gold prices. Specifically, it was the PMIs that displayed strength, helping the US$ Index and bond yields to rise. That in turn sunk gold. Still there is expectation and optimism that the Fed would cut rates in September. Currently, traders are betting 62% a rate cut in September. Despite Friday’s fall, the expectation is that gold prices (and silver) could continue to rise. Regardless, we can’t rule out a short-term hiccup if $2,300 breaks. Demand remains strong, particularly out of
Asia and from central banks that continue to shore up their gold reserves to strengthen their currency. Central banks cite three strong reasons as to why they are purchasing gold – no default risk, strong performance during a crisis and historical significance. They also cite gold being a long-term store of value, its liquidity, a portfolio diversifier, fear of systemic risks, its use as collateral, no political risk, domestic gold production, a policy tool and concerns about sanctions and trade wars.
So far, $2,300 is holding, but for how much longer? Many analysts continue to see gold rising to $2,500 and $2,600. However, we need to get through this bad patch. A break back above $2,400 would go a long way to satisfy the bulls. However, we must do that before we break $2,300. Nonetheless, the current malaise could continue into July, even if we don’t break $2,300.
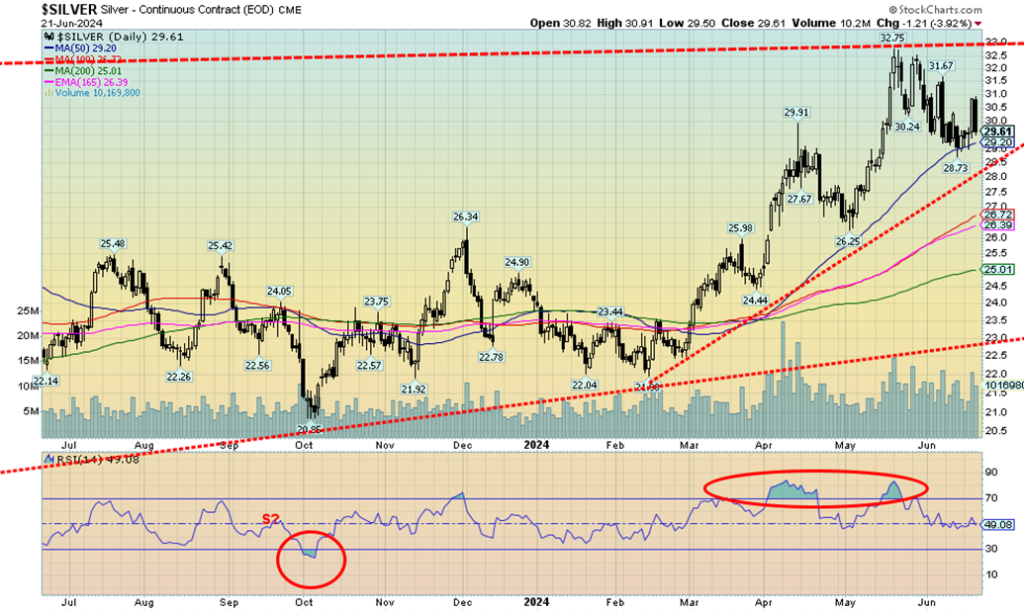
Silver eked out a 0.5% gain on the week, despite Friday’s sharp pullback. Silver lost $1.21 on Friday or 3.9%. Otherwise, it would have been a good week. Silver remains up 22.9% in 2024. So far, silver is finding support at the 50-day MA (currently $29.20) and good support down to $29. But a downtrend is underway and a break under $29 could send silver down to support at $27. Silver should be a lot more bullish, given industrial demand and shortages. But the paper market continues to rule. Like gold, silver may continue the current malaise into July.
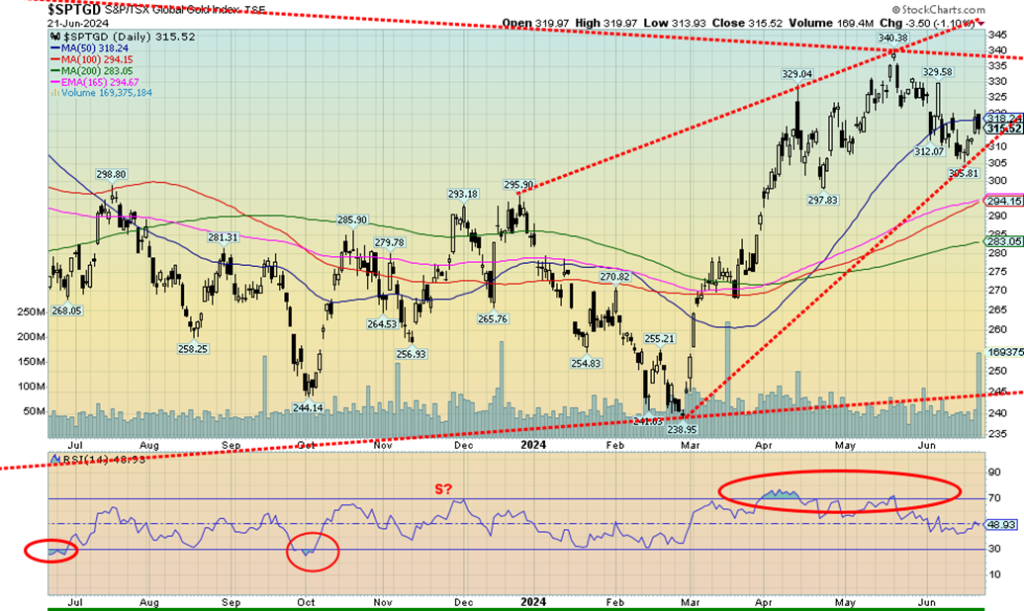
Despite both gold and silver hesitating this past week, the gold stocks actually rose, even after Friday’s drop trimmed some of the gains. The TSX Gold Index (TGD) rose 2.2% while the Gold Bugs Index (HUI) was up 2.0%. We note that the TGD stalled out at the 50-day MA. A firm burst through 318 is required to push the 50-day into the background. Major resistance is up at 340, a level that must fall if we are rise further.
A successful break above 340 could target over 500 and new all-time highs for the TGD. The junior mining market remains moribund as the TSX Venture Exchange (CDNX) remains down over 80% from highs dating back to 2007. The CDNX is down almost 50% from highs seen in 2021. The lament is that companies with real assets and potential continue to be ignored for meme stocks, AI stocks, and cryptos. That makes them cheap but doesn’t do a lot for price appreciation, at least not yet.
The TGD could break support under 310, but better support lies at 290/294 then down 283. Under 270, the market breaks down completely. The reality is, we need to break above 340 to keep this going.
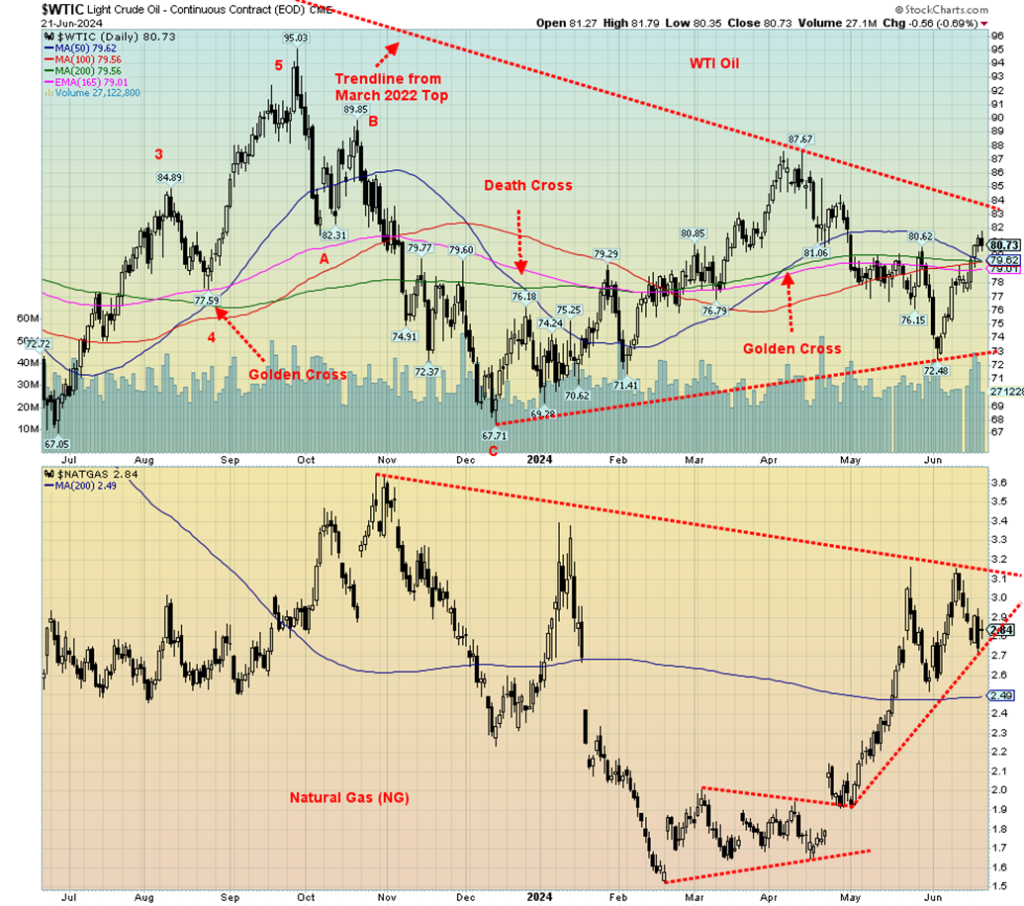
WTI oil finally broke above $80. Except it wasn’t a burst; it was more like a creepy crawler. We have moved above the key MAs of 50, 100, and 200-day. But a more important line of resistance lies just above at $83/$84. We note that volume has picked up. Helping this bullish sentiment are a number of things.
First, there has been a pick-up in demand; second, hurricane season is getting underway and the prediction is that it could be a difficult season; third, both U.S. crude and gasoline inventories fell this past week; fourth, heat waves in the southwest and northeast are pressing demand, particularly for AC; and fifth, geopolitical risk has picked up with the widening war vs. Hezbollah plus threats that Syria and Iraq could come into play, and Iran is somewhere in the background.
On the week, WTI Oil rose 3.4%, Brent crude was up 2.1%. Natural gas (NG) did not fare as well as NG at the Henry Hub fell 1.4% while at the EU Dutch Hub it was off 4.3%. There is ample storage at the hubs and demand hasn’t drained them much.
But potential tightening is in the background, particularly concerns about Russian supplies that are being blocked and Asian demand taking supply away from the EU. Production has ramped up in the U.S., bringing prices down a bit in the midst of severe heat waves. There are also droughts in the Southwest and severe flooding in the Eastern coastal regions down to Florida.
The energy stocks rose, but not by a lot. The Arca Oil & Gas Index (XOI) was up 1.6% while the TSX Energy Index (TEN) rose 0.4%.
As noted, big resistance lies above at $83/$84. For NG, resistance is seen at $3/$3.10. NG has good support down to $2.40. For WTI oil, support is at $79 but a breakdown under $77 could signal the end of the uptrend.
Expect the uptrends for oil and NG to continue into July. However, it won’t be straight up unless an event takes place.
__
(Featured image by Nicholas Cappello via Unsplash)
DISCLAIMER: This article was written by a third party contributor and does not reflect the opinion of Born2Invest, its management, staff or its associates. Please review our disclaimer for more information.
This article may include forward-looking statements. These forward-looking statements generally are identified by the words “believe,” “project,” “estimate,” “become,” “plan,” “will,” and similar expressions. These forward-looking statements involve known and unknown risks as well as uncertainties, including those discussed in the following cautionary statements and elsewhere in this article and on this site. Although the Company may believe that its expectations are based on reasonable assumptions, the actual results that the Company may achieve may differ materially from any forward-looking statements, which reflect the opinions of the management of the Company only as of the date hereof. Additionally, please make sure to read these important disclosures.
Copyright David Chapman 2024
David Chapman is not a registered advisory service and is not an exempt market dealer (EMD) nor a licensed financial advisor. He does not and cannot give individualised market advice. David Chapman has worked in the financial industry for over 40 years including large financial corporations, banks, and investment dealers. The information in this newsletter is intended only for informational and educational purposes. It should not be construed as an offer, a solicitation of an offer or sale of any security. Every effort is made to provide accurate and complete information.
However, we cannot guarantee that there will be no errors. We make no claims, promises or guarantees about the accuracy, completeness, or adequacy of the contents of this commentary and expressly disclaim liability for errors and omissions in the contents of this commentary. David Chapman will always use his best efforts to ensure the accuracy and timeliness of all information. The reader assumes all risk when trading in securities and David Chapman advises consulting a licensed professional financial advisor or portfolio manager such as Enriched Investing Incorporated before proceeding with any trade or idea presented in this newsletter.
David Chapman may own shares in companies mentioned in this newsletter. Before making an investment, prospective investors should review each security’s offering documents which summarize the objectives, fees, expenses and associated risks. David Chapman shares his ideas and opinions for informational and educational purposes only and expects the reader to perform due diligence before considering a position in any security. That includes consulting with your own licensed professional financial advisor such as Enriched Investing Incorporated. Performance is not guaranteed, values change frequently, and past performance may not be repeated.


Why 2026 Could Mark a Turning Point for Sustainability
Amid geopolitical crises and climate pressures, companies must seek alternative strategies, as sustainability becomes a key driver of value. By...


Dow Jones Rebounds as Markets Shrug Off Iran Conflict
A shortened trading week saw the Dow Jones rebound from a 10 percent correction, closing between key BEV levels. Outlook...


Iran War Drives Oil Surge and Rising Financial Risks
The war continues pushing oil prices higher, with Brent above 140 while futures lag. Energy stocks weakened despite highs. Headline...


TopRanked.io Weekly Affiliate Digest: What’s Hot in Affiliate Marketing [Bovada Affiliate Program]
This week, we're mashing up 80s tech with 2020s private messaging apps. Why? Because Big Tech just dropped a big...


Euro Stablecoins Struggle to Compete with Dollar Dominance in Crypto Markets
Euro stablecoins remain marginal despite the euro’s global importance, with minimal trading volume compared to dollar rivals like USDT and...
 |
|
 |  |
 |
|
-

 Cannabis5 days ago
Lowryder: The Autoflowering Revolution in Cannabis Cultivation
-

 Biotech2 weeks ago
SPECT-CT: Advanced Imaging for Precise Cardiac Assessment
-
 Impact Investing9 hours ago
Why 2026 Could Mark a Turning Point for Sustainability
-
 Business1 week ago
TopRanked.io Weekly Affiliate Digest: What’s Hot in Affiliate Marketing [1xBet Affiliate Program]