Markets
Markets Are Looking Iffy, but That’s Seasonal
The markets appear to be rolling over. It was noted there have been three seminal events since 2000 – 9/11, the 2008 financial crisis and the 2020 pandemic. Each one resulted in a changed world both economically and politically. Each one sparked a stock market crash. Could a fourth turning be coming? But what? Where? A black swan event like the Moroccan earthquake? We provide our take.

We recently read an interesting article about markets posted by John Maudlin of Maudlin Economics (www.maudlineconomics.com) from Michael Lewitt who posts on The Credit Strategist (www.thecreditstrategist.com), titled “This is Later” (September 3, 2023). Mr. Lewitt outlines three seminal events that have occurred since 2000 that have changed the course of history. They are: the 9/11 attacks, the 2008 financial crisis, and the COVID-19 pandemic of 2020–2021. All black swan events.
After each event, not only did we see things change in the markets, but each crisis was met with a historical drop in interest rates and the provision of huge quantities of liquidity (monetary policy) to the market through quantitative easing (QE). There was also a huge increase in debt from government (fiscal policy), corporations, and households, the latter two following an initial decline. We’ve also witnessed a huge shift in politics with the rise of authoritarian governments and a concurrent rise in corruption and a decline in governance.
The Rise of U.S. Government Debt and All Debt 2000–2023
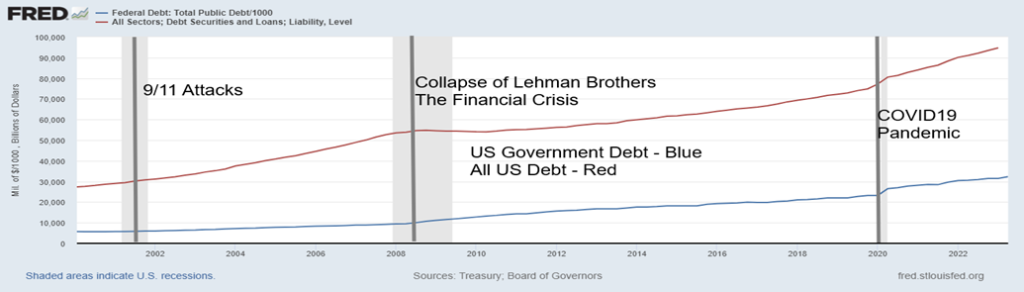
We have no doubt that those three events were seminal, unleashing societal change that has had a significant impact. Add in global warming and the rise in extreme weather events and sometimes we feel like a ship in the dark during a storm that is perched to crash into the rocks. We summarize those three events in our table on the next page, outlining what happened and how it impacted the growth of money (U.S. M1), Fed funds (U.S.), the U.S. 10-year treasury note, the U.S. 30-year mortgage, the U.S. stock market (S&P 500), housing prices (U.S. Case Shiller), and gold.
While the comments pertain to the U.S., the same scenario could be applied to any of the developed countries, including Canada and the EU. The period also saw the emergence of China and India as global economic powerhouses and the creation of BRICS (Brazil, Russia, India, China, South Africa) as an alternative to the G7 (U.S., U.K., Germany, France, Italy, Canada, Japan). BRICS is in the process of adding more members. The rise of BRICS was a direct response to U.S. global hegemony and to its military might as a part of NATO.
Since 2000, M1 has soared an unprecedented 1,544%. At the other extreme, the yield on the 10-year U.S. treasury note is 33.3% lower than where it was in 2000. Our small table below summarizes the returns for the table on the next page since 2000.
| Return since 2000 | |
| Gold | 571.3% |
| S&P 500 | 202.7% |
| U.S. M1 | 1,543.8% |
| Fed rate | 0.57% |
| U.S. 10-year | (33.3%) |
| U.S. 30-year mortgage | (10.9%) |
| Case Shiller House 20-City Index | 209.1% |
Inflation has been steadily rising throughout and in all is up 80.3% since 2000. That includes a rise of 18% since 2020. For the record, oil prices are up 242% since 2000. Rising oil prices have been a major contributor to inflation, along with supply disruptions and droughts, putting significant pressure on food prices as well. Note how all have outpaced inflation except for yields on mortgages, treasuries, and the Fed funds rate (bank rate).
The world has gone through a series of financial crises since the gold standard was ended in August 1971 and the Bretton Woods monetary system that was to stabilize the world after World War II was over by 1973. Since then, besides the three seminal crises we noted, we also went through the following: the Arab Oil Embargo in 1973–1974, the Iran oil crisis (hostage taking) in 1979, the recession of 1980–1982, the Latin American debt crisis in the early 1980s, the October 19, 1987 stock market crash, the Savings & Loan crisis, the Mexican peso crisis 1994, the Asian financial crisis 1997, the Russian financial crisis and Long-Term Capital Management L.P. (LTCM) collapse 1998, another Latin American debt crisis in the late 1990s, and the dot.com bubble and collapse in 2000. The ones that stand out as game changers and qualify as black swan events are the energy crisis of the 1970s, Black Monday, October 19, 1987, and the Russian financial crisis and LTCM collapse 1998.
| Event | What happened | M1 | Fed funds | U.S. 10-year Treasury | 30-year mortgage | Stock market | Housing prices (Case Shiller) | Gold |
| 9/11 attacks | Growth of surveillance state; rising costs; Afghan and Iraq wars; destabilization of Middle East; Recession 2001–2002, unemployment 6.3%, GDP -.3%, stock market -49% | M1 +12% Sept 2001 to Oct 2007 | FF fell from 3.07% Sep 2001 to 1.03% Jun 2004, rising to 5.26% Jul 2007 | 10-Y fell from 4.60% Sep 2001 to 3.37% May 2003 rising to 5.16% Jun 2006 | 30-Y fell from 6.72% Sep 2001 to 5.24% Jul 2003, rising to 6.78% Jul 2006 | SPX fell from 1155 Sep 2001 to 768 Oct 2002 rising to 1576 Oct 2007 | Case Shiller 20-Y rose from 119 Sept 2001 to 207 Apr 2006, then fell to 137 Feb 2012 | Gold rose from $292 in Sep 2001 to a peak of $1033 Mar 2008, then fell to $681 by Oct 2008 |
| 2008 Financial Crisis | Unleashing of unprecedented monetary and fiscal policy stimuli; rise of global debt; rising regulation; Recession 2007–2009, unemployment 10.0%, GDP -5.1%, stock market -57% | M1 +212% Oct 2007-Feb 2020 | FF fell from 5.26% Jul 2007 to 0.07% Feb 2014, rising to 2.42% Jul 2019 | 10-Y fell from 5.16% Jun 2006 to 1.46% Jul 2016, rising to 3.15% Oct 2018 | 30-Y fell from 6.78% Jul 2006 to 3.32% Nov 2013, rising to 4.86% Oct 2018 | SPX fell from 1576 Oct 2007 to 667 Mar 2009, rising to 3394 Feb 2020 | Case Shiller 20-Y rose 137 Feb 2012 to 315 Jun 2022, present 310 | Gold rose to $1924 Sep 2011, then fell to $1045 Dec 2015, rising to $1704 Mar 20 |
| Pandemic | Extraordinary unleashing of monetary and fiscal policy stimuli; unprecedented financial bubble in stocks, housing, and more; global disruption of economy; rising inflation; Recession 2020, unemployment 14.7%, GDP -19.2%, stock market -34% | M1 +377% Feb 2020-Present | FF fell from 2.42% Jul 2019 to 0.05% Apr 2020, rose to 5.33% today | 10-Y fell from 3.15% Oct 2018 to 0.55% Jul 2020, rising to 4.27% present | 30-Y fell from 4.86% Oct 2018 to 2.67% Dec 2020, rising to 7.18% present | SPX fell from 3394 Feb 2020 to 2192 Mar 2020, rising to 4818 Jan 2022 present 4460 | Case Shiller 20-Y 222 in Feb 2020, rising to 315 Jun 2022 present 310 | Gold fell to $1450 Mar 2020, then rose to $2089 Aug 2020, falling to $1618 Nov 2022 present $1950 |
The three seminal events in the markets noted above were major game-changers. But other crises have occurred since 2000, including the energy crisis in the early 2000s as a result of a major surge in demand from Asia, particularly China, the EU debt crisis that lasted roughly from 2009–2019, and the Russia/Ukraine war in 2014–present. Stock market crashes included China’s crash in 2008 and again in 2015 and the COVID-19 pandemic crash of March 2020. As well, there was gold’s crash in April 2013. Oil crashed in 2008 and again during the pandemic in 2020.
The next financial crisis is currently brewing. When the financial crisis of 2008 happened, triggered by the collapse of Lehman Brothers and the sub-prime mortgage market, the world’s central banks and Western governments scrambled to ensure the system did not collapse. Without their largesse, we’d most likely have entered a long depression. The same thing happened during COVID. While every country dealt with the pandemic in different ways, with some countries faring better than others, once again the West’s central banks and governments came to the rescue with bail-outs, backstops, and money to stench the bleeding and the rapidly rising unemployment rate. Again, failure to do so most likely would have resulted in a global depression. To a lesser extent, the same was carried out after the 9/11 attacks.
But easy credit, QE, and massive amounts of bailouts provided by governments resulted in bubbles: housing 2006 and 2020–2022, stocks 2020–2022, cryptocurrencies 2017 and then again in 2021–2022, the uranium bubble of 2007, meme stocks led by the Redditt bubble of 2021, cannabis stocks, Shanghai Index 2006–2007 and again in 2015. More recently there was the AI stocks bubble, led by Nvidia. There were more. Bubbles have also occurred in student loans, government debt, bonds, unfunded liabilities of pension funds, M1 and M2 money supply, and venture capital. It seems the lessons of past bubbles, like the Japanese equity market of the 1980s or the dot.com bubble of the late 1990s, or for that matter, the stock market bubble of the 1920’s are never really learned. Too much money chasing too few assets, fueled by easy credit and oodles of cash supplied by central banks and governments. History shows that there has never been a bubble that hasn’t burst. Some, like the 1920s stock market bubble, ended in a global depression and banking collapse. Since then, central banks and governments have been trying to prevent another one and the resultant social unrest. But each crisis begets another crisis.
No, this time is not different, just the circumstances. While dangers lie in the banking system, banks are regulated. The real dangers undoubtedly lie in the shadow banking system of hedge funds, private equity, insurance companies, pension funds, mortgage lenders, investment banks. Recall how the Bank of England (BOE) had to bail out the U.K. pension funds in 2022. Hedge funds like Madoff and Archegos are recent examples of busts in the hedge fund industry. It is estimated that over half of global assets are in shadow banks, not just in the U.S. but also in Canada, the EU, China, and other Asian countries. Derivatives such as interest rate swaps, credit default swaps, foreign exchange, futures, options, equity swaps, commodity swaps, and more are a quadrillion-dollar global market. Not all is at risk as the size is notional, not real like loans and securities. But the key is that the shadow banking system is largely unregulated. We’ve used these examples before, but LTCM and AIG Insurance, along with Lehman Brothers, almost brought down the global financial system in 1998 and 2008.
The dangers in the markets are growing and voices are warning. But are we paying attention? Is a fourth turning coming to add to 9/11, the financial crisis, and the pandemic? The days of easy credit are over as central banks raise interest rates, money supply falls, delinquencies and bankruptcies rise, and banks tighten credit. What we just witnessed was a 5,000-year low in interest rates. The odds of seeing that again are probably nil. Central banks and governments are running out of bullets if another financial collapse occurs. Remember bail-ins, not bail-outs. Add in an ongoing war between Russia/Ukraine that could expand, the tension between the U.S. and China, polarizing tension, particularly in the U.S. with a potentially volatile election in 2024, rising oil prices, and COVID once again rising, along with extreme weather events and we have a witches’ brew that could boil over, deluging the global economy.
We’re tempted to say “fasten your seatbelts; it’s going to be a bumpy night” (Margo Channing, played by Bette Davis in the film All About Eve, 1950).
Canada Job Numbers
Employed Persons, Unemployed Persons 2018–2023
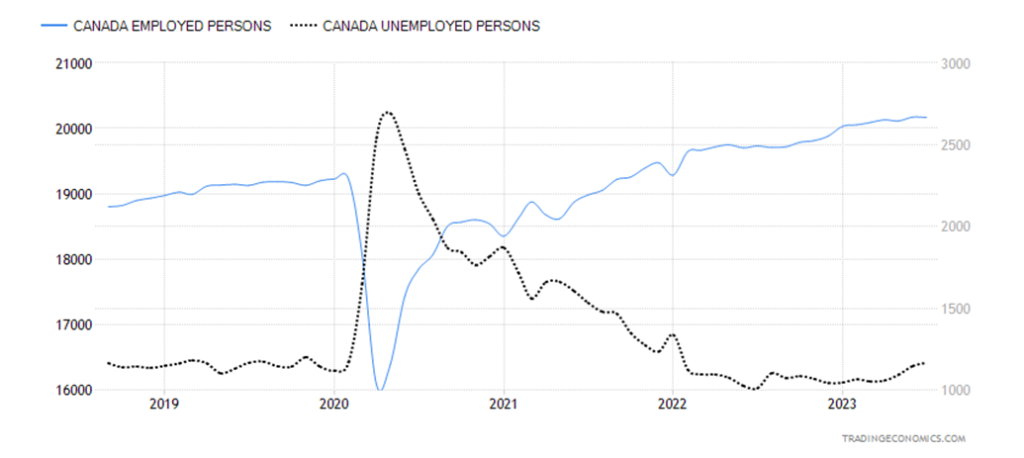
Surprise, surprise. Canada added jobs in August. They added 39,900 jobs, well above the expected 15,000 and definitely better than July’s loss of 6,400 jobs. The unemployment rate stayed steady at 5.5%, despite a rise of some 19,700 unemployed persons and a fall of 6,400 employed persons. The R8 unemployment rate, which adds in discouraged searchers plus the waiting group of involuntary part-timers, fell to 8.2% from 8.5%. This was mostly because of an additional 103,000 in the labor force and of that 54,200 looking for work. That in turn helped push the labor force participation rate to 65.5% in August from 65.6% in July. The employment-population ratio fell to 61.9% from 62.0%. The population gains are the seventh straight month that the labor force has grown faster than number of jobs. Full-time employment jumped 32,200 while part-time employment was up 7,800. Pressure continues on wage increases as average hourly earnings rose 5.2% year-over-year (y-o-y) vs. 5.0% the previous month.
We suppose we could call this good news/bad news. Good news, a big jump in jobs. The bad news, more people joined the labor force and are looking for work as employers are winding down their hiring. Construction, we read, is crying out for workers. A lack of workers is not going to help get houses built. Add in interest rates that are higher than what people are used to, growing mortgage delinquencies, banks tightening lending, and housing prices still in the stratosphere, and we have a growing problem. As we have noted, it is estimated that Canadian house prices are still overvalued by at least 30%.
With the economy still creating jobs, plus continued wage gains, this will continue to put pressure on the Bank of Canada (BofC) as to further interest rate hikes. The two-year Government of Canada bond rose to 4.63% from 4.61%. A decent report, but the next BofC interest rate decision is not until October 23, so by that time, we’ll also have the September labor force statistics.
Chart of the Week
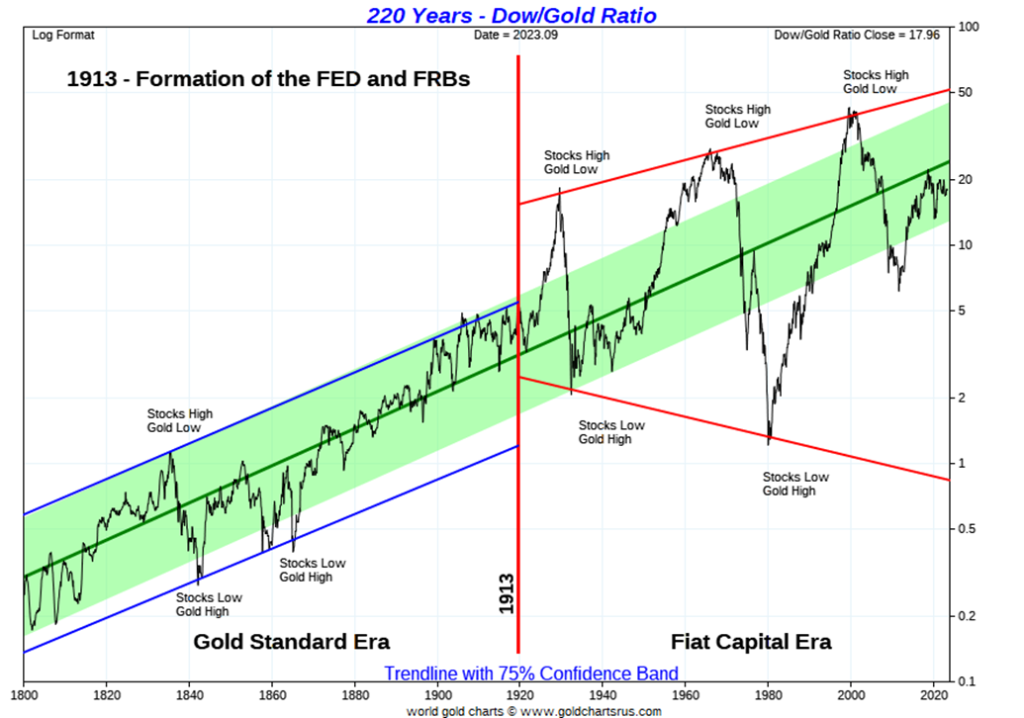
The Dow/Gold ratio has long been followed by market technicians. The ratio tells us when one should own equities and when one should own gold (and, by extension, gold stocks). The index is also a measure of paper claims on productive hard assets. When the ratio is high, it reflects a boom in equities. At highs, equities are expensive and gold is cheap. It is the opposite when the ratio is at its low. It’s a bust, where equities are cheap and gold expensive.
The last peak for the Dow/Gold was 1999 when the ratio hit the lofty level of 39.61. While the markets didn’t actually peak until early 2000, it proved to be the top of the great dot.com/high-tech bubble. It was a long period of excessive liquidity, excessive credit, and huge overvaluations of equities—everyone, even the stockroom person and the taxi driver, were pouring into equities. Week after week it was another tech stock with no assets hitting huge P/E multiples. It was a heady period. Then it blew up.
The dot.com crash of 2000–2002 was later followed by a housing bubble, then the financial crisis in 2008 when it all came tumbling down. But the Dow/Gold ratio never hit the depths of 1980. In 1980 it was the opposite—no one, it seemed, wanted to own stocks, interest rates were high, the Fed, tightening to combat inflation, sucked liquidity out of the market, banks clammed up on credit, and valuations were the lowest seen since the Great Depression. Gold soared to $875/ounce. On an inflation-adjusted basis, gold has never reached that height since.
After the financial crisis of 2008, gold did soar. The growing liquidity and easing of credit helped lead to a big rise in gold, but it topped out in 2011. Gold has never had it so good since. The markets roared back and, despite a setback when the pandemic hit in 2020, excess liquidity and easy credit led to not only an equities boom but another very overvalued stock market, led by the AI tech stocks. While the markets set new highs, the Dow/Gold ratio did not—a divergence. Gold struggled and crashed in 2013, leading to a low in 2015 down 46% from the 2011 high. Since then, gold has been rising but the Dow/Gold ratio has not fallen to the levels seen in 1980, let alone the levels seen in 1932.
The Fed has been tightening, liquidity is not what it was going into the high of 2022, valuations have fallen but have not crashed, and many remain in the stock market, believing that once again it will rise to unheard-of heights. Probably not.
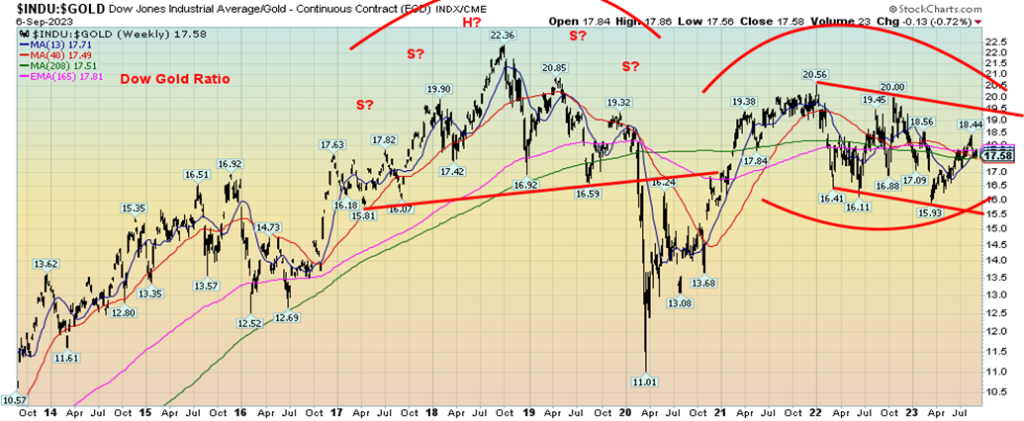
Our second chart of the Dow/Gold over the past ten years shows the ratio is rolling over. It failed to reach the levels of 2019 when we saw the last peak just before the pandemic hit. And since the pandemic, despite excessive liquidity, easy credit, and AI stocks hitting extreme valuations, the Dow/Gold ratio has never reached previous heights. The ratio is trying to tell us something. The current growing crisis is still not resolved and our expectations are that the Dow/Gold ratio has a lot further to fall before nobody wants to even hear the word stock and valuations are trading around rock bottom. Or, conversely, gold soars to unheard-of levels.
We can’t help but notice that P/E levels remain higher today than they were in at the time of the financial crisis of 2008. Margin debt is down, but remains at lofty levels. And while banks are tightening, delinquencies and defaults have still not become a rush.
We appear to be forming some sort of descending triangle. If the ratio breaks under 15.5, the decline could be to targets near 10.9. Holding gold steady at $1,950, it could imply the Dow Jones Industrials (DJI) falling to 21,250 zone, a fall of 38% from current levels. Only new highs above 20.0 could negate this trend.
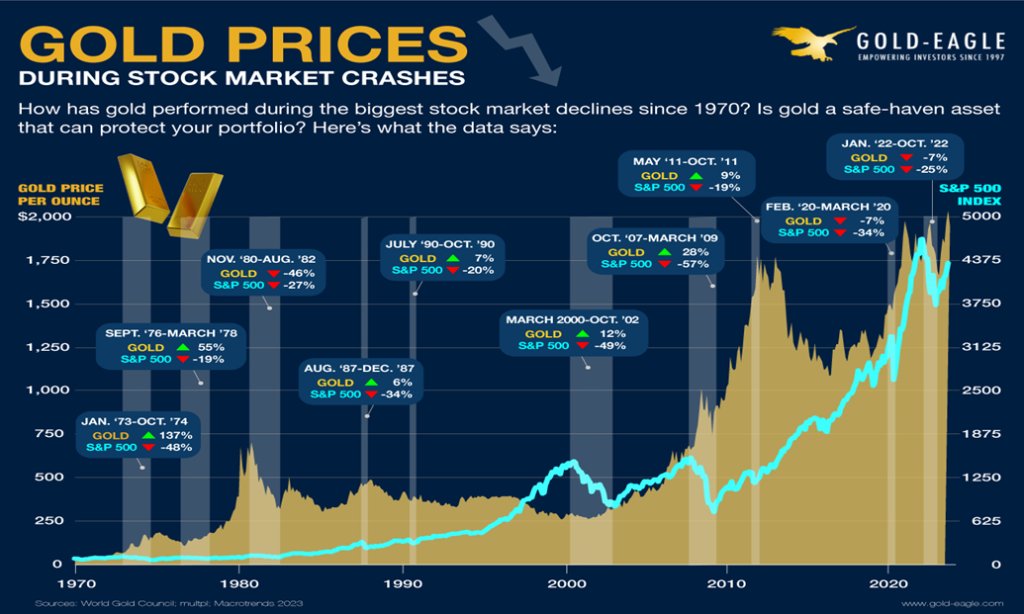
We have two charts below. One shows the Dow/Gold ratio over the past ten years while the second chart, which we found on Gold Eagle (www.gold-eagle.com), shows how gold performs during market crashes. Note that this refers to the metal, not the gold stocks, which can often fall with the stock market. Hence, why it pays to hold some gold in one’s portfolio. Even central banks continue to buy and hold some 35,175 metric tonnes. Amongst the biggest central bank buyers have been China and Russia, the leaders of the BRICS. That amount of gold is about 20% of all the gold ever mined. Curiously, the Bank of Canada sold all of its gold back in 2016. The World Gold Council (www.gold.org) maintains excellent statistics on gold.
It might pay to own a bit of gold (the commodity, not the gold stocks) in one’s portfolio.
Markets & Trends
| % Gains (Losses) Trends | ||||||||
| Close Dec 31/22 | Close Sep 8, 2023 | Week | YTD | Daily (Short Term) | Weekly (Intermediate) | Monthly (Long Term) | ||
| Stock Market Indices | ||||||||
| S&P 500 | 3,839.50 | 4,457.49 | (1.3)% | 16.1% | down (weak) | up | up | |
| Dow Jones Industrials | 33,147.25 | 34,576.69 | (0.8)% | 4.3% | down | up | up | |
| Dow Jones Transport | 13,391.91 | 15,208.43 | (4.0)% | 13.6% | down | up | up | |
| NASDAQ | 10,466.48 | 13,761.53 | (1.9)% | 31.5% | down (weak) | up | up | |
| S&P/TSX Composite | 19,384.92 | 20,074.65 | (2.3)% | 3.6% | down (weak) | up | up | |
| S&P/TSX Venture (CDNX) | 570.27 | 581.13 | (1.8)% | 1.9% | down | down | down | |
| S&P 600 (small) | 1,157.53 | 1,185.50 | (4.3)% | 2.4% | down | neutral | neutral | |
| MSCI World | 1,977.74 | 2,093.87 | (1.5)% | 5.9% | down | neutral | neutral | |
| Bitcoin | 16,531.31 | 25,864.81 | 1.1% | 56.5% | down | neutral | neutral | |
| Gold Mining Stock Indices | ||||||||
| Gold Bugs Index (HUI) | 229.75 | 218.96 | (3.0)% | (4.7)% | down | down | down | |
| TSX Gold Index (TGD) | 277.68 | 268.22 | (2.3)% | (3.4)% | down | down | down | |
| % | ||||||||
| U.S. 10-Year Treasury Bond yield | 3.88% | 4.26% | 1.9% | 9.8% | ||||
| Cdn. 10-Year Bond CGB yield | 3.29% | 3.65% | 2.2% | 10.9% | ||||
| Recession Watch Spreads | ||||||||
| U.S. 2-year 10-year Treasury spread | (0.55)% | (0.73)% | (5.8)% | (32.7)% | ||||
| Cdn 2-year 10-year CGB spread | (0.76)% | (0.99)% | (1.0)% | (30.3)% | ||||
| Currencies | ||||||||
| US$ Index | 103.27 | 105.06 | 0.8% | 1.0% | up | up | up | |
| Canadian $ | 73.92 | 73.30 | (0.3)% | (0.5)% | down | down | down | |
| Euro | 107.04 | 107.01 | (0.7)% | 0.7% | down | down | down (weak) | |
| Swiss Franc | 108.15 | 111.97 | (0.8)% | 4.4% | down | up (weak) | up | |
| British Pound | 120.96 | 124.62 | (1.0)% | 3.0% | down | neutral | neutral | |
| Japanese Yen | 76.27 | 67.64 | (1.1)% | (11.3)% | down | down | down | |
| Precious Metals | ||||||||
| Gold | 1,826.20 | 1,942.70 | (1.2)% | 6.4% | down (weak) | neutral | up | |
| Silver | 24.04 | 23.17 | (5.7)% | (3.6)% | down | neutral | neutral | |
| Platinum | 1,082.90 | 894.80 | (7.6)% | (17.4)% | down | down | down | |
| Base Metals | ||||||||
| Palladium | 1,798.00 | 1,192.3 | (2.9)% | (33.7)% | down | down | down | |
| Copper | 3.81 | 3.72 | (3.4)% | (2.4)% | down | down | neutral | |
| Energy | ||||||||
| WTI Oil | 80.26 | 87.51 | 2.3% | 9.0% | up | up | up | |
| Nat Gas | 4.48 | 2.61 | (5.8)% | (41.9)% | down (weak) | down (weak) | down | |
New highs/lows refer to new 52-week highs/lows and, in some cases, all-time highs.
It was truly a lousy week unless you were long oil. We had trouble finding anyone or anything that was up this past week. Except for oil prices. The S&P 500 fell 1.3%, the Dow Jones Industrials (DJI) was down 0.8%, the Dow Jones Transportations (DJT) was worse, down 4.0% (rising oil prices?), while the NASDAQ fell 1.9%. The S&P 400 (Mid) dropped 3.6% while the S&P 600 (Small) fell 4.3% and is turning quite negative. As we noted in our main essay, we are worried something is amiss.
In Canada, the TSX Composite fell 2.3% and the TSX Venture Exchange (CDNX) dropped 1.8%. In the EU, the London FTSE was down 0.3%, the EuroNext fell 1.1%, the Paris CAC 40 dropped 1.6%, and the German DAX was off 0.6%. In Asia, China’s Shanghai Index (SSEC) fell 0.5%, the Tokyo Nikkei Dow (TKN) dropped 0.3%, while Hong Kong’s Hang Seng (HSI) fell 1.0%. The MSCI World Index fell 1.5%. Bitcoin was a winner, up 1.1%, but remained under $26,000 and is still pointed down.
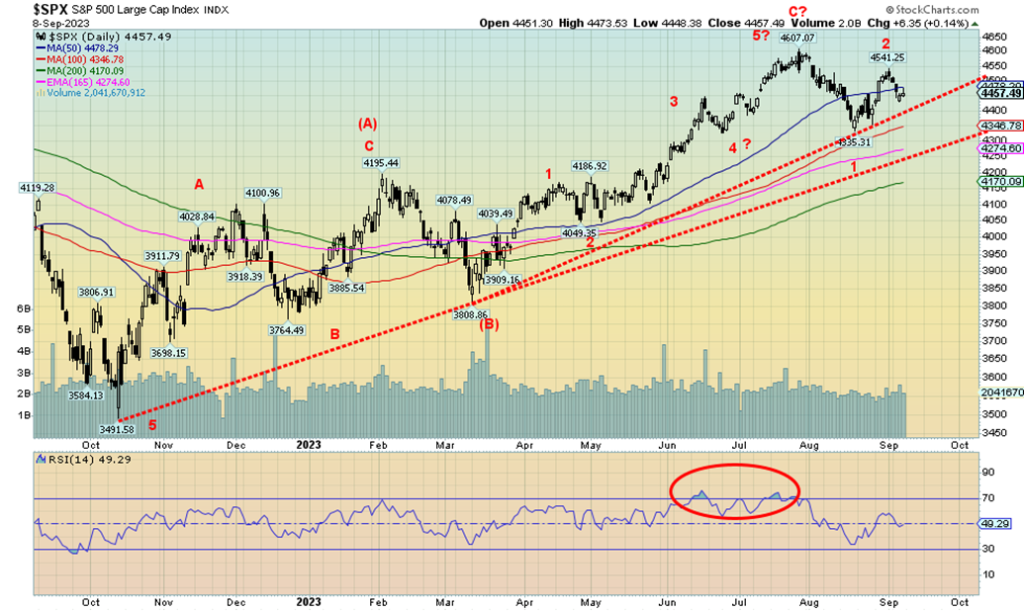
Indicators we follow are turning negative and the sentiment is bearish at worst, neutral at best. The S&P 500 fell under the 50-day MA this past week. The next good support is at 4,440 but if that breaks, we could fall swiftly to 4,300. Once under 4,300 we could be starting a bear market. The failure to see new highs above 4,607 could be termed just that—a failure. Potential targets, once we see new lows below 4,355 and definitely under 4,335, could target down to 4,100, a drop of 7-8% from current levels. That’s a minimum target. We see support near 4,050. The 200-day MA is near 4,170.
September is notorious for being the worst month, with the lows usually coming in October or as late as November. October starts the best six months. And then shortly after that, it’s buy when it snows, sell when it goes.
On an Elliott wave basis, it looks like we had minor wave 1 bottom at 4,335 and minor wave 2 topped at 4,541. If that’s correct, we are now starting the third wave down. The third wave tends to be the biggest. We are seeing similar patterns on other U.S. indices. The DJT continues to look quite negative. Rising oil prices are negatively impacting the DJT.
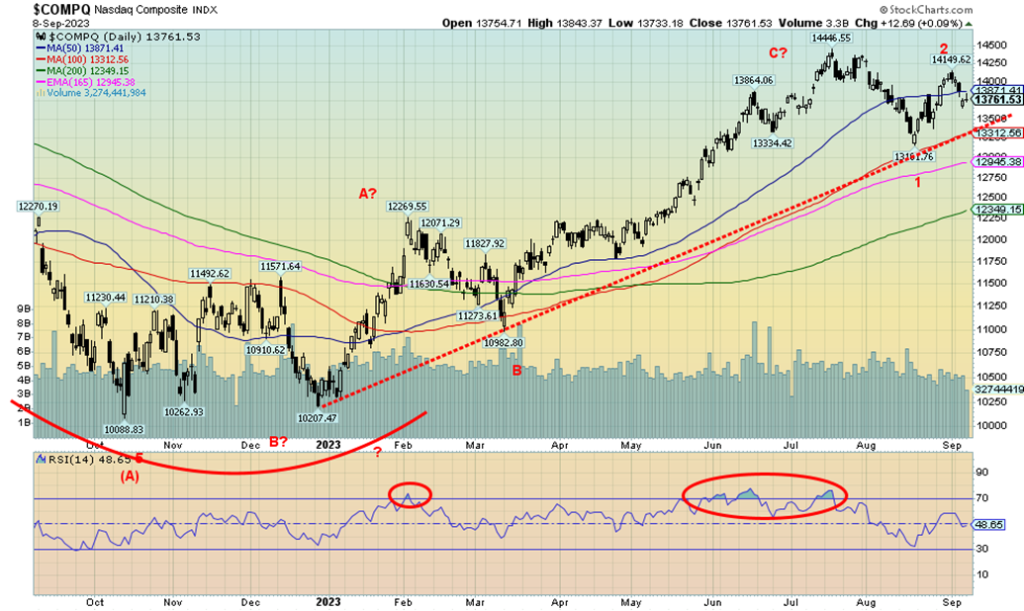
The NASDAQ, like the S&P 500, is rolling over, having failed to make new highs above 14,446. We call these a failure and, once new lows are below 13,162, the recent low potential targets become 12,100/12,200, a decline of over 12% from current levels. Another key point is 11,100 where, below that level, new lows below the October 2022 low become possible. Support is seen around 13,500 and then down to 12,400 and the 200-day MA. The short-term trend has turned down but is still weak. Another down week would turn the index firmly down. Numerous sell signals are being seen. The NY FANG Index, which is a component of the NASDAQ, was down only 0.6% this past week, thanks to a number of the components actually being up small on the week. Snowflake was the best, up 5.7%, but we note Apple gapped down this week and was off on the week by 6.0%. If Apple goes, the rest could follow. It is not out of the question that the NASDAQ could recoup here and move above the recent high of 14,150. But we gapped down small on Thursday, so we suspect our top is in. A break of 13,300 would confirm the top.
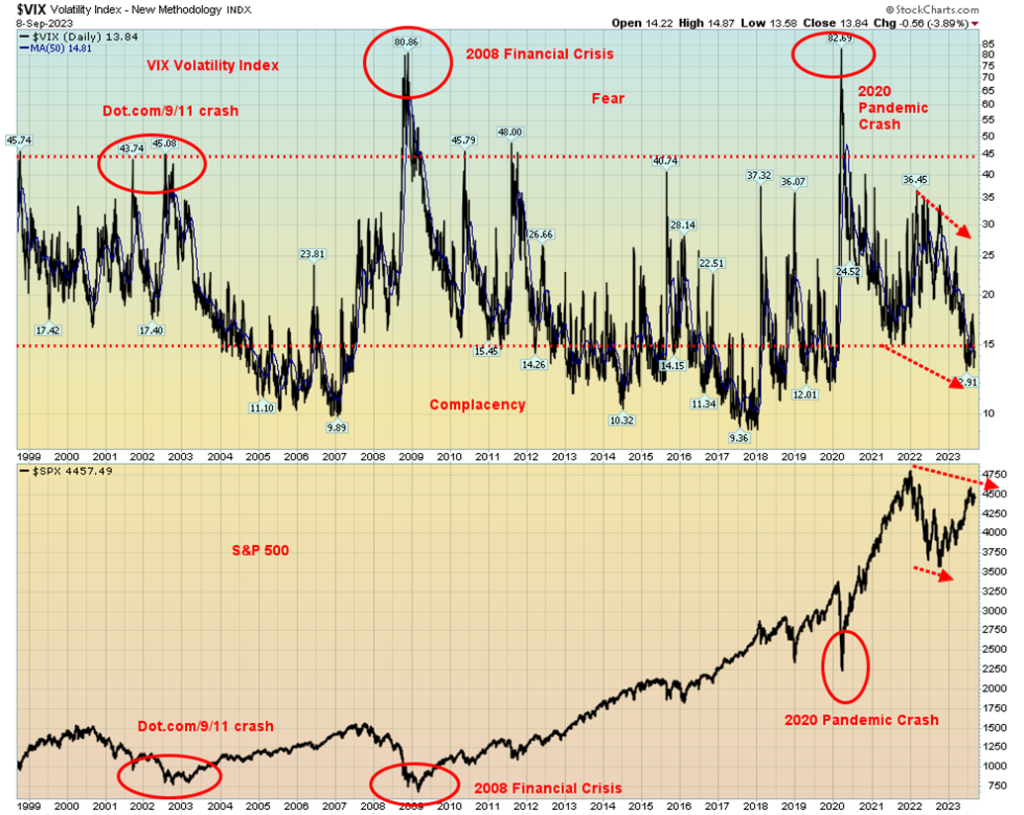
We continue to note the negative divergence with the VIX volatility index. We note the VIX made new lows but the S&P 500 did not make new highs, a divergence. This has potentially negative ramifications for the market. But, as we have noted, we need to break certain levels to confirm a breakdown is underway. For the record, there are VIX futures with the 2X Long VIX Futures UVIX. On a breakdown, the VIX might rise to 30/35 from the current 13.84.
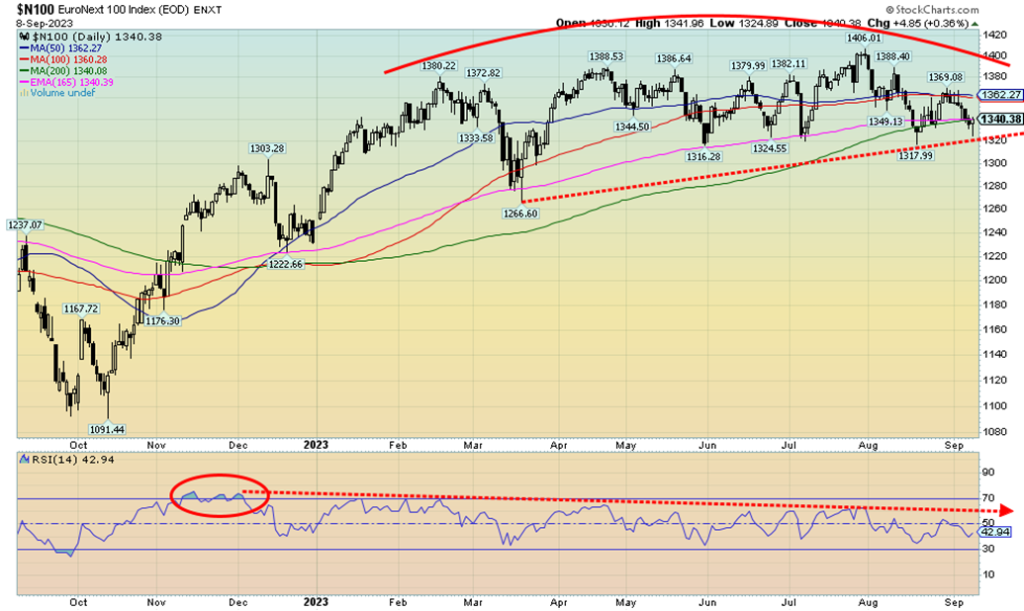
Is this a rounding top we see? The EuroNext 100 is the EU’s blue-chip index, comparable to the S&P 100 (OEX). This pattern has been forming over the past year. Similar patterns are being seen for the Paris CAC 40 and the German DAX. Rolling over patterns are also being seen for the London’s FTSE 100. The RSI topped back in late 2022 and, despite a series of higher prices for the index, the RSI has been in a downtrend ever since. Friday’s action saw the EuroNext hit the support line or neckline of this rounding pattern before it bounced. Is it another save, or just a hook before it breaks support near 1320? A break of 1320 could imply at least a 10-11% decline. Another warning sign for the top indices.
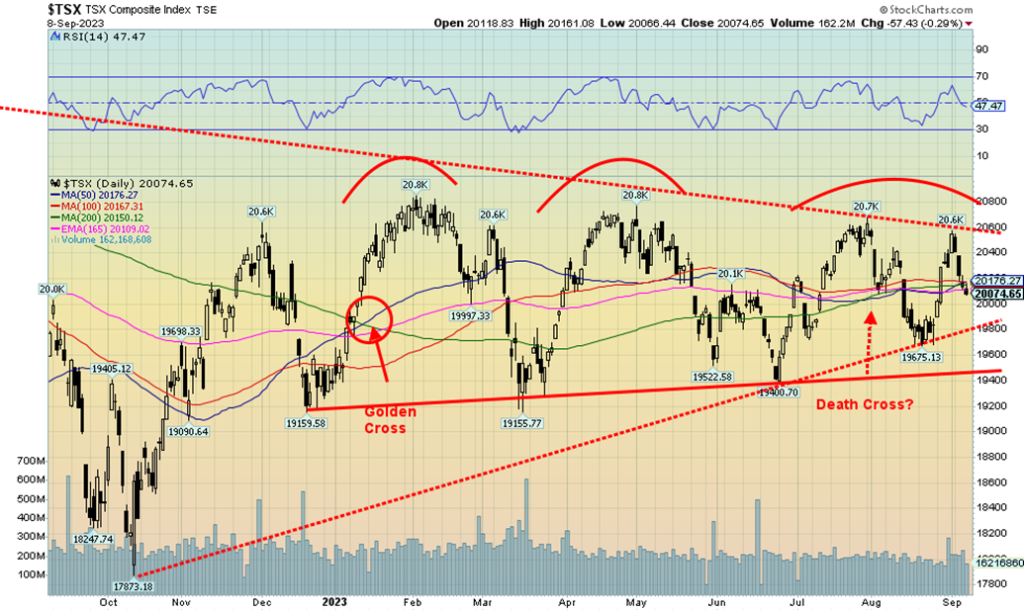
Just when we thought the TSX might bust through that upper channel line, we turned down once again. We said triple tops are rare, but a fourth top? Or even a fifth, if we want to count that lower top seen last November 2022? The whole thing now might be construed as a huge topping pattern with its neckline near 19,400. It was a poor week as the TSX Composite fell 2.3%. The TSX Venture Exchange (CDNX) continues its misery, down 1.8%. Only one sub-index was up on the week, Energy, and that was a feeble 0.3%. Leading the downers was Metals & Mining (TGM), down 3.9%. Following were Telecommunications (TTS) and Information Technology, both down 3.5%. Consumer Discretionary (TCD) was the next closest, down 2.9%. An unpleasant week.
If we want to assume the worst here that is indeed a huge topping pattern, then a firm break of 19,400 could get things rolling to the downside with potential targets down to 17,750, a 12% decline from current levels. Only new highs above 20,600 could save this. We are not expecting that to happen now and would prepare for a downside move. First good support is seen at 19,900, but under that level we are headed for the neckline near 19,400.
Canada Bank of Canada Rate, Consumer Confidence 2013–2023
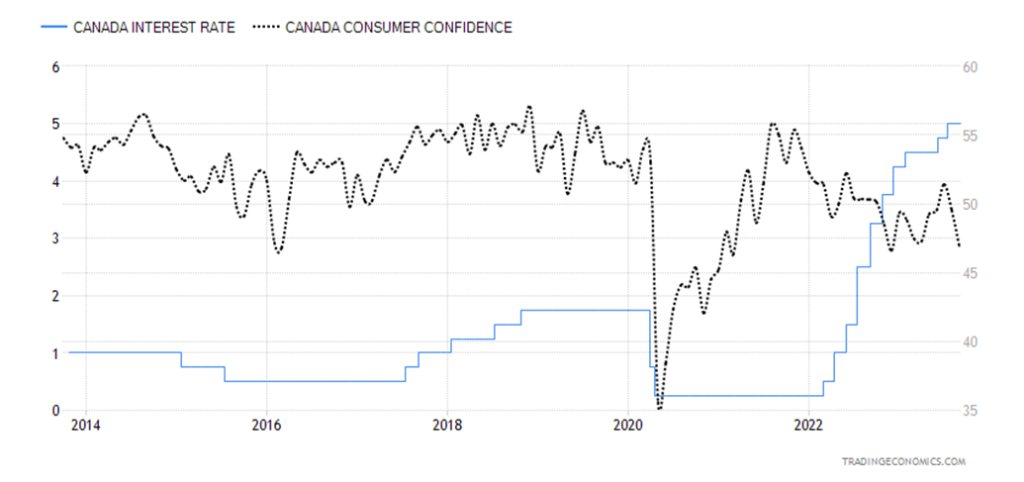
The BofC left the key bank rate unchanged last month at 5%. This was widely expected. The next interest rate decision is October 23, and by that time we’ll have the September job numbers. Still, at this time at least, the wide expectation is that the BofC will leave rates unchanged. We can’t help but notice that as interest rates rose, consumer confidence fell. Consumers have been used to very low interest rates which in turn has encouraged massive borrowing, especially for mortgages to buy houses. But over 40% of mortgages are floating rate, which is putting a lot of people in a bind as their costs rise. Delinquencies are rising as well and it is expected that bankruptcies could follow. While interest rates are really just normalizing, it highlights the folly of low-interest rates for too long, coupled with easy lending terms. Worse, interest rates are expected to stay elevated for some time.
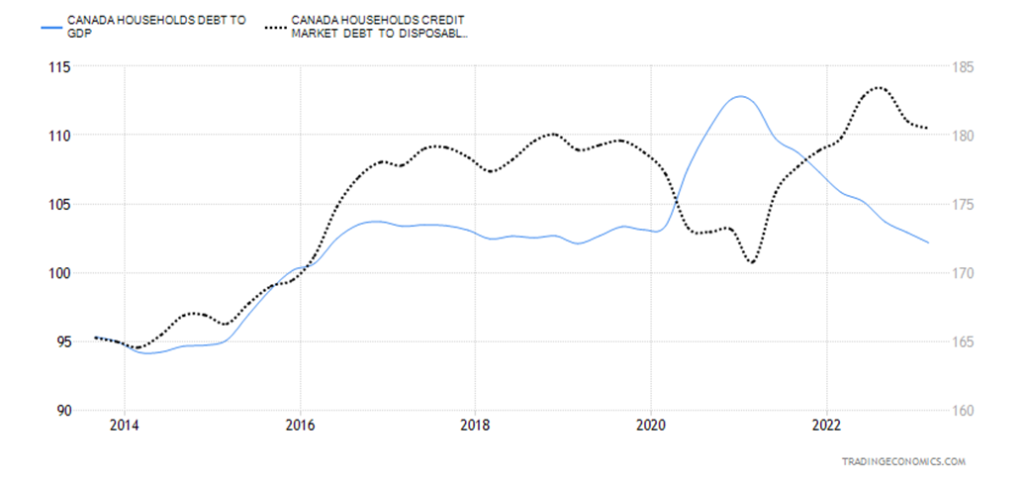
Canada’s household debt to GDP and to income is amongst the highest in the world. Canada, as last reported, has the world’s fourth-highest household debt to GDP and the world’s second-highest household debt to income. Governments, it seems, are not the only proliferators of debt.
Canada Household Debt to GDP and Income 2013–2023
U.S. 10-year Treasury Bond/Canadian 10-year Government Bond (CGB)
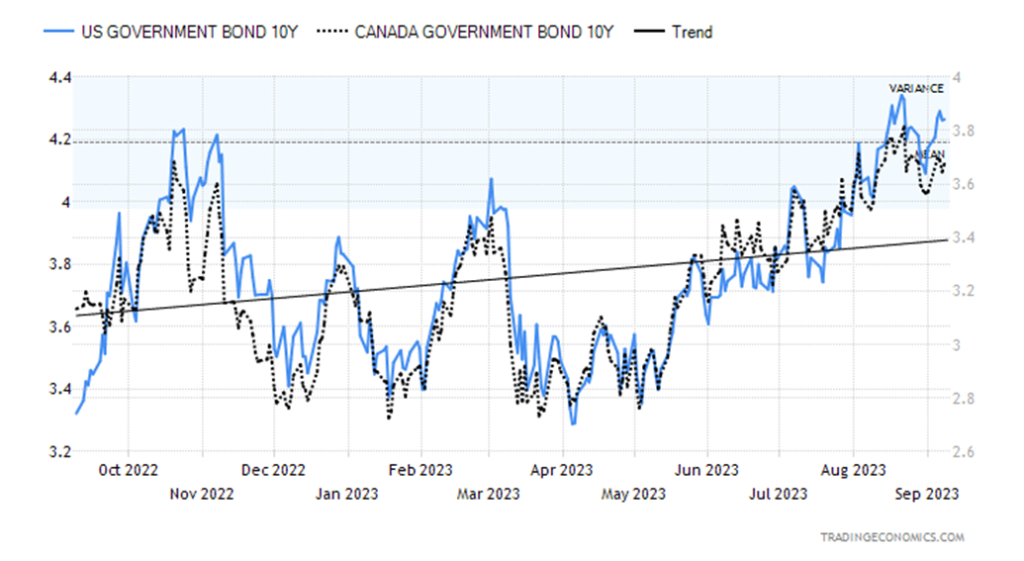
Bond yields keep rising and thoughts that the Fed could still hike rates again remain in the market. Nothing is expected for the FOMC’s September 19–20 meeting and possibly nothing for the October 31–November 1 meeting. (Scary, that’s Halloween.) The real potential lies with the December 12–13 meeting where some still expect a rate hike. Rising oil prices could be a culprit as the Fed has expressed concern. The 10-year U.S. treasury note rose to 4.26% this past week from 4.18%. Canada’s Government of Canada 10-year bond (CGB) rose to 3.65% from 3.57%. The 2–10 spreads stayed about even, well off their lows with the U.S. at negative 73 bp up from negative 69 bp and Canada at negative 99 bp, up from negative 98 bp. The trend is up and we don’t see anything yet to suggest that rates might fall.
The big day is Wednesday when the August inflation numbers are released. Month-over-month the CPI is expected to be up 0.2% and y-o-y up 3.4%, which is up from July’s 3.2%. All thanks to oil prices. The core inflation rate is expected to be y-o-y 4.5%, down from July’s 4.7%. PPI and retail sales are out Thursday. Retail sales are expected to be up a feeble 0.2%. Friday sees industrial production, consumer confidence, and the NY Empire State manufacturing index. A busy week.
U.S. Dollar to Chinese Yuan, China’s Exports 2013–2023
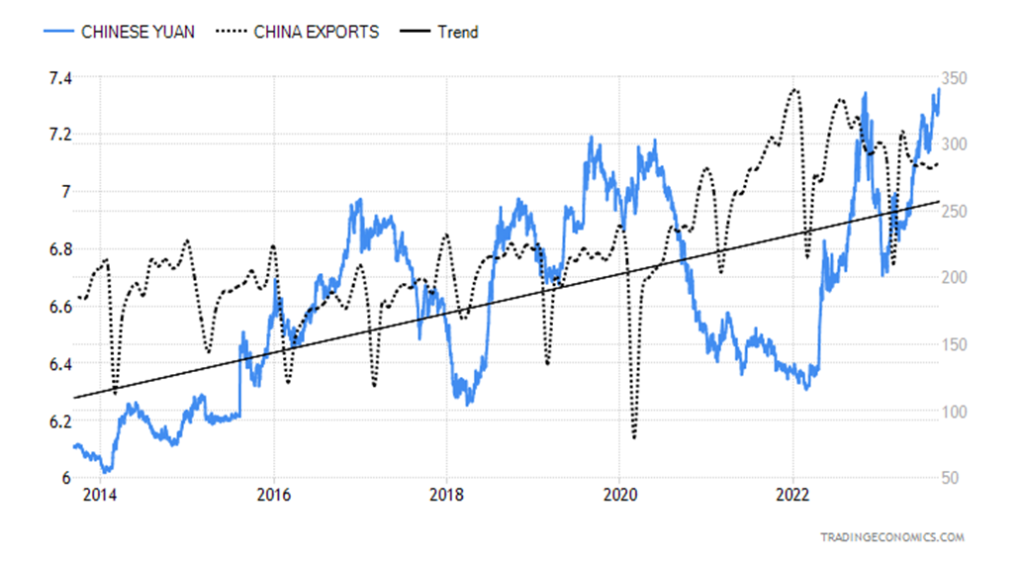
The Chinese yuan has sunk to its lowest level in a decade. The chart above shows the number of yuan that $1 U.S. dollar could purchase. Currently, that rate is US$ = 7.36 yuan. In January 2023 it was US$ = 6.69 yuan. At the same time, China’s exports are falling. Exports are down y-o-y by 8.8% to August 2023. That was after a 14.5% plunge in July. So, what’s going on? China manages its currency. They set a price daily and only limited trading is allowed. Many believe the falling yuan reflects China’s weakening economy. China is the world’s second-largest economy and we can’t recall the last time China fell into an official recession. Okay, they had negative growth during the COVID-19 recession Q1, but they never fell into an official recession with two consecutive negative growth quarters. In Q2 2023 they reported GDP growth of 6.3%.
China has a lot of tools to stop the yuan from falling—for example, sell more foreign exchange reserves. And they have, to some extent, as their holdings of U.S. securities fell to $835.4 billion in June 2023, down from $846.7 billion in May. Over the past year (June to June), China’s holdings of U.S. treasuries have fallen $103.4 billion. Given the current state of U.S./China relations, it is not surprising. China wants to rid itself of exposure to the U.S. At one point China was the largest foreign holder of U.S. debt. Not anymore. Japan is the largest, picking up some of the slack as China backs off. If war broke out between China and the U.S. over Taiwan, then China would not to be wanting to hold U.S. debt.
A lower yuan could also help slow the drop in exports as their exports become cheaper. For China, that would be positive.
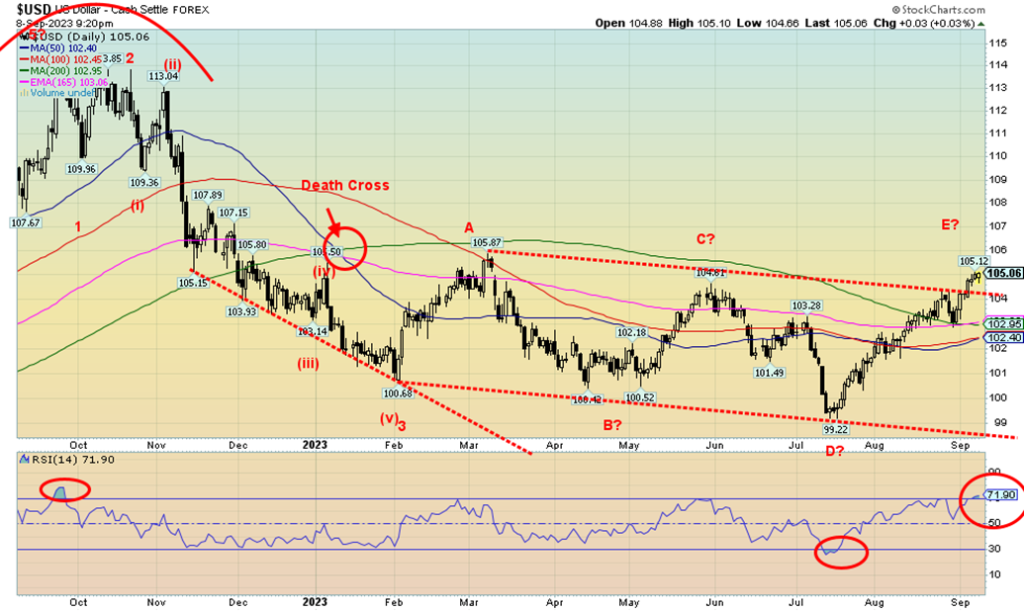
The US$ Index continues to chug higher. Easy to understand as, of all the G7 countries, the U.S. maintains the best economy. The EU, led by Germany, is falling into recession, Japan is in a constant recession, and Canada recorded negative growth in Q2. As well, with continued pressure on interest rates as the U.S. 10-year rose again this past week, the interest rate differentials continue to favor the U.S. and hence a stronger dollar. Also, as we noted, the Chinese yuan is also under pressure. It is not a component of the US$ Index but is a part of the trade-weighted dollar index. That index covers the euro area plus 26 other countries. The pattern is somewhat the same as the narrower US$ Index above. If there is good news, it is the RSI, which is now overbought over 70. But overbought is just an indication that we are getting high. It doesn’t necessarily mean we’ve topped. We also appear to be breaking out and approaching the March high of 105.87. New highs are possible. A drop back under 104 could signal a top, but we’d rather see a drop under 103 to confirm a top. Surprisingly, the death cross seen back in January 2023 is intact but getting closer to a golden cross.
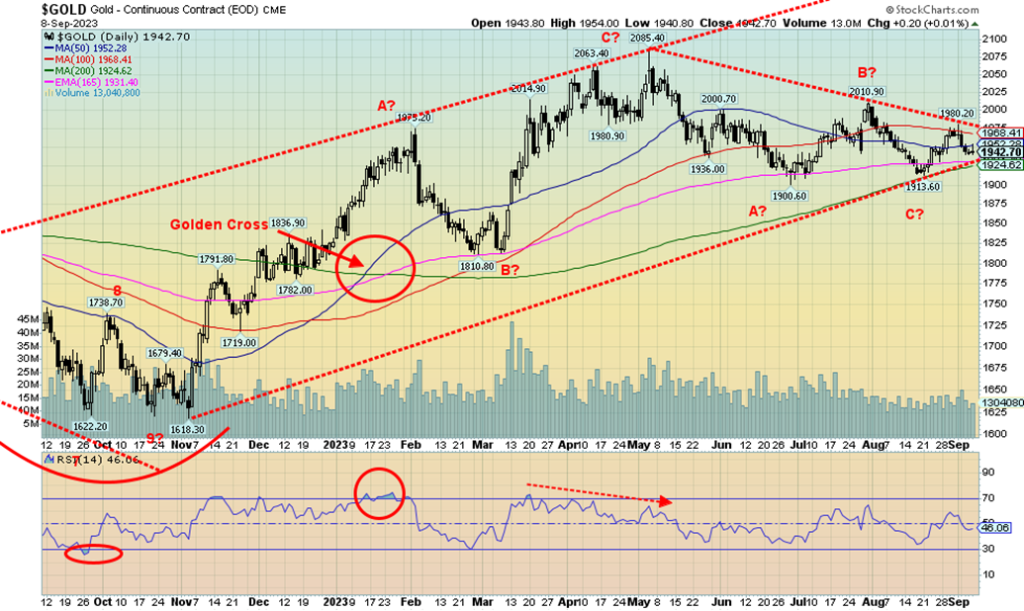
Gold struggled this past week, falling 1.2%. That’s actually the good news as everything else was worse. Silver fell 5.7% and platinum was crushed, down 7.6%. Not even the near precious metals were spared as palladium dropped 2.9% and copper was off 3.4%. The gold stock indices joined the down party with the Gold Bugs Index (HUI) off 3.0% and the TSX Gold Index (TGD) down 2.3%. Gold continues to be the best performer as it is the only one in positive territory in 2023, up 6.4%. While the short-term trend has turned negative (however weak so far) the intermediate trend is now neutral. Another down week could turn the intermediate trend down. For silver and platinum, it is their worst week since June 2023.
So, what’s the problem? The US$ Index rose, bond yields rose, and, while talk of another rate hike has eased and the expectations are the Fed will stand pat in October, many believe that the Fed could hike again before year-end. The Fed has expressed concern about rising oil prices and their potential negative impact on inflation. Still, gold has solid demand and China in particular keeps adding to its gold reserves. China is also a major gold producer, the world’s largest. So, they can add without even importing. Russia is the world’s second-largest producer with Australia. Canada is a distant fourth and the U.S. is a more distant fifth.
Still, it’s the same old story. A rising dollar, bond yields, and fear of another Fed hike. As long as those elements remain, gold could continue to exhibit weakness. But gold remains the best performer and, as our chart of the week shows, gold is slowly outperforming the DJI. That is positive going forward.
The COTs from our usual source came out late. When they did it wasn’t particularly good news as the commercial COT (bullion companies and banks) fell to 29% from 31%. Longs dropped almost 7,000 contracts while shorts rose about 11,000 contracts. The large speculators COT (hedge funds, managed futures etc.) rose to 71% from 68% as their longs were steady but their shorts dropped about 15,000 contracts. Open interest fell roughly 4,000 contracts on a down week for gold. Overall, not a great report and is somewhat negative.
All this puts gold in a better place to fall to $1,800/$1,825 rather than bust through $1,980/$2,000. We closed under support at $1,950 this past week, so the next targets appear to be down to $1,925. A break under $1,925 could set up a decline to $1,900 and a break of the 200-day MA. Our low was seen last November at $1,618. We’d have to break under $1,730 to suggest a serious test of that level. We are not expecting that. But the reality is, the effects of our long-term cycle lows are still hanging around. We don’t expect to see any meaningful up move until December. There is an FOMC September 19–20 followed by one on October 31–November 1, with the final one on December 12–13. That December meeting could be key, coinciding nicely with the December 2015 meeting that launched a powerful gold rally in 2016. And also fit nicely with our 7.83-year cycle lows.
As it stands now, we need to regain above $1,950 and especially above $1,980/$2,000 to suggest higher prices. Right now, we don’t see that happening so our focus is on the downside and next good support at $1,925.
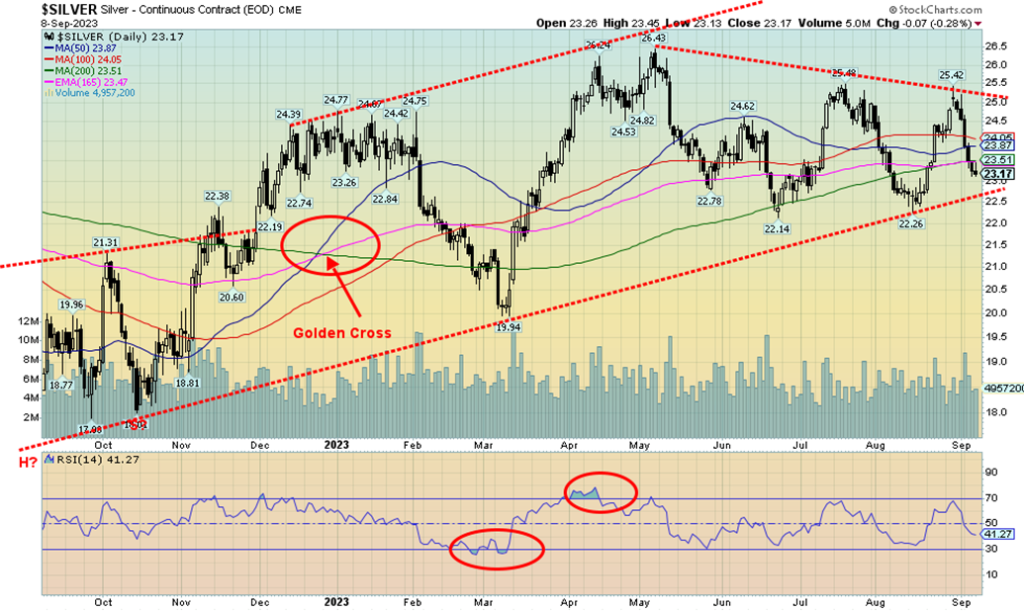
Silver had a miserable week, falling 5.7%. Silver, once again, is now down on the year by 3.6%. The fact that silver led everyone is not a good sign. Silver has a tendency to lead in both up and down markets. The only good news is that we are fast approaching uptrend line support near $22.50. However, if that breaks, then we are going lower, possibly for a test of the September 2022 low of $17.40. A drop below $19.50 would likely ensure the test of $17.40 and even new lows. The other significant low was the March 2023 low of $19.94. A drop under $21.50 suggests that the $19.94 low could fall. To the upside, we need to regain above $24 and especially above $25 to suggest a move higher. Silver’s underperformance is not helpful for the precious metals. The chart appears bearish but could find support near $22.50. If doesn’t, look out below.
The silver commercial COT fell to 34% from 35%. Longs dropped about 2,000 contracts while shorts were off about 1,000. The large speculators’ COT rose to 65% from 64% as they shed about 4,000 longs and about 4,000 shorts. Open interest fell about 6,000 contracts on a down week.
We don’t like the shape of silver’s pattern as it appears to be suggesting a descending triangle with lower highs and a relatively flat bottom. Hence, a break of $22.50 could prove fatal and target down to $18. On the other hand, the pattern since the $26.43 high could just be an ABCDE-type correction and this is the E wave down. Only a move above $25.50 would confirm that a low is in.
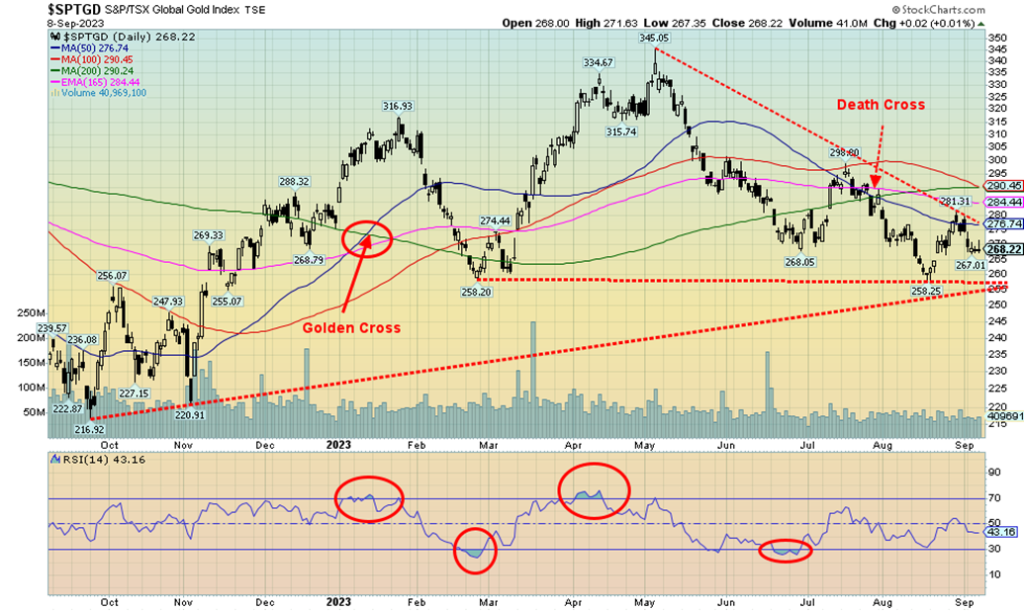
No joy for the gold stocks. The recent string of losses for gold stocks continued this past week as the TSX Gold Index (TGD) fell 2.3%, while the Gold Bugs Index (HUI) dropped 3.0%. The losses followed a two-week up move. The TGD and HUI are in bear market territory as the TGD is down 22% from the high seen in early May. All trends are down: daily (short-term), weekly (intermediate), and monthly (long-term). The Gold Miners Bullish Percent Index (BPGDM) is last at 14.29, the lowest seen since September 2022 and the bottom of last October/November. Volume has been tepid. Support is seen down to about 250, but a breakout is elusive. Above 275 we could get something going, but we’d really need to see the TGD above 290/300 to change the current trend. If one thinks the TGD and the gold stocks are bad, the junior mining market has fared even worse. It’s been in a depression, with many junior gold miners trading basically for cash in the bank or even lower, forgetting about their resources. Still, we’ve seen no junior gold miner suddenly announce they are getting out of gold mining and moving into AI. We actually saw that at the major bottom in 2000/2001 where we had junior gold miners suddenly becoming a dot.com company. That, of course, was the bottom. The junior TSX Venture Exchange (CDNX), made up of at least 50% miners, is trading at multi-week lows, just above its last low seen in December 2022.
The TGD appears to be fast approaching a possible support line near 250 and, as well, a rising trend line from the October/November low of 2022. If all goes well, 250 should hold. If it breaks, then below 245 new lows below the October 2022 low of 217 become possible.
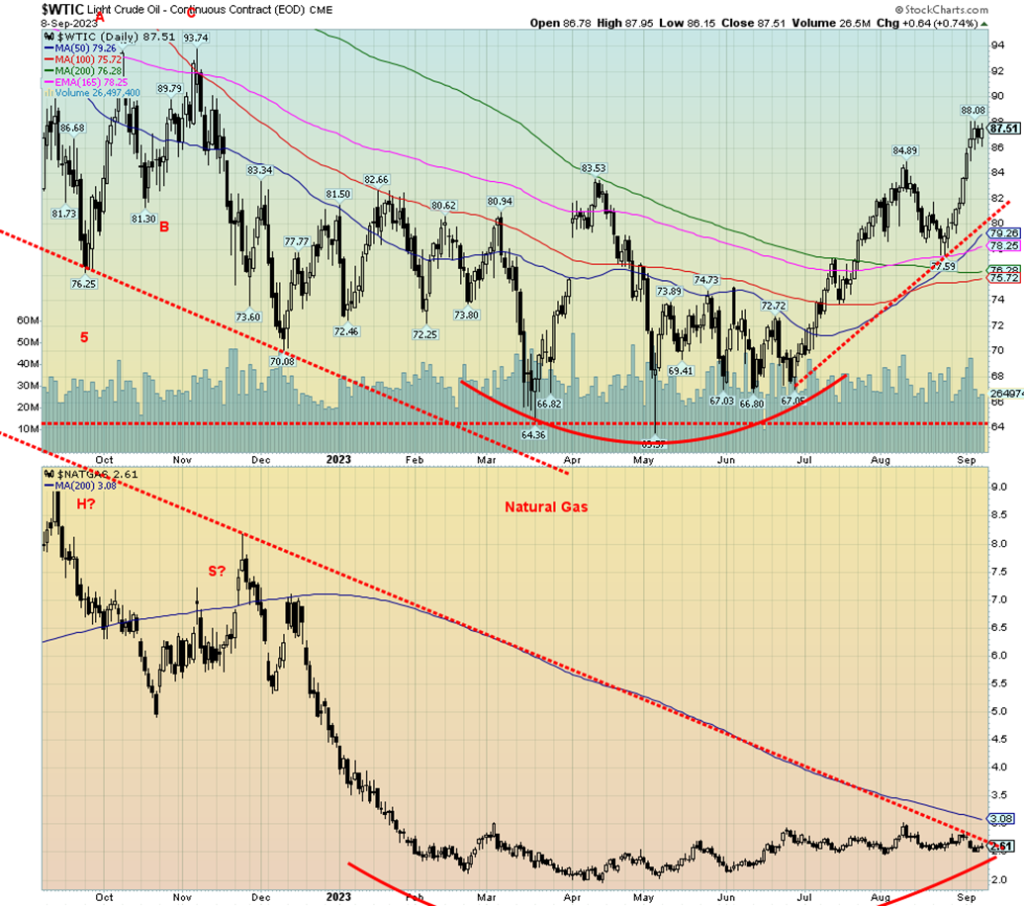
It was probably no surprise that Saudi Arabia/Russia extended production cuts and export cuts. Oil is a weapon of war. But it’s the tightening of U.S. supplies with falling oil and gas inventories that is a significant driver. U.S. crude oil stocks have fallen from 456.8 million barrels on July 21 to the recent 416.6 million barrels. Gasoline stocks have been in a steady downward trend, but not as dramatically as crude oil, which has fallen from 217.6 million barrels on July 21 to last reported at 214.7 million barrels. Both are crawling around the bottom of the 5-year average range.
As a result, WTI oil rose almost $2 this past week or 2.3%. Brent crude was up 3.6%. However, natural gas (NG) floundered, falling 5.8% at the Henry Hub and at the EU Dutch Hub falling only 3.1%. While oil continues to move higher, NG has backed off. It hasn’t stopped the energy stocks, however, as the ARCA Oil & Gas Index (XOI) rose 2.2% to fresh 52-week highs while the TSX Energy Index (TEN) was only up 0.3% and remains short of fresh 52-week highs.
WTI oil continues to barrel higher towards potential targets at $90 and $95. Some are calling for $120 oil. High sustained oil prices have been at the heart of recessions in 1980–1982, 1990, and even 2008. Oil had also jumped before the pandemic but collapsed during it, likely making a multi-year low that won’t be seen again. Short-term WTI is overbought, so we might have a pullback. Support is that rising channel line currently near $80, although we’d be surprised it pulled back that far. So far, this is a sustained rise.
NG, on the other hand, continues to languish, forming that huge rounding bottom. We’d still need to see NG through $3 to suggest we are breaking out. It’ll happen, but we just don’t know when. Possibly into Q4. In the interim, the energy stocks continue higher.
Another reason why oil might rise further is a lawsuit winding its way through the European Court of Human Rights. It is being brought by six young people against 32 governments over climate change. If they win, it could force the countries involved to slash emissions further and phase out fossil fuels. Even pressure is growing in Canada to phase out oil and gas subsidies which are in the billions. While the lawsuit is primarily European-based, it could also impact here as well. Of course, none of this is guaranteed.
We continue to view oil and gas a buy and, by extension, the oil and gas stocks.
__
(Featured image by 3844328 via Pixabay)
DISCLAIMER: This article was written by a third party contributor and does not reflect the opinion of Born2Invest, its management, staff or its associates. Please review our disclaimer for more information.
This article may include forward-looking statements. These forward-looking statements generally are identified by the words “believe,” “project,” “estimate,” “become,” “plan,” “will,” and similar expressions. These forward-looking statements involve known and unknown risks as well as uncertainties, including those discussed in the following cautionary statements and elsewhere in this article and on this site. Although the Company may believe that its expectations are based on reasonable assumptions, the actual results that the Company may achieve may differ materially from any forward-looking statements, which reflect the opinions of the management of the Company only as of the date hereof. Additionally, please make sure to read these important disclosures.
Copyright David Chapman 2023
David Chapman is not a registered advisory service and is not an exempt market dealer (EMD) nor a licensed financial advisor. He does not and cannot give individualised market advice. David Chapman has worked in the financial industry for over 40 years including large financial corporations, banks, and investment dealers. The information in this newsletter is intended only for informational and educational purposes. It should not be construed as an offer, a solicitation of an offer or sale of any security. Every effort is made to provide accurate and complete information. However, we cannot guarantee that there will be no errors. We make no claims, promises or guarantees about the accuracy, completeness, or adequacy of the contents of this commentary and expressly disclaim liability for errors and omissions in the contents of this commentary. David Chapman will always use his best efforts to ensure the accuracy and timeliness of all information. The reader assumes all risk when trading in securities and David Chapman advises consulting a licensed professional financial advisor or portfolio manager such as Enriched Investing Incorporated before proceeding with any trade or idea presented in this newsletter. David Chapman may own shares in companies mentioned in this newsletter. Before making an investment, prospective investors should review each security’s offering documents which summarize the objectives, fees, expenses and associated risks. David Chapman shares his ideas and opinions for informational and educational purposes only and expects the reader to perform due diligence before considering a position in any security. That includes consulting with your own licensed professional financial advisor such as Enriched Investing Incorporated. Performance is not guaranteed, values change frequently, and past performance may not be repeated.


Ecobnb Turns Sustainable Tourism Into Measurable Impact
Ecobnb’s sustainable tourism platform generated significant environmental and social impact in 2025, avoiding 58,207 kg of CO₂ and adding 583...


Sugar Markets Balance Biofuel Demand and Global Supply
Sugar markets in New York and London were mostly unchanged as the Iran conflict renewed interest in biofuels. Drought concerns...


The $40 Trillion Trap: Disinflation Is Not Deliverance
U.S. debt has reached $40 trillion, with $24 billion weekly interest, while deficits accelerate. Despite disinflation in CPI, from cooling...


FinTech Matures as AI and Infrastructure Drive the Next Growth Phase
Fintech markets are entering a mature phase, shifting from rapid growth to consolidation, specialization, and sustainable business models. Zurich and...


Bitcoin, and Ethereum Rise, While Cardano Enters Transition
Bitcoin and Ethereum posted modest weekend gains, supported by ETF inflows. A new proposal may protect Bitcoin from quantum threats....
 |
|
 |  |
 |
|
-

 Biotech7 days ago
Alzheimer’s Study Reveals Immune Pathway Behind Women’s Higher Vulnerability and Potential New Treatment Approach
-

 Biotech2 weeks ago
The New Biotech Act Targets Europe’s Funding and Innovation Gap
-

 Crowdfunding4 days ago
Avant Devices Moves Toward Electric Wheelchair Kit Production with New Funding Drive
-

 Africa2 weeks ago
Bank of Africa Launches SME Pact to Boost Business Growth