Featured
Markets May Have Hit a Temporary Top that Could Continue into September
Our chart of the week looks at the Commodity cycle once again and one thing we note is that lumber has now fallen 70% from its highs. So the upcycle will persist for years but there could be pullbacks, some sharp.
We have a number of extra charts this week noting the switch from small cap stocks to large cap stocks and consumer discretionary to consumer staples. Defensive measures.

The inflation fuss is all about cars. Yes, cars. Apparently, their prices have been going through the roof. Used cars and rental prices leaped 12% in June 2021 and 88% from a year ago. Used car prices are up 11% in June and 45% from a year ago. New car prices were up only 2% and 5% respectively.
So, what’s going on? Why car prices? The pandemic crash caused a lot of rental companies to unload their excess cars that were no longer being rented to raise cash so they could survive. Hertz (HTZZ-OTCBB), a car-rental behemoth, declared bankruptcy a year ago in May although they have now re-emerged. Avis (CAR-NASDAQ) saw its Q2 revenues fall 67%. Then, to replenish their fleets there was a chip shortage which translated into a shortage of new cars to buy. Pent-up demand leaped into used cars, helping to push prices skyward.
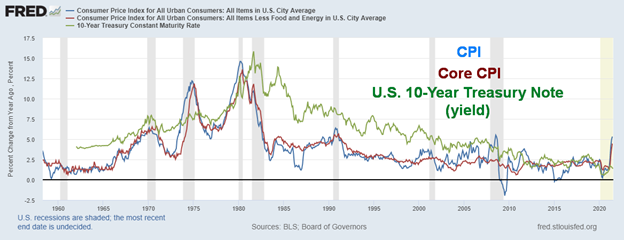
Economists have calculated that if one removes what they call re-opening sectors—i.e., used cars and trucks, rental cars and trucks, hotels and airline fares, recreation services like gyms, insurance for motor vehicles—then one discovers that they make up 12% of core inflation and accounted for two-thirds of the June inflation jump. For the record, the CPI jumped 0.9% in June (above expectations of 0.5%), the year-over-year CPI was up 5.4% (expected 4.9%), the core inflation rate (ex food and energy) gained 0.9% in June (expected 0.4%), and the core inflation rate year-over-year jumped 4.5% (expected 4.0%).
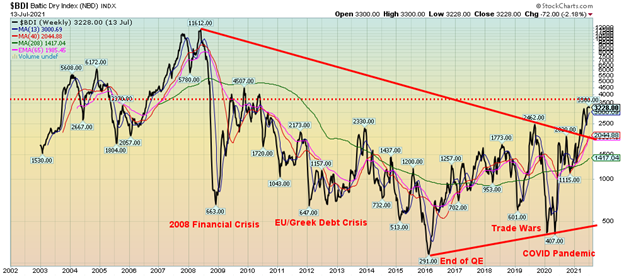
Food prices have also soared, led by soybeans, which have doubled in the past year. Other foods have gone up as well and the cost of shipping has gone up as seen by a rise in the Baltic Dry Index (BDI) that measures shipping rates for ships handling many goods, including grains. The BDI is back where it was in 2009 (see chart below).
CPI, Core CPI – Year-Over-Year % Change, 10-year Treasury Note (yield)
Baltic Dry Index
To add to the confusion over inflation, the Producer Price Index (PPI) came out the day after the CPI. Once again, prices jumped. The PPI for June was up 1% (expected 0.6%), year-over-year PPI was up 7.3% (expected 6.8%), while the Core PPI for June also rose 1% (expected 0.5%) and year-over-year the Core PPI was up 5.6% (expected 4.9%). At the same time, Canada also released its PPI numbers and the preliminary June PPI actually fell 0.4% while the year-over-year preliminary PPI was up a whopping 16.2%. The inflation issues in Canada are the same as in the U.S. Given the jump in the PPI, inflation hysteria is rising.
While the CPI numbers were bad, in some respects the PPI numbers were worse. PPI is what impacts the manufacturing base. While the PPI was up 5.4%, individual components were up even more. Goods were up 11.7%, energy up 35.2%, and services up 5.2%. These numbers somehow work back to the consumer in the CPI and could even impact manufacturer’s bottom lines.
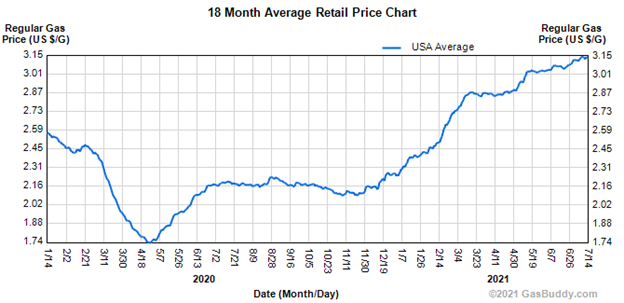
For the consumer, here is how gas prices at the pump have jumped in the past year. For Canadians, the gas price might seem low. Gas at the pump in U.S.$ here in Toronto is at least $1 higher.
But then along came Jerome Powell to calm things down. Powell said the U.S. economic recovery still has a way to go. Employment remains well down from February 2020 before the pandemic. Only 70% of the jobs that were lost have been recovered and the official unemployment rate (U3) is a full 2.4 points above the level of February 2020. The economy is improving but the Fed is showing no signs of tapering as the Fed believes the economy still needs help. Surging COVID variants could throw yet another hook into the economy. Cases are rising once again in the U.S. but primarily among the hardcore holdouts to vaccinations who account for some 99% of new cases. Much of the world is still unvaccinated and that could also cause problems as cases of the COVID variant rise.
While tapering appears to be off the table for the moment, the Fed will continue to soak up excess cash in the reverse repo market. By conducting reverse repos, the Fed is putting the brake on any potential for negative interest rates, something it clearly does not want. The Fed acknowledges that inflation has gone up and there may be a few more bad reports to come but they maintain, along with other central banks, that the current inflation is transitory—or maybe the word should be “temporary.” Daily reverse repos continue to be between $800 and $900 billio. The Fed’s holdings of mortgage-backed securities have jumped $395 billion since February 2020 as part of its QE program. In Canada, tapering has come to the forefront and the Bank of Canada (BofC) has announced a further cut to $2 billion/week from $3 billion/week. In that respect the BofC is ahead of other central banks.
The situation is transitory—or is it temporary—because of production bottlenecks, supply constraints, and other factors that have helped spike prices. As things settle down and the initial leap in prices levels out, it should begin to unravel the production and supply constraints that are sparking the current round of inflation. It probably is not unusual that, given the pandemic, many services were hard hit; demand surged because of re-openings and prices surged with it.
Fed Chair Jerome Powell and BofC Governor Tiff MacKlem are both onside as to their belief that inflation could be transitory, but both admit that it could be higher than expected, at least in the near term. Supposedly, the formal 2% range for inflation could easily become 3% going forward without even announcing the change. Will a rise in inflation spark an interest rate increase before 2023? While we doubt it, given the language and nuance from the Fed Chair and BofC Governor, it cannot be outright dismissed. It would, as they say, be a mistake to act prematurely. Some economists are suggesting it could. If history is any guide, the odds favour that once the initial spike occurs the inflation rate will cool over time. Central banks are not known for jumping to conclusions at the first sign of trouble. Without saying it, both the Fed and the BofC will tolerate a higher rate of inflation for a period. What one has to do is watch the market and see how it reacts.
And here it is potentially revealing. After initially spiking to about 1.42%, the U.S. 10-year treasury note has since fallen to 1.30%. Bond markets tend to look beyond the current set of numbers and what they see could be an economy not quite as robust as what many would like it to be. The bond market is concerned about the potentially negative effects of the COVID Delta variant; the infrastructure bills keep getting cut back in order to get an agreement; and China is trying to cool its economy, which could reverberate back to the Western economies. Gold prices rose even as the U.S. dollar rose, seemingly an anomaly. The stock market has shown weakness, and it is moving into a period of seasonal weakness that extends into September/October. Still, we have seen lows in August and instead it rallies into October. 2007 was a good example of that.
Other economic numbers out this past week were indicating an economy that is maybe not as robust as many would like it to be. The Philly Fed Manufacturing Index came in at 21.9 vs. an expectation of 28 and June’s 30.7. Industrial production for June was +0.4% vs. an expectation of +0.6% and May’s 0.7%. Year-over-year industrial production disappointed at +9.8% vs. an expected 12.2% and May’s +16.1%. Capacity Utilization for June was 75.4% vs. an expected 75.6%. The NY Empire Manufacturing Index did surprise at 43, well above the expected 18 and May’s 17.4. Initial jobless claims this past week were 360,000 which was about on consensus and below the previous week’s 386,000. Finally, retail sales jumped 0.6% in June when the market expected a decline of 0.4%. Strip out the volatile auto sales and retail sales were up 1.3% vs. an expectation of a gain of 0.2%. Could this be another post-COVID leap that could cool later as the COVID variant takes hold? Is the economy blowing hot or cold? Well, maybe it’s baby bear porridge—not too hot, not too cold.
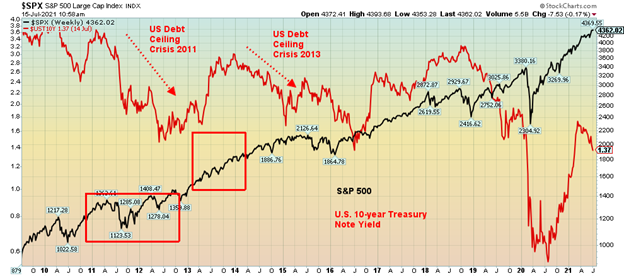
One thing coming that might cause some hiccups is the U.S. debt ceiling. The debt ceiling needs to be raised, or at least extended (or, oddly, “suspended” as the word has been) by August 1, 2021. Some believe this time around it might not be a problem. Indeed, we have heard virtually nothing on it. The current debt ceiling is $21.988 trillion and that has been in place since December 2015. Yet the Federal debt currently stands at $28.5 trillion. There was a debt limit crisis in 2011 and 2012–2013 where it was threatened that the U.S. could default. There was a lot of noise and partisan wrangling. A temporary shutdown. Bond yields fell and the stock market wavered in 2011, but part or most of that may have been due to the EU/Greek crisis that was occurring at the time. The stock market barely wavered in 2012–2013 and kept going up. Since 2015 the debt ceiling has been extended by effectively continuing to suspend it. Could the same thing happen again? It doesn’t seem to be a burning issue.
U.S. Debt Ceiling Crisis of 2011 & 2012–2013
The inflation numbers may well have come in above expectations. But there continue to be other signs that business activity is struggling, not steaming. One measurement is the Cass Freight Index that actually faltered in June after rising steadily since the trough of the pandemic over a year ago. Expenditures went up but shipments went down. We remain more concerned about the massive growth in money supply, particularly M1 that has leaped some 300% since April 2020. Will that money get spent? With many jobs not coming back and support payments and benefits coming to end, could we instead have a liquidity crisis as M1 falls, with people forced to spend their savings to pay the rent or face eviction?
We leave you with the chart on inflation from Shadow Stats (www.shadowstats.com). Shadow Stats compares the current inflation with the way inflation was calculated back in 1990. Since then, the CPI then become more a measurement of what is needed to maintain a constant standard of living rather than reflecting the cost of living. Year-over-year the official CPI shows a rise of 5.4%, but using the Shadow Stats inflation calculations it really is 13.4%. It’s the equivalent of substituting hamburger for steak.
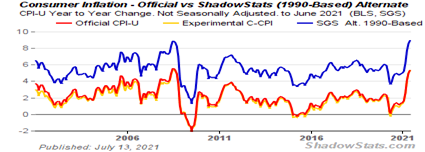
Chart of the Week
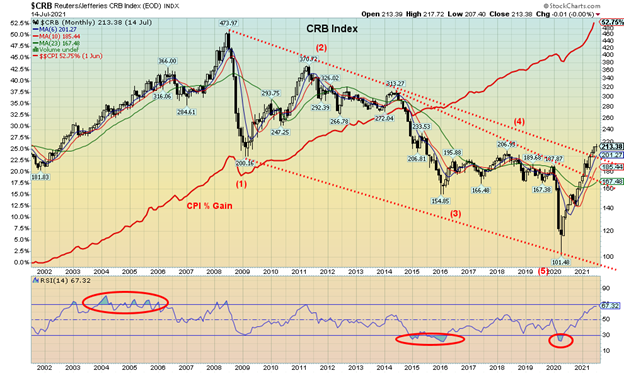
There still appears to be quite a debate over whether a new commodity supercycle is underway. The recent rise in the Commodity Research Bureau Index (CRB) from the bottom of the March 2020 pandemic panic seems to suggest that, at minimum, there is a strong rebound in commodities underway. A surge in demand as economies open up, coupled with shortages that were caused initially by the pandemic are a two-pronged reason for the rise. As well, there has been a surge in demand in commodities for bio-fuels and green solutions. Also, investment funds have poured in to take advantage of the rise and use it as a hedge against the explosive growth in money supply and currency devaluation. Climate change could play a significant role in a new commodity cycle as the world faces out of control wildfires, floods and major pollution.
But not all commodities rise at the same time or speed and they can take turns providing leadership. An early leader this time was lumber as it soared over 530% to a peak in May 2021 from its low in early April 2020. But that was then. Since then, it has fallen almost 70% but remains up just over 95%. The hysteria over inflation in commodities appears to be taking a bit of a hit.
The early part of the millennium saw a huge rise in the CRB Index to a top in 2008. That boom was dominated by the sharp rise in oil prices to $147, a rise of almost 1,300% from the late 1990’s. After the 2008 financial crash, commodity prices rose again, led in many ways by gold soaring to over $1,900 for a gain of 650% from 2001 and silver to $49.50 for a gain of over 1,100% since 2001. The third rise in the past 20 years was seen from late 2015 to 2018 for a muted gain of 34% for the CRB. It is generally accepted that the last commodity supercycle peaked in 2008 with a secondary top in 2011. After peaking in 2008 the CRB has been in a long decline ever since until now falling almost 79%. From the March 2020 low the CRB is up just over 100%.
Since the late 18th century there have been seven very distinct commodity booms. They were:
- 1775–1779 (+201%)
- 1792–1814 (+114%)
- 1843–1864 (+197%)
- 1897–1920 (+277%)
- 1933–1951 (+327%)
- 1968–1980 (+255%)
- 1999–2008/2011 (+278%)
The average gain has been 235% and lasted on average 15 years. By that measurement the current boom might be about half-way there in terms of gains, but may still have many years to run, given it has only been a year and three months since the last major low. That could see the current boom last through the 2020s and well into the 2030s. But it is not a straight-up affair. Pauses/corrections, some of which could be sharp, during a boom are not unusual. Key, of course, is that the lows of March 2020 are not seen again.
What is interesting is that peaks in the commodity booms usually coincided with wars: the American Revolution (1775–1783), the War of 1812–1814, the U.S. Civil War (1861–1865), World War I (1914–1918), World War II (1939–1945), the Vietnam War (1955–1975), and the War on Terror (Afghanistan/Iraq) in 2001–2011. While the latter has been ongoing, peak activity was around 2011 before it began to wind down. If war is a key component of commodity booms, speculating as to what the next war is, is difficult. Could current tension between the U.S. and China and Russia end up in a real war?
We have no doubt a commodity boom of some significance is underway. How far it goes and for how long is open to speculation. A significant driver could be—besides the requirements to combat climate change and/or build back from the devastation caused by it—the massive infrastructure needs of the U.S. and Canada and, to a lesser extent, elsewhere. China and the U.S. will continue to be major consumers of commodities and the competition for them is a part of the current tensions, even if it is unspoken.
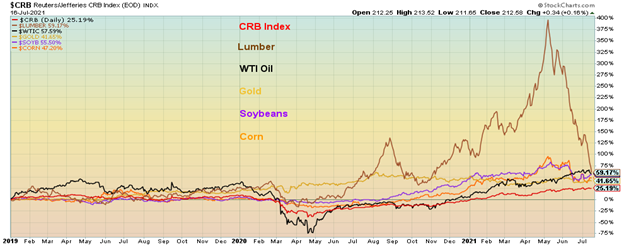
The next chart shows the gains for selected commodities since 2019. Lumber has led the way, up 59.2%, followed by WTI oil +57.6%, soybeans +55.5%, corn +47.2%, and gold +41.7%. The CRB Index is up 25.2%. The CRB Index contains 19 commodities. 39% of the index is energy, 41% agriculture, 7% precious metals, and 13% industrial metals. Besides the commodities noted on the chart, the others are aluminum, cocoa, copper, heating oil, lean hogs, natural gas, nickel, orange juice, RBOB gasoline, sugar, and wheat.
Selected Components Gains 2019–2021 %
31MARKETS AND TRENDS
| % Gains (Losses) Trends | ||||||||
| Close Dec 31/20 | Close Jul 16/21 | Week | YTD | Daily (Short Term) | Weekly (Intermediate) | Monthly (Long Term) | ||
| Stock Market Indices | ||||||||
| S&P 500 | 3,756.07 | 4,327.16 (new highs) | (1.0)% | 15.2% | up | up | up | |
| Dow Jones Industrials | 30,606.48 | 34,687.85 | (0.5)% | 13.3% | up | up | up | |
| Dow Jones Transports | 12,506.93 | 14,491.91 | (2.4)% | 15.9% | down | up (weak) | up | |
| NASDAQ | 12,888.28 | 14,427.24 (new highs) | (1.9)% | 11.9% | up | up | up | |
| S&P/TSX Composite | 17,433.36 | 19,985.54 | (1.3)% | 14.6% | up | up | up | |
| S&P/TSX Venture (CDNX) | 875.36 | 908.31 | (3.2)% | 3.8% | down | neutral | up | |
| S&P 600 | 1,118.93 | 1,297.56 | (4.6)% | 16.0% | down | up (weak) | up | |
| MSCI World Index | 2,140.71 | 2,324.87 | (0.1)% | 8.6% | down | up | up | |
| NYSE Bitcoin Index | 28,775.36 | 31,893.66 | (5.0)% | 10.8% | down | neutral | up | |
| Gold Mining Stock Indices | ||||||||
| Gold Bugs Index (HUI) | 299.64 | 265.13 | (1.4)% | (11.5)% | down | down | up | |
| TSX Gold Index (TGD) | 315.29 | 300.13 | 0.2% | (4.8)% | down (weak) | down (weak) | up | |
| Fixed Income Yields/Spreads | ||||||||
| U.S. 10-Year Treasury Bond yield | 0.91 | 1.29% | (4.4)% | 41.8% | ||||
| Cdn. 10-Year Bond CGB yield | 0.68 | 1.25% | (5.3)% | 83.8% | ||||
| Recession Watch Spreads | ||||||||
| U.S. 2-year 10-year Treasury spread | 0.79 | 1.06% | (6.2)% | 34.2% | ||||
| Cdn 2-year 10-year CGB spread | 0.48 | 0.81% | (1.2)% | 68.8% | ||||
| Currencies | ||||||||
| US$ Index | 89.89 | 92.69 | 0.6% | 3.1% | up | up | down | |
| Canadian $ | 0.7830 | 0.7930 | (1.3)% | 1.2% | down | neutral | up | |
| Euro | 122.39 | 118.07 | (0.6)% | (3.5)% | down | down | up | |
| Swiss Franc | 113.14 | 108.74 | (0.6)% | (3.9)% | down | down | up | |
| British Pound | 136.72 | 137.63 | (1.0)% | 0.7% | down | up (weak) | up | |
| Japanese Yen | 96.87 | 90.87 | 0.1% | (6.2)% | neutral | down | down | |
| Precious Metals | ||||||||
| Gold | 1,895.10 | 1,815.00 | 0.2% | (4.2)% | neutral | neutral | up | |
| Silver | 26.41 | 25.80 | (1.6)% | (2.3)% | down | neutral | up | |
| Platinum | 1,079.20 | 1,108.50 | 1.2% | 2.7% | neutral | neutral | up | |
| Base Metals | ||||||||
| Palladium | 2,453.80 | 2,637.30 | (6.2)% | 7.5% | down | up | up | |
| Copper | 3.52 | 4.32 | (0.7)% | 22.7% | down (weak) | up | up | |
| Energy | ||||||||
| WTI Oil | 48.52 | 71.56 | (4.0)% | 47.5% | neutral | up | up | |
| Natural Gas | 2.54 | 3.66 | flat | 44.1% | up | up | up |
New highs/lows refer to new 52-week highs/lows and in some cases all-time highs.
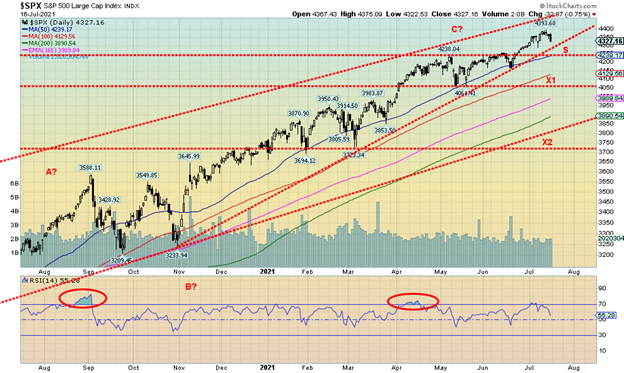
Is the stock market now poised to make its long-expected correction? This past week the S&P 500 made new all-time highs once again, then reversed and closed lower, down 1.0%. Others joined the S&P 500. The Dow Jones Industrials (DJI) fell 0.5% while the Dow Jones Transportations (DJT) dropped more, off 2.4%. The DJT continues to diverge from the DJI as the DJT has been quite weak now, down 10.4% from its all-time high seen back in May. The DJI, on the other hand, is down only about 1% from its all-time also seen in May. The NASDAQ dropped 1.9% this past week after making another all-time high. Others making all-time highs this past week but, as with the S&P 500, closed lower were: the S&P 100, NASDAQ 100, Russell 1000 and 3000, and the Wilshire 5000. The Dow Jones Utilities (DJU) was about the only index to close higher, gaining 2.3% on the week.
Here in Canada the TSX fell 1.3% while the TSX Venture Exchange (CDNX) dropped 3.2%. In the EU the London FTSE was down 1.8%, the Paris CAC 40 fell 1.1%, and the German DAX fell 0.9%. In Asia, China’s Shanghai Index (SSEC) was up 0.4% and the Tokyo Nikkei Dow (TKN) gained a small 0.2%. The TKN continues to look very vulnerable to a downside move. The MSCI World Index fell a small 0.1%. Bitcoin continues to look vulnerable to a downside move as it dropped almost 5.0% to close the week near 31,000. A firm drop under 30,000 could send Bitcoin down towards 20,000.
As we will note below, the S&P 500 appears to be undergoing a stealth correction. The NYSE advance-decline line is diverging as it has turned down and broke this week under its 50-day MA. It did not make new highs even as the S&P 500 did make new highs. As well, the VIX Volatility indicator was rising over the past week even as the S&P 500 also rose. The two are usually inverse to each other. The McClellan Summation Index (ratio-adjusted), known as the RASI, dropped under 500 for the first time since November 2020. A drop under 500 has in the past signaled a correction ahead. The shallow decline for the markets from August to November 2020 saw the RASI fall to 0. Steep declines such as the pandemic crash saw the RASI drop to -1200. All these divergences are signaling that a correction finally appears to be on us. Put buying increased on the week as the CBOE Put/Call ratio rose to 0.69, the highest level seen since October 2020. If the put/call ratio were to rise above 0.80 then it could be signaling a bottom. Another divergence that some analysts like to note is the S&P 500 making new highs but the NYSE Composite not making new highs. As well, as we note further on, large cap stocks are outperforming small cap stocks. The small cap indices of the S&P 600 and the Russell 2000 have turned solidly to the downside.
A potential minimum objective for a pullback would see the S&P 500 drop to around 4,240 where it could find support. A drop under that level could signal that a decline to the next level of support is underway, down to 4,050. At that point the S&P 500 would be down 8% which would fit into our thoughts that we could have a shallow correction. Under 4,050 could see a steeper decline towards the 200-day MA near 3,890. If the market were to fall under 3,700, something we doubt at this time, then a major bear market could well be underway. Still, as long as we hold above 4,300, we could see the S&P 500 regroup and rise to new highs again. Divergences then, we suspect, would become even more pronounced.
The August/September period is traditionally a weak time, although we have seen lows in August and a rally into October. But normally it is the other way around as we fall into September/October and start to rally out of November. Watch these points carefully over the next few weeks as they will help determine whether we’ll continue to see a shallow correction (which is what we favour) versus a steeper correction that approaches 20% or more.
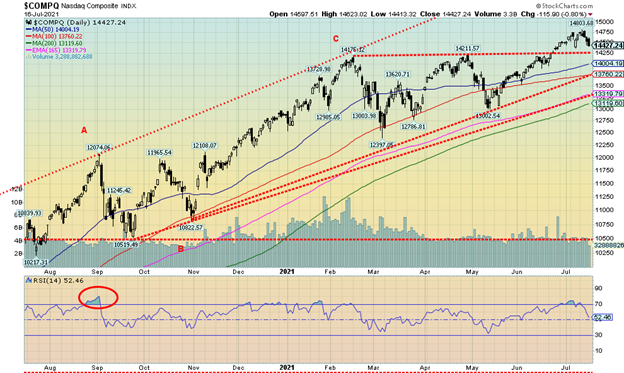
Once again, the NASDAQ made a new all-time high. Except that, this time, it made the new all-time high and then reversed and closed lower by 1.9% on the week. While it was a reversal, it was not an outside week reversal that would then qualify as a potential key reversal week. We have seen reversal weeks in the past and each time, after a short pullback, the markets turned back up, once again making new highs. Will we do that again? After watching a short flurry of selling value stocks and buying growth stocks they reversed course once again and growth stocks were sold and value stocks purchased. A defensive move. We saw that with the FAANG stocks. Facebook lost its lustre, falling 2.6%, while Apple made new all-time highs but managed to hold on to a 0.9% gain. Amazon, however, did the opposite—making new all-time highs, then reversing and closing down 3.9%. Netflix lost 1.1% while Google survived, making new all-time highs and holding on to a 1.8% gain. Microsoft did the same, closing up 1.0%. Tesla dropped 1.9%, Twitter was down 3.7%, Baidu was off 1.0%, and Nvidia fell sharply down 9.4%. Alibaba gained on the week, up 3.0%. The mother of value stocks, Berkshire Hathaway, fell 1.0%. There is support for the NASDAQ at 14,250 but a break under that level could send it down to 13,760. Under that level would be a more serious break and we could fall towards the 200-day MA near 13,100. New highs would change this scenario.
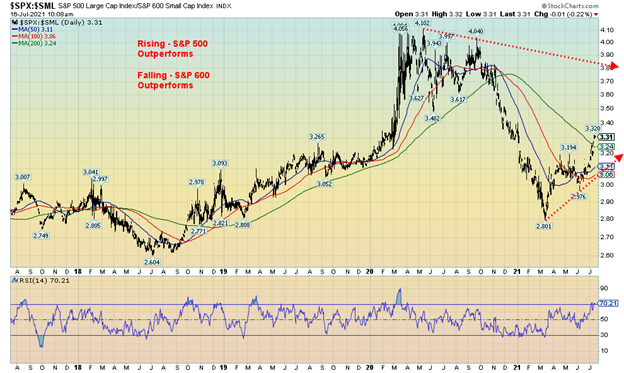
The pandemic crash of March 2020 was an oddity because once the crash passed the market switched into favouring small cap stocks (the S&P 600) over large cap stocks (S&P 500). This is well illustrated in this chart of the S&P 500:S&P 600 Ratio. The S&P 500 represents large cap stocks while the S&P 600 represents small cap stocks. Since March 2021 the ratio is up 18% in favour of the S&P 500. It is now trying to break out over the 200-day MA, a positive development. However, the 200-day MA could also act as resistance and a pullback develops. We have noted a bit of shift recently to risk growth stocks again from large cap value stocks. So, it is not yet certain that a longer-term shift to value stocks is complete. However, trends tend to last for a considerable period. The last trend for the ratio in favour of S&P 500 lasted from a low in 2018 to a peak in early 2020. If the ratio were to fall back under 3.0, then the odds favour new lows and the place to be is in small cap stocks.
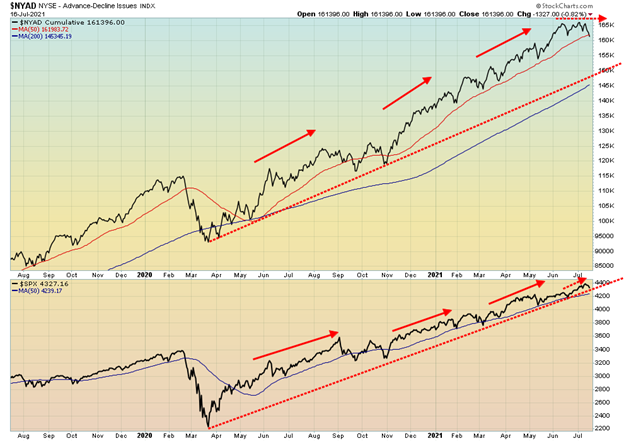
It has been some time since we’ve seen a divergence between the NYSE advance-decline line and the S&P 500. But this past week the S&P 500 has been making new highs even as the advance-decline line has been turning down. The AD line also made a lower high. Divergences like are often seen before a change in direction. So far, nothing is conclusive yet but Friday’s drop for the S&P 500 was telling. As well, the AD line has fallen below its 50-day MA while the S&P 500 remains above its 50-day MA. All this indicates to us that, at minimum, a stealth correction is underway.
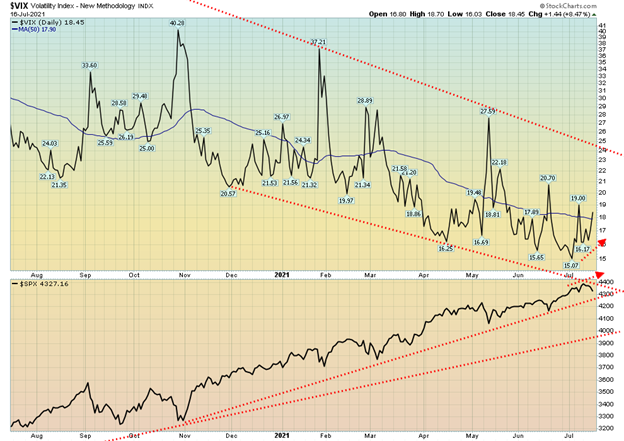
There are divergences on the VIX Volatility Indicator as well. This past week the S&P 500 was making new highs but the VIX was making a higher low (the VIX moves inversely to the S&P 500). Divergences like this often come before a change in direction. That’s another warning sign.
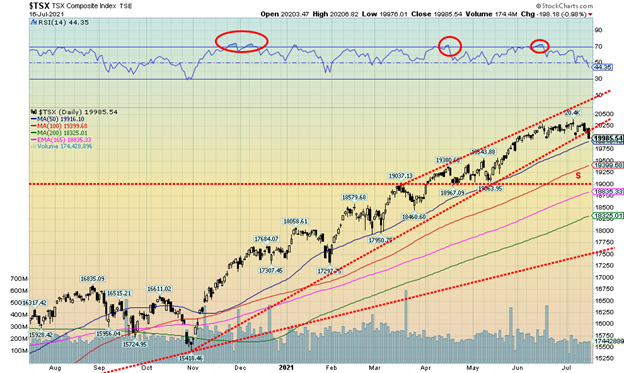
Is the TSX rally now on hold? This past week the TSX Composite fell 1.3% and broke under the uptrend line that had been in place since November 2020. No new highs were seen this past week. There is support just below to 19,900 but under that the next level of support is not seen until 19,400 and 19,000. There has been no extended period of corrective action seen since last year when, from August to October 2020, the TSX pulled back by 8.4%. That correction was interesting as time-wise it lasted about two months vs. the steep correction seen in March 2020 that was considerably deeper but was over quickly in less than a month. Right now, this is a correction that could in the end be similar to the one seen last year August to October. That could change quickly if the TSX were to accelerate to the downside, breaking under 19,000. A 10% correction now would take us down to around 18,400 which happens to be near the 200-day MA currently at 18,325.
This past week, of the 14 sub-indices only five of the 14 were up on the week led by Consumer Staples (TCS), up 2.3%. The TCS also saw new highs. Others seeing new highs were Real Estate (TRE) +0.2%, Telecommunications (TTS) +0.4%, and Income Trusts (TCM) which, however, reversed and fell 0.4% on the week. Other gainers were Utilities (TUT) +0.3% and Golds (TGD) +0.2%. Of the nine losers, Health Care (THC) fell 8.4% and Energy (TEN) dropped 7.8%. Consumer Discretionary (TCD) fell 2.3% and Information Technology (TTK) dropped 2.5%. The TSX itself lost 1.3% while the TSX Venture Exchange (CDNX) fell more, down 3.2%.
The TSX advance-decline line has been deteriorating for the past few months, indicating that rotating corrections were going on. Even as some were going up others were going down. We may have seen the culmination of that this week with the breakdown on the uptrend line. We continue believe, however, that no major correction will be seen and any pullback now will not be dissimilar to the one seen last August/October.
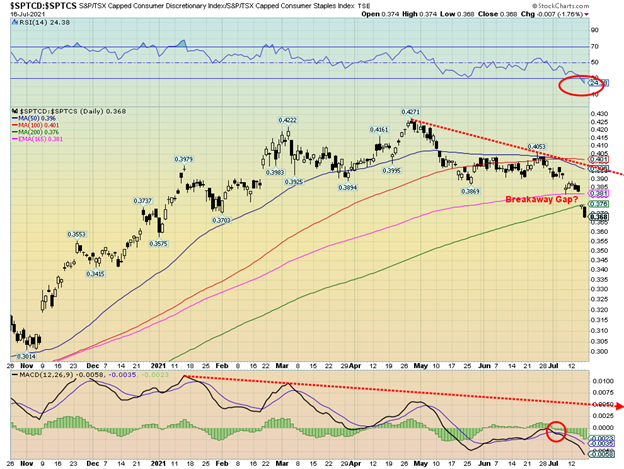
Are the TSX Consumer Discretionary Index (TCD) and the TSX Consumer Staples Index (TCS) changing directions? This past week the TCD was down but the TCS was up. We think of the TCS as defensive stocks. Suddenly the market is getting defensive. Others have noted this as well. This past week also saw the TCD/TCS ratio gap down. That’s something we haven’t seen since that gap up at the left of the chart back in November 2020. That signaled a buy TCD sell TCS. Now it is the opposite: buy TCS and sell TCD. With the ratio falling in favour of the TCS it is suggesting a sell-off on its way. Only note is that the RSI is now under 30 so it is a bit oversold. However, these things can remain in that position for some time.
U.S. 10-year Treasury Bond/Canadian 10-year Government Bond (CGB)
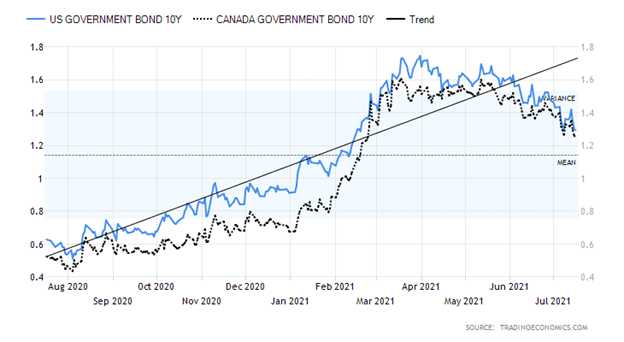
Despite all the talk about higher bond yields because of rising inflation, the bond market seemed to defy that conclusion this past week: the U.S. 10-year treasury note fell from 1.35% the previous week to 1.29% a decline of 4.4%. Canadian yields fell as well as the Government of Canada 10-year bond (CGB) fell to 1.25% from 1.32%. As we noted in our opening, bond yields fell despite stronger than expected CPI and PPI and retail sales. If the bond market is anticipating the future, then the outlook is not as rosy as many would like it to be. Besides being well below unemployment levels seen pre-pandemic, the Delta variant is now rearing its ugly head and U.S. cases have shot up from a recent low 7-day average of 12,000 cases/day to the current 31,000 cases/day. The U.S. hit a high this past week of over 40,000 cases. These cases are hitting primarily the unvaccinated (99%) in low-vaccination states, predominately Republican states where resistance to vaccination is the strongest. As well, with the recent decline of high-flying commodities such as lumber, it is possible the bond market is anticipating that inflation will cool following its initial surge. This would fit with the scenario favoured by the Fed and other central banks that inflation is transitory or temporary, however one wishes to frame it. While the bigger trend over the past year has seen interest rates rise, it is possible that the trend will turn more firmly to the downside. Reversion to the mean suggests a decline to the 1.15%–1.20% zone.
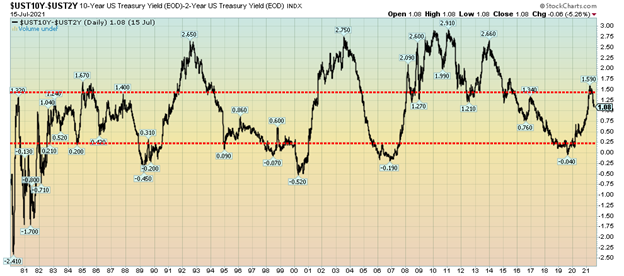
Is the yield curve flattening? The 2-year treasury note/10-year treasury note spread has been falling the past few weeks as bond yields come down. The spread, known as the 2–10 spread is now at 1.08%, the lowest level seen since January 2021. It is possible that this is just an overdue pullback similar to the case that the current rally in the 10-year treasury note yield is just temporary before we see higher levels once again. Our line in the sand is at 0.75%. If the spread were to fall below that level, then the odds begin to favour further declines ahead. As we have seen before, if the spread were to go negative (yes, we are long way from that) then it would also be signaling a potential recession ahead. Notice how previous periods that saw a negative 2–10 spread presaged recessions in 1990–1991, 2000–2002, 2007–2009, and more recently the pandemic recession.
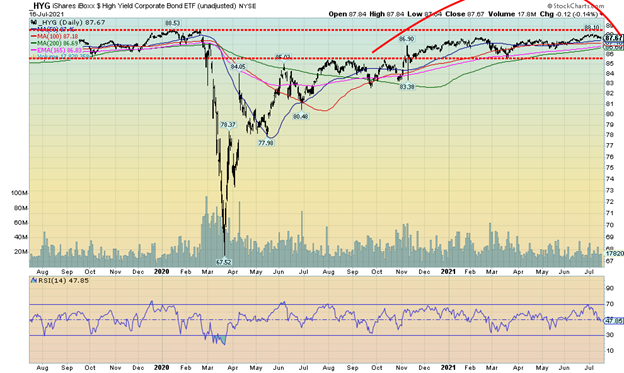
For several months now the iShares iBoxx High Yield Corporate Bond ETF (HYG) has been tracing out what appears to be a rounding top pattern. This sideways pattern, like so many patterns, can have dual scenarios. The bearish scenario is that this is a rounding top and the breakdown takes place under 85.50. The bullish scenario is this is a consolidation sideways pattern with a slight upward tilt. A breakout above 88.50 would be quite positive and could then see the HYG rise to 91 or higher. The downside breakdown could take it to under 83. Junk bond spreads to the 10-year are at or near the lowest level ever seen currently at 6.00%. To put that in perspective, the AAA spread is at 0.48% while the BBB spread, which is the lowest investment grade bond rating, is at 1.11%. A breakdown in the HYG would see bond spreads widen. And that in turn could be problematic for the corporate bond market that is heavily weighted to BBB and lower credit ratings.
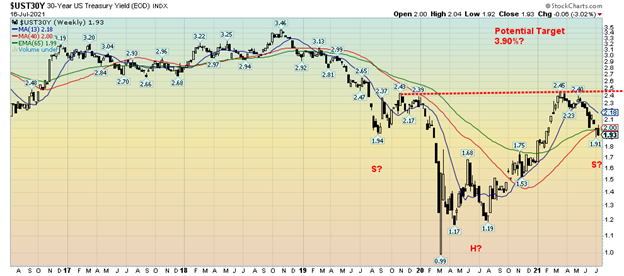
The U.S. 30-year treasury note is forming a potential head and shoulders bottom. Arguably it could be forming the same on the 10-year but we admit it is not quite as clear. And this potential head and shoulders bottom pattern is not perfect by any means. A couple of things stand out. First, the neckline is slanted upwards whereas in a classic head and shoulders bottom pattern the neckline should be slanted downward. Second, the right shoulder has made a slightly lower low below the low of the left shoulder. Again, in a classic head and shoulders pattern the low of the right shoulder should not exceed the low of the low of the left shoulder. Nonetheless, it is worth noting. A firm breakout above 2.45% could project the 30-year up to as high as 3.90% with a minimum objective of 2.75%. That would take the 10-year to an objective up to 3.10% or, at minimum, a rise to 2.00%. The right shoulder’s low is more pronounced on the 10-year with the low thus far at 1.29% vs. the low on the left shoulder at 1.50%. So, while there is a possibility that we are seeing a reverse head and shoulders bottom pattern, we are currently putting low odds that it would actually work out that way. However, we wanted to point out the possibility.
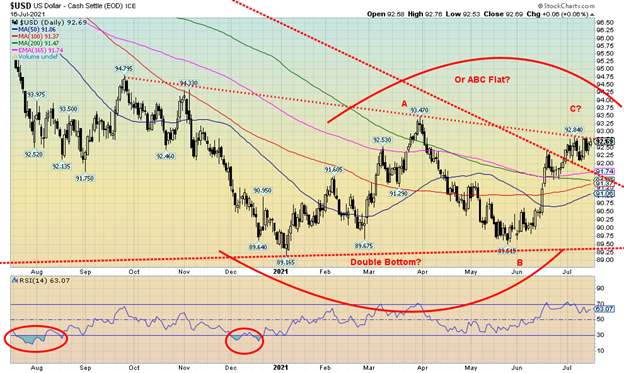
The next direction of the US$ Index has become somewhat clouded. We see two scenarios here. One with the US$ Index bullish, the other bearish. This past week the US$ Index gained 0.6% but fell short of breaking out. The euro fell 0.6%, the Swiss franc was off 0.6% as well, and the pound sterling dropped about 1.0%. The Japanese yen went slightly against the grain with a small gain of about 0.1%. The Canadian dollar has probably topped as it fell about 1.3% and is now down about 5% from its recent high of 83.28. However, the Canadian dollar is now oversold and is hitting support at its 200-day MA. A breakdown under 79 could send the Canadian dollar tumbling further.
There are two scenarios developing for the US$ Index. One is the double bottom scenario with the low at 89.17 in January and a secondary low of 89.52 in May. The neckline is around current levels. A firm breakout above 92.85 could project the US$ Index up to 97.00/97.25. The bearish scenario stands on the rebound since the January 2021 low of 89.17. Waves have unfolded in three’s; i.e., ABC-type patterns. Those are corrective waves. A larger ABC wave is forming with the first top at 93.47 (A wave) and the low at 89.52 (B wave). We are currently working on the C wave of what appears as an ABC flat. The current C wave could give off a false signal by breaking above 92.85 and printing new highs just above 93.47 before failing.
Gold is reacting to the stronger US$ Index with its current weakness. A further rise in the US$ Index could pressure gold lower, subject to the breakdown points outlined in our gold commentary. The US$ Index has two scenarios. If it is truly bullish, the push above 92.85 will be strong; however, a weak push above that level could soon see a flame-out near or just above the previous high of 93.47.
While gold rose for the fourth consecutive week, the gain this past week was feeble. Gold was up 0.2%. Silver did not join gold as it fell 1.6%. Our high preference is that silver and gold stocks lead the way and right now that is just not happening. The gold stocks were weak, even as the TSX Gold Index (TGD) gained a small 0.2% but the Gold Bugs Index (HUI) fell 1.4%. Platinum had a good week, gaining 1.2% but palladium hit a wall, falling 6.2% and copper was off 0.7%. Somewhat soothing words from Fed Chairman Jerome Powell reiterated that the Fed’s stance that inflation is transitory and the current interest rate levels and QE will be maintained. But the inflation numbers, coupled with stronger than expected retail sales for June and a stronger US$ Index, helped push gold back. While bond yields have fallen there remains fear that bond yields could rise further again because of inflation.
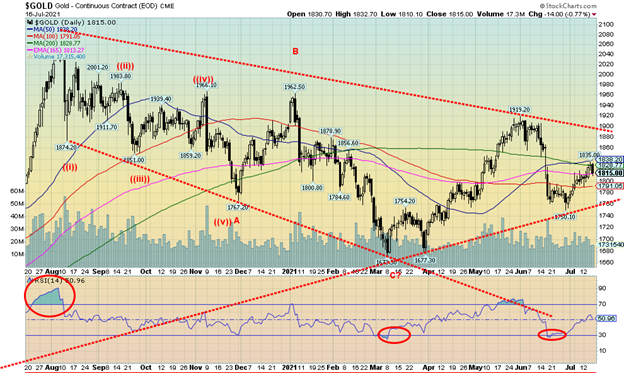
We had stated that gold had resistance at the $1,820/$1,830 zone. So, what happened? Gold hit a high this week of $1,835 but failed to close over the zone and then fell back sharply on Friday, losing about $17 and closing at $1,815. In the wide-ranging week, the week’s low was at $1,791. If gold can break above $1,830 then the next resistance level is at $1,840/$1850. Above $1,850 things look better to challenge major resistance at $1,900/$1,920. Right now, that feels distant. To the downside $1,790 now becomes important. A breakdown under that level sets up a test of $1,750 and a breakdown under $1,750 is more dangerous setting up a possible test of the March low of $1,673. While we remain optimistic that a rally of some substance will get underway this summer, we are cautionary about those points. A further rise in the US$ Index would be negative for gold. Like gold, the US$ Index is either on the cusp of a breakout or a failure.
Gold’s role as a hedge against inflation has not yet taken hold. The Fed may state they believe inflation is transitory but even they don’t know how long this current bout will last. However, QE will continue and interest rates will continue to be held where they are. Yes, the economy is improving but remains well below levels seen before the pandemic. Gold will rally when they perceive more risk from the monetary authorities and see deterioration in government as the current polarized world of the U.S. continues to unravel. Our eye is watching $1,790 nervously. Interesting then that the low on the week was $1,791.
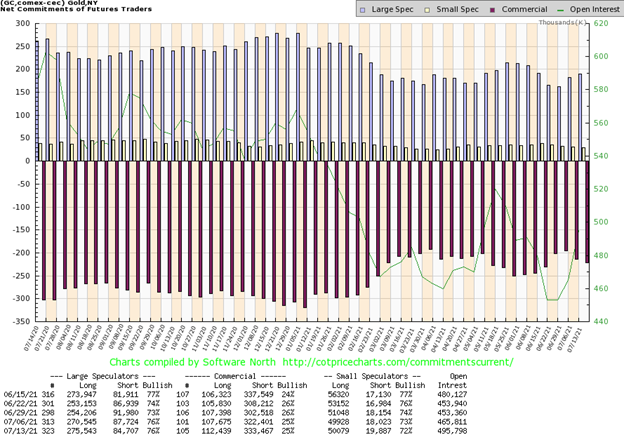
The commercial COT (major gold producers and bullion banks) was unchanged this past week at 25%. Long open interest jumped almost 5,000 contracts while short open interest also jumped about 11,000 contracts. Overall open interest rose almost 30,000 contracts on a small up week. The large speculators COT (hedge funds, managed futures, etc.) was unchanged at 76%. The large speculators COT is still a bit high for our liking and the commercial COT a bit low. But the improvement on the long side is welcome even if offset on the short side.
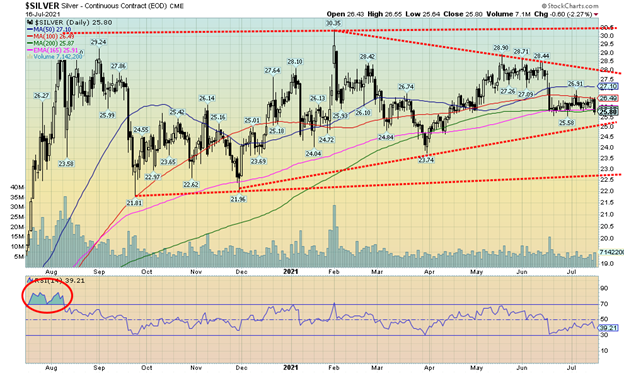
Silver continues to look like it is forming a rising triangle over the past several months. However, there remains considerable uncertainty as to the next direction. Silver did not fare well this past week, falling 1.6% and is now down 2.3% on the year. We are now nervously eyeing some support at $25.55 and key support at $25. If they should fall, silver could fall further with potential targets down to $18.50. Silver bulls would not want to hear that. But as we stated with gold the key is the U.S. dollar that has been rallying of late and threatens to go higher. Considerable resistance lies above at $27/$27.10, then again at $28. Above $28 things are looking up and above $29 new highs above the February high of $30.35 are probable.
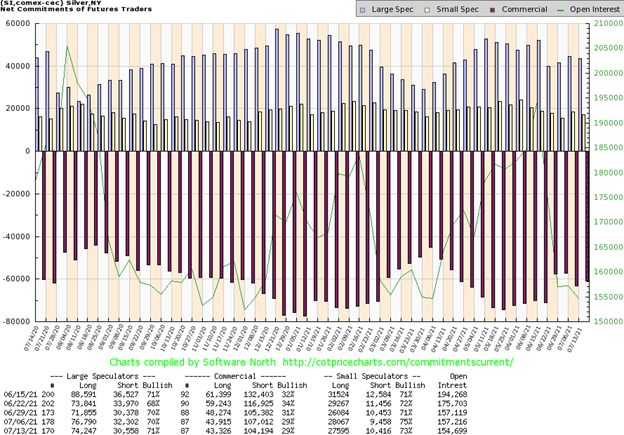
The commercial COT for silver was unchanged this past week. There was little real movement. Long open interest dropped about 600 contracts while short open interest fell almost 3,000 contracts. Overall open interest dropped about 3,000 contracts in a down week. The large speculators COT rose to 71% from 70%. A mild improvement for the COT. So, we will continue to try and be optimistic that a major bear move is not about to happen. We’d have preferred to see this at least in the 30s. Three weeks ago we were at 34%.
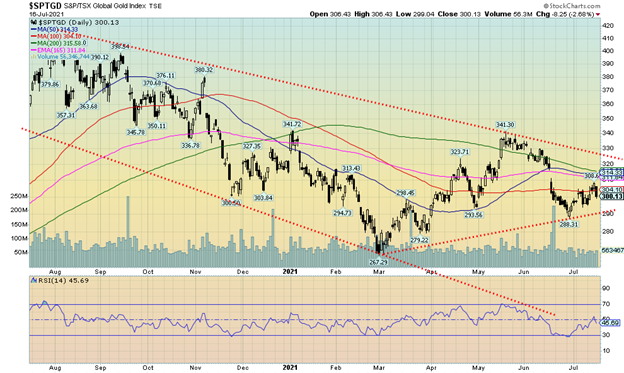
Gold stocks just cannot seem to find any traction. It is possible that a nascent rally is underway, but just as things start to look up, they get smacked right back down again. On the other hand, strong uptrends are ones that see a rally, then a pullback, then another rally, another pullback, etc. Those tend to be the strongest uptrends whereas one that goes straight up is highly suspect. This past week the gold stocks were quite mixed and even the gold stock indices were mixed. The Gold Bugs Index (HUI) fell 1.4% but the TSX Gold Index (TGD) gained 0.2%. This was against the backdrop of gold up small on the week while silver fell. The gold stocks were mixed, just like the metals themselves. The TGD is struggling here at the 100-day MA to break over it. There is support down to 290 and the recent low at 288. But under that level the March low of 267 starts to come into sight. The Gold:HUI ratio is back at 6.85, almost as high as it was in February 2021 when it hit 7.09. The all-time high was 10.90 set in September 2015 and more recently the ratio hit a high of 9.76 in March 2020. At the other end, the ratio hit 1.56 in November 2003 at a time that the gold stocks were clearly outperforming the metals. Gold stocks have been largely underperforming now for the past eight years save for periodic strong rallies. At these levels the gold stocks are considered cheap compared to gold. With the TGD struggling here at the 100-day MA they need to quickly regain 308 the recent high; however, they will then face further resistance from 311 up to 315. Above 315 the gold stocks are beginning to look up and above 325 a major breakout could occur. The TGD is well down from its August 2020 high near 417 (down 28%). By that definition the gold stocks have been in a bear market now since November 2020. Since last bottoming in June the TGD is up 4% but remains down 4.8% on the year. The HUI is even worse, down 11.5% thus far in 2021. Keep in mind, however, that the TGD gained 21% in 2020 and 40% in 2019 so a correction was due. And we are still up about 15% from December 31, 2019.
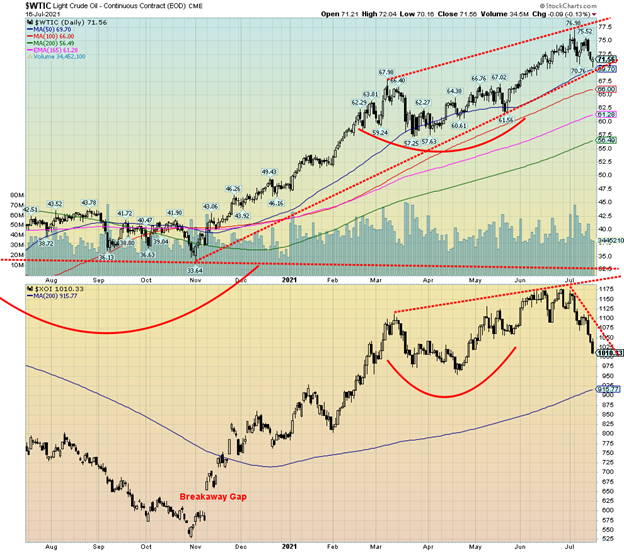
So, is it going to be that oil prices keep on rising or are they about to take a tumble? Judging from all the goings-on with OPEC and Saudi Arabia and the UAE agreeing to some sort of deal to possibly raise production even as demand in the U.S. falters, this raises the potential for further price declines. WTI oil fell 4.0% this past week. A lower high was made at $75.52 vs. the earlier high of $76.98. The energy stocks now appear to be in full breakdown mode. The ARCA Oil & Gas Index (XOI) fell 8.5% this past week while the TSX Energy Index (TEN) dropped 7.8%. The XOI has some support, coming up just under 1,000 but a breakdown under 990 could signal an even steeper decline. The points for the TEN are at 115 and 110. More likely, however, in looking at the chart is that we do get a rebound on the TEN and XOI. But could that be a left shoulder and head forming with the right shoulder to come?
OPEC has uncertainty because we don’t have details on how they will bring back production nor do we know what other members might do. There is considerable tension within OPEC. Nonetheless, OPEC seems to agree that demand will rise in 2022 closer to pre-pandemic levels. However, no one seems to take into effect the spread of the COVID variant in a generally unvaccinated world. No one, however, is predicting the death of fossil fuels because of the rise of alternative clean energy.
There is support for WTI oil down to around $69.70, but under $69 oil could fall further towards $66. Major support can be seen between $57 and $61. Only a breakout to new highs now can change the current scenario that sees oil prices falling further.
—
(Featured Image by Erol Ahmed via Unsplash)
DISCLAIMER: This article was written by a third party contributor and does not reflect the opinion of Born2Invest, its management, staff or its associates. Please review our disclaimer for more information.
This article may include forward-looking statements. These forward-looking statements generally are identified by the words “believe,” “project,” “estimate,” “become,” “plan,” “will,” and similar expressions. These forward-looking statements involve known and unknown risks as well as uncertainties, including those discussed in the following cautionary statements and elsewhere in this article and on this site. Although the Company may believe that its expectations are based on reasonable assumptions, the actual results that the Company may achieve may differ materially from any forward-looking statements, which reflect the opinions of the management of the Company only as of the date hereof. Additionally, please make sure to read these important disclosures.
David Chapman is not a registered advisory service and is not an exempt market dealer (EMD) nor a licensed financial advisor. We do not and cannot give individualised market advice. David Chapman has worked in the financial industry for over 40 years including large financial corporations, banks, and investment dealers. The information in this newsletter is intended only for informational and educational purposes. It should not be considered a solicitation of an offer or sale of any security. Every effort is made to provide accurate and complete information. However, we cannot guarantee that there will be no errors. We make no claims, promises or guarantees about the accuracy, completeness, or adequacy of the contents of this commentary and expressly disclaim liability for errors and omissions in the contents of this commentary. David Chapman will always use his best efforts to ensure the accuracy and timeliness of all information. The reader assumes all risk when trading in securities and David Chapman advises consulting a licensed professional financial advisor before proceeding with any trade or idea presented in this newsletter. David Chapman may own shares in companies mentioned in this newsletter. We share our ideas and opinions for informational and educational purposes only and expect the reader to perform due diligence before considering a position in any security. That includes consulting with your own licensed professional financial advisor.


The TopRanked.io Guide to 2026’s Biggest and Best Affiliate Opportunities
Want to earn affiliate commissions on literal billions of dollars worth of revenue? Then this week, we've got something special...


Eni Advances Energy Transition with Major Investment and Emissions Cuts
Eni showcased its “Just Transition” report in Rome, highlighting stakeholder collaboration and progress toward decarbonization goals. The company invested over...


The German Fintech Market Shows Resilience and Strong Investment Growth in 2026
Germany’s fintech sector remained resilient in 2026 despite economic crisis and rising insolvencies. Investments reached €14.2 billion, showing strong investor...


Cannabis Legalization in Germany: A Mixed Interim Assessment
Germany’s cannabis legalization has reduced criminal cases and eased pressure on the justice system, while the black market is slowly...


Sustainable Restoration of the Haus Hövener Garden in Brilon
The Brilon Construction Workers Association is restoring the Haus Hövener garden into a cultural community space, funded through a €10,000...
 |
|
 |  |
 |
|
-

 Biotech1 week ago
Early Use of Tirzepatide Shows Strong Results in Type 2 Diabetes Study
-

 Africa6 days ago
Morocco at an Energy Crossroads Amid Global Gas Volatility and Critical Minerals Opportunity
-

 Impact Investing2 weeks ago
Italy Advances Recycling but Infrastructure Gaps Threaten EU Targets
-

 Biotech3 days ago
EFPIA Warns Limited SPC Reform Could Weaken EU Pharma Competitiveness