Featured
Markets remain unaffected following Trump’s Iran oil sanction threat
Another week and another record high (close) for the S&P 500, the NASDAQ and the TSX.

The markets keep chugging higher. All seems good. No sign of recession as even our recession watch spread widened this past week. Markets are impervious to negative news. No major divergences and indicators remain positive. All is good. Or is it?
The market keeps chugging higher. Well, maybe chugging is not quite the right word as this past week’s markets were decidedly mixed. Decent earnings and a Q1 advance GDP growth of 3.2% year over year, coupled with low inflation, did the trick. The S&P 500 gained 1.2% on the week and closed at a record high although the index did not actually make a new all-time high, falling ever so short. Not so the NASDAQ as it closed at a record high and made a new all-time high, gaining 1.9%. The Dow Jones Industrials (DJI) faltered and closed down on the week by a small 0.06%. The Dow Jones Transportations (DJT), thanks to high oil prices, lost about 1%. The TSX continued its recent record climb, making a new all-time high once again but closing the week largely unchanged.
The markets appear to be impervious to any negative background news. Trump continues to threaten Iran, given the US’s recent demand for purchasers of Iranian oil to halt immediately as they end sanction exemptions. That the attack on Iranian oil exports is tantamount to an embargo, an all-out act of war, appears to be irrelevant. In the same breath, Trump demanded that Saudi Arabia and others pump more oil to make up the difference and help lower the cost of oil. Oil prices went up, then down this past week. Terrorist attacks also appear to be irrelevant as far as markets are concerned. New Zealand, Sri Lanka, and San Diego—it’s all the same.
And, also, once-in-a-century flooding in Ontario, Quebec, and elsewhere appears to be irrelevant to markets. Actually, that should be rephrased to say the second—or is it the third or fourth—”once-in-a-century” flooding over the past few years as the ravages of climate change continue. Totally ignored is that most of the immigration from Latin American countries are also being driven by climate change as once-lucrative coffee-growing falls due to increased temperatures and drought.
What’s important is earnings, economic growth, and low inflation. Add in ample liquidity and one has the makings of a bull market that some say could end in a melt-up. Maybe it’s already happening as the S&P 500 has gained 25.3% since the December lows. The TSX Composite is up a stellar 20.6%. Not all indices have joined the new-highs party. The DJI still lags and the DJT is starting to really lag. But then divergences at major tops are not unusual. We just haven’t determined that a top is being made yet. We are approaching “sell in May, and go away,” as the saying goes. Maybe this year the old adage will be ignored.
Indicators are showing no major divergences, another condition necessary to suggest a top. But even at that, divergences in indicators can persist for some time before the market actually breaks. Same with overbought conditions. We note a couple of indicators below.

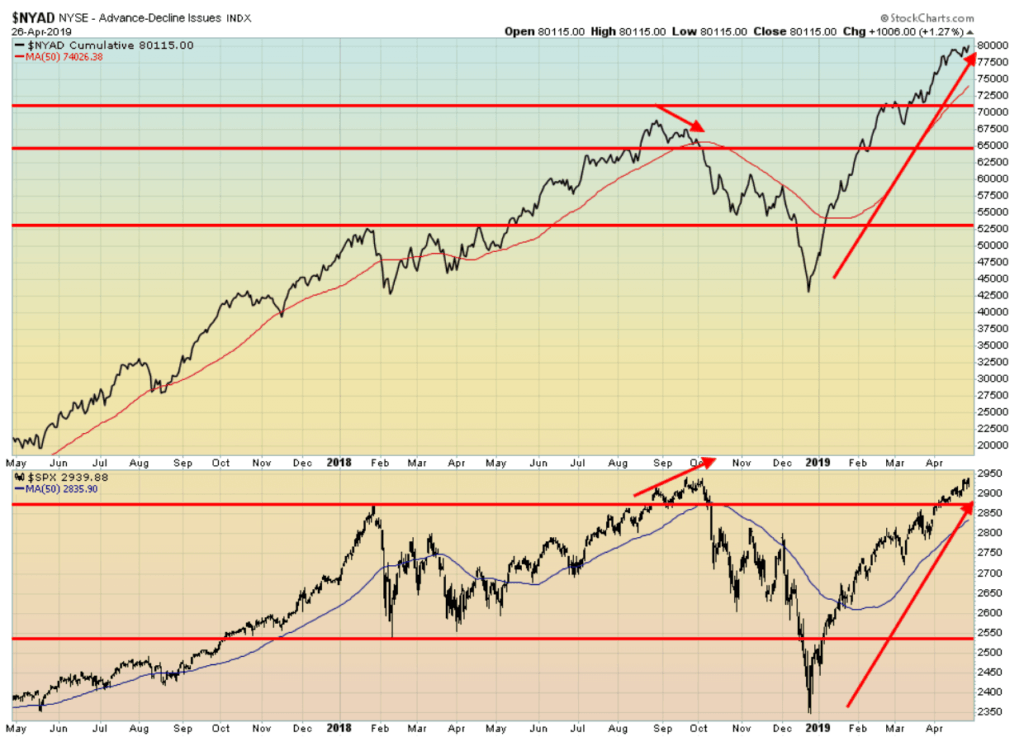
The NYSE advance-decline cumulative issues continue to chug to new highs. And now the S&P 500 is joining it—confirmation at last, it seems. And no divergences, as was seen at the highs last August/September 2018 before an upwards of 20% drop into December 2018. But we note that the NASDAQ advance/decline cumulative line is nowhere near its all-time highs, even as the NASDAQ has made new all-time highs.
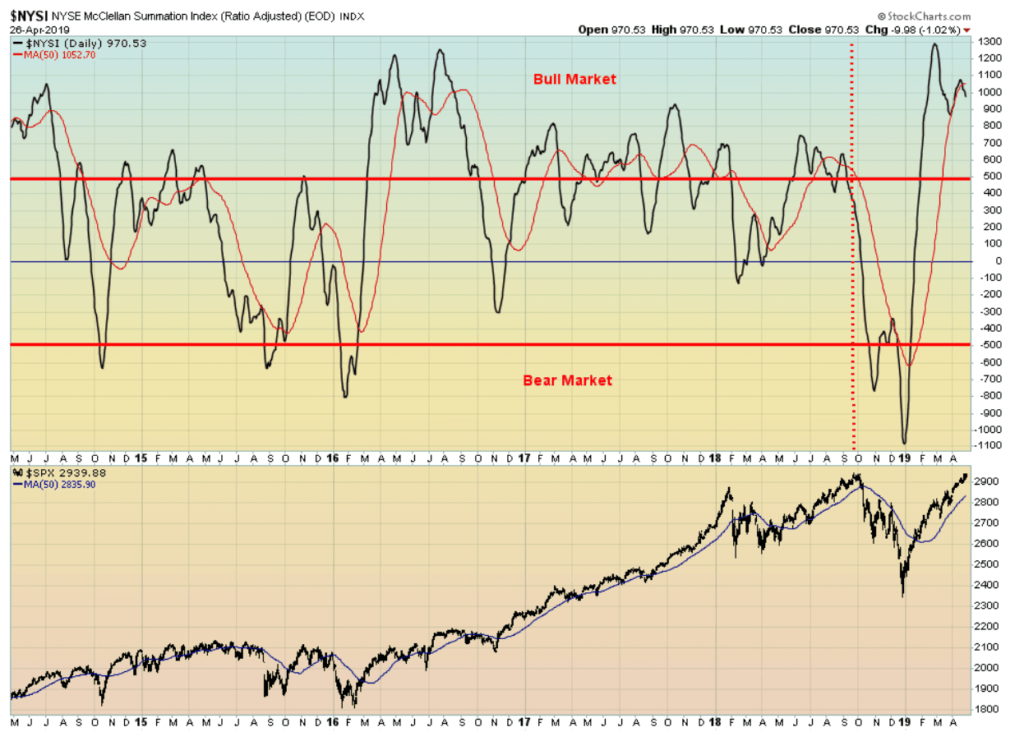
An even better indicator below is the McLellan Summation Index (ratio-adjusted) or RASI Index. A strong NY advance-decline line does produce high readings in the McLellan Oscillator and that pushes up the summation index. This is the ratio-adjusted summation index that does have some differences with the summation index. We’ll skip the math definitions. The RASI remains at high levels. It has not even budged below 500 as the market chugs higher. Lots of liquidity is probably driving the market. We note that hedge funds are piling in as the market goes higher as well and that could help push it higher still. Note that when the market made its high last August/September the RASI had already fallen below 500. Not this time, which is another positive sign.
We expect the market is probably headed even higher and, as we have noted, we have seen no sign of a top even as some divergences creep in.

Gold rebounded this past week. A strong Friday pushed gold up 1% on the week. Gold has still not fulfilled our targets of at least $1,250 so we suspect that, once this rebound is out of the way, another wave down could get started. Silver also rebounded but its gain was only 0.4%. We’d prefer to see silver out in front. The commercial COT for gold continues to improve, jumping to 42% this past week, up from 39%. Long open interest jumped roughly 9,000 contracts while short open interest fell roughly 12,000 contracts. The commercial COT is still not where we’d like to see it, but the direction is very positive. The silver commercial COT also improved to 45% from 44%.
We can’t help but notice that populist attacks against the central banks continue. Trump continues to assail Jerome Powell and the Fed even as his candidate Herman Cain was forced to withdraw and Stephen Moore looks shaky. That won’t stop Trump. He’ll find some other unqualified cronies that toe his line. But the Fed isn’t the only one under attack as Brexiters are attacking Mark Carney of the BOE and there are indications that there could be a struggle at the ECB to gain a populist foothold at the levers of monetary policy. The Economist has commented on the attacks on central banks with its lead article last April 13: “Interference Day – Independent central banks are under threat. That is bad news for the world.”
Any attempt by Trump to fire Jerome Powell could trigger an upward reaction in gold prices. There has been interference in the Fed in the past but no one has attempted to outright fire the Fed Chairman.
Markets continue to want to move higher. There is little sign of a recession. Our recession watch spread (10-year—2-year U.S. Treasuries) rose to 23 bp this past week, the highest level seen in weeks. All seems to be good if you are an investor.
(Featured image by DepositPhotos)
—
DISCLAIMER: David Chapman is not a registered advisory service and is not an exempt market dealer (EMD). We do not and cannot give individualized market advice. The information in this article is intended only for informational and educational purposes. It should not be considered a solicitation of an offer or sale of any security. The reader assumes all risk when trading in securities and David Chapman advises consulting a licensed professional financial advisor before proceeding with any trade or idea presented in this article. We share our ideas and opinions for informational and educational purposes only and expect the reader to perform due diligence before considering a position in any security. That includes consulting with your own licensed professional financial advisor.

-

 Business1 week ago
Legal Process for Dividing Real Estate Inheritance
-

 Fintech5 days ago
PUMP ICO Raises Eyebrows: Cash Grab or Meme Coin Meltdown?
-

 Africa2 weeks ago
Morocco Charts a Citizen-Centered Path for Ethical and Inclusive AI
-

 Africa9 hours ago
Surging Expenditures Widen Morocco’s Budget Deficit Despite Revenue Growth


