Markets
U.S. Faces Echoes of Past Empires as Markets Soar Amid Economic Strains
The U.S. may be showing signs of imperial decline, echoing past collapses like Rome or Britain, with risks of civil unrest unless major reforms occur. The Fed cut rates as expected, fueling record stock highs led by the MAG7, though economic weakness persists. Gold dipped temporarily, while oil stocks appear seasonally strong.

Sir John Templeton’s words were always prophetic. Economists Carmen Reinhart and Kenneth Rogoff used the words for the title of their book, This Time is Different: Eight Centuries of Financial Folly (2009). Their book covered 66 countries across five continents and eight centuries. The book is comprehensive look at financial crisis – including government defaults, banking panics, inflationary spikes from medieval currency debasement to the sub-prime disaster and financial crisis of 2008. The book might be a slog for many, but it remains one of the best empirical investigations of financial crisis ever published according to Niall Ferguson, British-American historian and author of The Ascent of Money (2009) and many others.
Documenting the history of how empires rise and fall and how societies collapse has been studied by many. Books that come to mind include Collapse: How Societies Choose to Fail or Succeed (2005) by Jared Diamond and Failed States: The Abuse of Power and the Assault on Democracy (2006) by Noam Chomsky. But these are just two amongst many. One common thread is the ability to analyze the past in order to predict the future. But few pay attention to the past, with the result that the past repeats itself over and over again and there is nothing we can do about it. It is a process leading to collapse and few see it until it is staring us in the face.
So where are we today? It may surprise some that we appear to be well on our way to another collapse. It’s like the quote from Ernest Hemingway’s novel The Sun Also Rises (1926): “How does one go bankrupt? Two ways. Gradually, then suddenly.” There are common themes that play out that inevitably lead us to collapse, such as these, which we have gleaned from a number of sources:
- Inequality
- Military overextension
- Currency debasement and collapse
- Spiralling debt and fiscal crises
- Erosion of democracy and polarization
- Social decay
- Loss of productive capacity
- Sudden implosion
Today we are seeing all of these things. Except we haven’t hit number 8 yet. It is impossible here to go into each one in detail, so we’ll give a brief description of each:
1.Inequality. Of the G7 countries, the U.S. has the highest inequality for both income and wealth. Most inequality measurements note income inequality both before and after tax but there are also measurements of wealth inequality. Today, the U.S. has greater inequality than in either the Gilded Age or the Roaring Twenties. Notably, both those eras ended in a stock market crash and an economic depression.
The Gini Coefficient is the most frequently used measurement. It has a range from 0 to 1, with 0 signifying absolute equality and 1 absolute inequality (one person has all the income/wealth). No one country has an absolute Gini. According to more recent numbers, the U.S. has a Gini Coefficient of 0.48 for income before tax, but it falls to around 0.39–0.41 after tax due to income redistribution policies. The remaining G7 countries have an income Gini over 0.4 but below the U.S. After tax, their Gini falls much further due to stronger income redistribution programs.
As to the wealth Gini, the U.S. has a Gini of 0.8–0.9 as 1% holds about one-third of the wealth while the bottom 50% has a tiny fraction of less than 1%. Noteworthy is Elon Musk with a net worth of $500.1 billion on Forbes’ real-time billionaire list (www.forbes.com/real-time-billionaires/#5c2c14e03d78). If Elon was a country, that would make him the 31st largest country in the world by GDP, behind Austria but ahead of Norway (www.statisticstimes.com/economy/projected-world-gdp-ranking.php).
2. Military overextension. The U.S. has some 166 thousand troops stationed in 178 countries outside the U.S. By comparison, Great Britain at the height of its imperialism was stationed in only about 80 countries. Rome had military in roughly 40 modern countries today. The cost of military extension is extremely expensive. Officially, the U.S. defense budget is around $922 billion, more than the next 10 countries combined. In reality, its defense expenditures are most likely well past $1 trillion. Military overextension drained the treasuries of both Great Britain and Rome, helping to lead them to their eventual demise.
3. Currency debasement and collapse. Since the U.S. took the world off the gold standard in August 1971, the US$ Index (or its equivalent) has fallen about 40%. In terms of purchasing power of gold, the U.S. dollar’s purchasing power has fallen roughly 99%. Currency debasement is not unusual. The Roman silver denarii started as pure silver. Starting with Nero in 64AD the amount of silver was continuously debased until by the end of the 3rd century there was hardly any silver left. Britain constantly devalued its pound. More recently, in 1957, one pound = US$2.79. Today one pound = US$1.31, a decline of 53%.
Then there is BRICS (Brazil, Russia, India, China, South Africa) and its attempts to derail the U.S. dollar as the world’s reserve currency. BRICS, led by China and Russia, trades in yuan and rubles.
Saudi Arabia is poised to accept yuan for oil. A number of countries have engaged in de-dollarization, reducing the use of and dependence on the U.S. dollar, including a number of Eurasian countries known as the “stans,” plus some in Africa.
BRICS nations’ central banks have been accumulating gold at a record pace, over 1,000 tonnes annually, in order to shore up their currencies and lessen the need for U.S. dollar reserves. The BRICS nations, already at 10 members, is looking to expand further. Financial hubs dealing in yuan are expanding. The yuan’s share of global reserves is growing as is its share of world trade.
That said, the U.S. dollar remains the reserve currency with over 70% of global FX trading and use in trade. However, its share of FX reserves in central banks has fallen under 60%. BRICS is building alternatives to the SWIFT payment system, the IMF (International Monetary Fund), the World Bank, and the International Development Bank (IDB) in order to get out from under U.S. global hegemony. Nonetheless, there is no sign that the U.S. is about to lose its reserve currency status. The U.S. dollar may be falling, but the process takes decades.
US$ Index 1971–2025
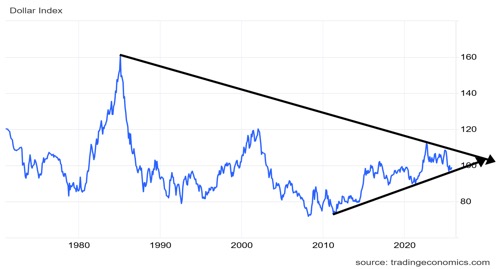
Source: www.tradingeconomics.com,
Spiralling debt and fiscal crises. In August 1971, when Nixon took the world off the gold standard, U.S. debt totalled $412.3 billion. It took almost 200 years to get there. Since then, U.S. debt and global debt have exploded. Today, U.S. federal debt stands at $38 trillion, including $1.8 trillion alone since the end of Q2-2025. In other words, the U.S. adds more debt in a month than it took to build up after 200 years.
Since 1971 the U.S. has had seven recessions: the 1974–1975 oil embargo; the 1980, then 1981–1982 recessions, sparked by the Iranian oil crisis and the tightening by the Fed to bring down high inflation; the early 1990s recession, sparked by the savings and loan crisis, the earlier stock market crash of 1987 and a spike in oil prices due to the Iraq war; the 2000–2002 recession and crisis, sparked by the collapse of the dot.com bubble and the September 11, 2001 (9/11) attacks; the Great Recession and financial crisis, sparked by the collapse of the sub-prime mortgage market that built up during the housing bubble; and the COVID recession, sparked by the pandemic.
Starting from the 1987 stock market crash, the Federal Reserve’s route to prevent a financial crisis and depression has been to flood the system with liquidity (quantitative easing or QE) and lower interest rates sharply, particularly during the Great Recession and pandemic.
The result is that it takes more and more debt to purchase that $1 of GDP following each crisis. Are they running out of bullets? In 1971, U.S. debt to GDP was 36.6%. Today it is 124.3% and rising.
U.S. Debt 1942–2025
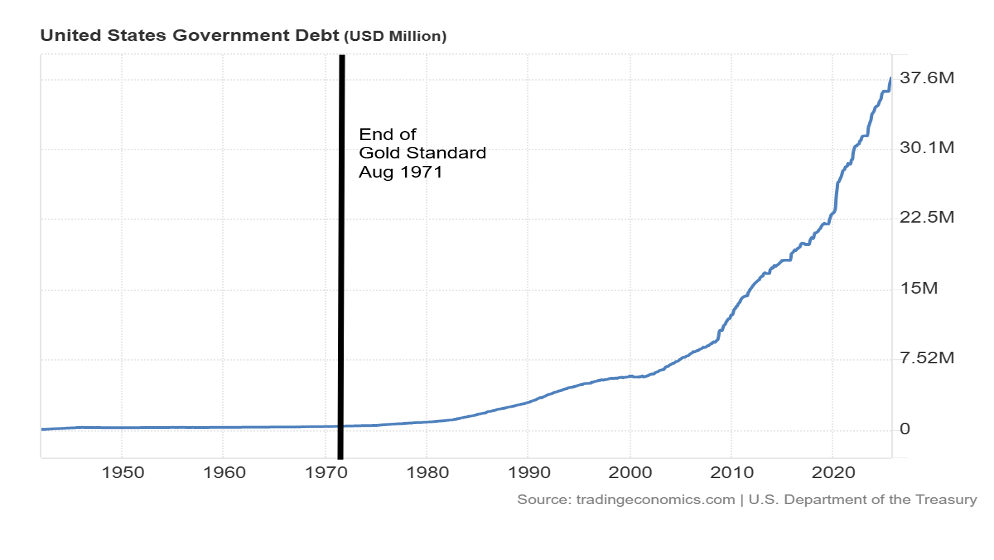
Source: www.tradingeconomics.com, www.home.treasury.gov
Total Debt, Real GDP Annual % Change 1970–2025
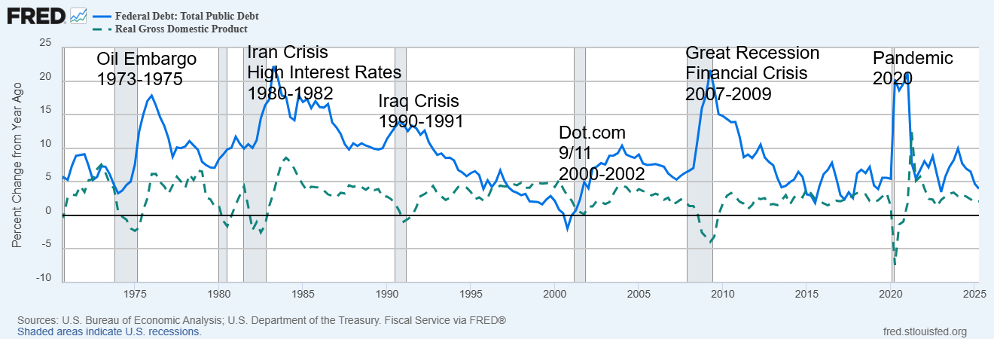
Source: www.stlouisfed.org
Almost consistently since 1970, U.S. federal debt growth has outpaced real GDP growth. It’s an unsustainable pace. It takes more and more debt to bail out the economy and purchase an additional $1 of GDP. The question is, when does a systemic debt crisis hit? The only way out is growth. Instead, they are headed in the opposite direction.
Erosion of democracy and polarization. The U.S. has always had a level of polarization. After all, they fought a civil war over it (1861–1865). But the current polarization really started to get underway in the 1990s, accelerating after the 2000s and intensifying since 2016 and the first election of Donald Trump. Polarization centers around media, cultural identity, and institutions. Since the 2000s there has been a steady erosion of democracy in the U.S., starting with the Supreme Court and the 2000 Bush/Gore election, the “hanging chads.”
Adding to it were the events of 9/11, expanding executive power and surveillance, and the start of gerrymandering to give one party an advantage over the other. The erosion continued into the 2010s and culminated in the January 6, 2021 attack on the Capitol to prevent the certification of the 2020 election. Since the election of Donald Trump in 2024, the U.S. is undergoing a serious erosion in democracy as institutions are attacked – i.e., media, universities, science – plus attempts to influence elections and even hints that the 2026 mid-terms may never happen.
The deportation program is seeing people snatched off the street, including women and children, and deported with no due process in law, some to countries for which they have no connection. Troops have been sent into Democrat cities to quell what they say is rampant crime, sparking confrontations on the street by residents against ICE and the DHS. The Economist lists the U.S. as a “flawed democracy.” In 2024, the last year The Economist published a democracy report, only 25 countries out of 167 or 15% were listed as full democracies.
Social decay. This manifests itself in many ways with the rise in abusiveness on the internet (social media) and polarization, a rise in loneliness due to single-person households, homelessness, drug overdoses, declining civic trust, declining marriage rates and rise of single-parent families, a rise in suicide rates, a rise in teen mental health issues, and a decline in memberships with civic organizations (i.e., church, voter turnout, clubs).
We should add the decline of the middle class to the list. The collapse of the manufacturing sector as it was offshored led to hundreds of thousands of layoffs. These well-paying jobs were never recovered. Add in inflation, the bubble market in housing, stagnating wages and many who would once have been considered middle class are just surviving.
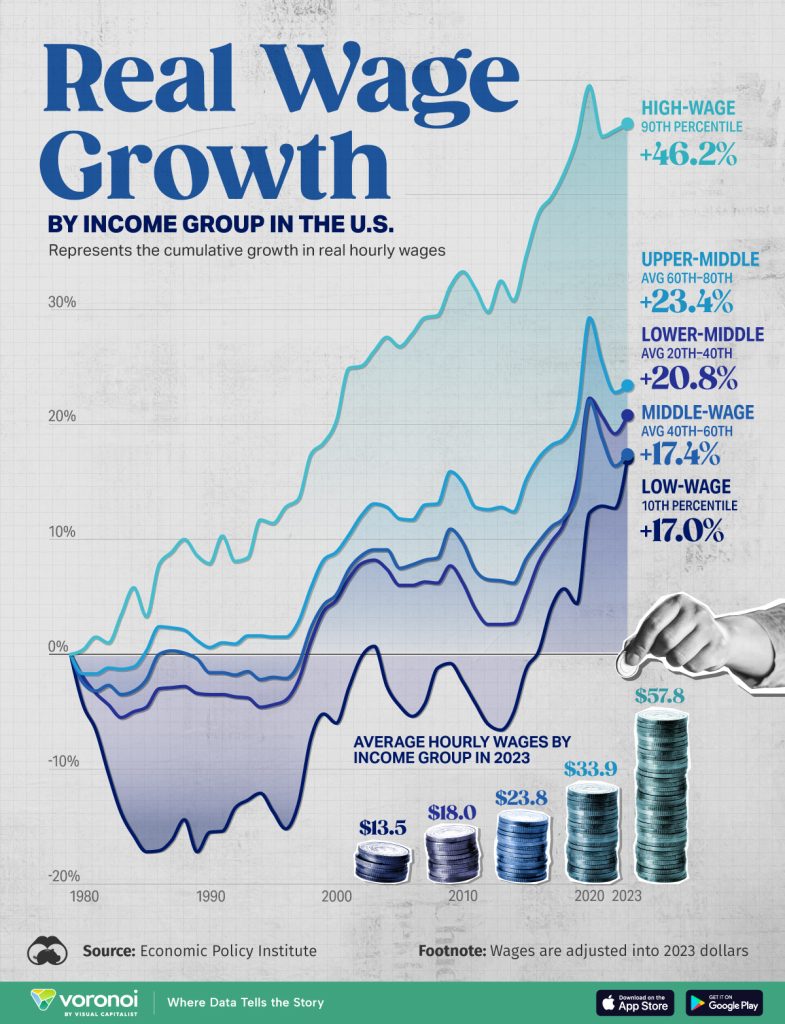
Source: www.visualcapital.com
The chart above may be a couple of years old but the concept is the same as wages of the top 10% have grown 2.5 times faster than the bottom 60%. This has also contributed to growing income and wealth inequality. Today the top 1% have an average of $19.6 million vs. the bottom 50% with an average wealth of $34.3 thousand. There are 23.8 million millionaires in the U.S. but 41.7 million collect food stamps. All this has contributed to social decay particularly in the U.S.
Loss of productive capacity. After World War I, the U.S. led the world in GDP, with a huge share of global manufacturing, rising real wages, a positive trade balance, and high-capacity utilization. Starting in the 1970s with the Arab oil embargo things began to slide. As well, global competition from Germany, Japan, and East Asia began to challenge the U.S. at a number of levels. As a result, over time manufacturing jobs disappeared, outsourced to Asia, Mexico, etc., capacity utilization, once over 90%, fell under 80%, and labour productivity growth slowed considerably.
The U.S. outsourced its manufacturing to other countries, keeping the high-end stuff like marketing and finance – the Platform Economy. That resulted in growing wage gaps and major growth areas going to finance and real estate. The trade deficit rose sharply as the U.S. imported everything. Manufacturing as a share of GDP was 16% in 1997 and by 2007 had fallen to 11%. Manufacturing jobs have fallen 26% since 2000 and the U.S. workforce is lower today by about one million than in 2000, despite a sharp rise in population.
The U.S. is trying to rebuild productive capacity behind a wall of tariffs. Offshoring has gone on for years. It has hollowed out the middle class and mid-class jobs. Manufacturing doesn’t come back overnight and could take years to rebuild. There is a shortage of skilled labour, domestic supply chains are frayed, and there are limitations on permits and energy. Wall Street’s focus is on finance, not factories. Wall Street’s focus on earnings is not conducive to long-term industrial investment.
Sudden implosion. “How does one go bankrupt? Two ways. Gradually, then suddenly.” We are still on the gradual part, but the implosion is getting closer in the form of another financial crisis. The capacity of the U.S. and the world to deal with another one on the scale of the 2008 financial crisis or worse is severely limited and constrained.
Against this backdrop it seems incredible that the U.S. stock market keeps going up to record highs. If the stock market is the measurement for the success of the U.S., then it is being delivered in spades. Who cares about all the other problems? Billionaires get richer. The rest of the economy is in a slow collapse. Corporate earnings, an ongoing love affair with high-tech and AI, and an economy rolling over but not yet in a recession are all contributing to the record move. It seems like a “what, me worry?” market. Obviously not.
Interest rates may be higher today, but in real terms they are not so high that this sparks problems. Years of QE flooded the markets with oodles of liquidity. The money poured into the stock market. Financialization became “the thing.” Buy equities – who needs factories? A rising market fuels corporate buybacks, thus fueling the stock market even further.
The rise in the stock market is primarily driven by a handful of stocks led by the MAG7, which now make up some 35% of the S&P 500 market cap. Troubles elsewhere in the world spark the movement of international flows into the U.S. as a safe haven. Cheap leverage obtainable by cheap money, the offshoring of production (cheap labour), and automation using emerging technologies (AI) are driving markets higher.
There are cracks. Market valuations are extremely high; we have narrow leadership (MAG7) and high PEs (price-to-earnings), with other measurements at or near record highs, signaling potential trouble ahead. Cracks are appearing in the commercial real estate market with empty office buildings and sub-prime auto lenders are teetering. That could spark a financial crisis. Households are stretched, with credit card delinquencies rising along with mortgage defaults.
Banks are upping their reserves for loan losses. Unemployment is rising, even as we are in the dark about where it is due to the shutdown of the U.S. government and the Bureau of Labour Statistics (BLS) that provides the data. That leaves everyone in the dark, especially the Fed.
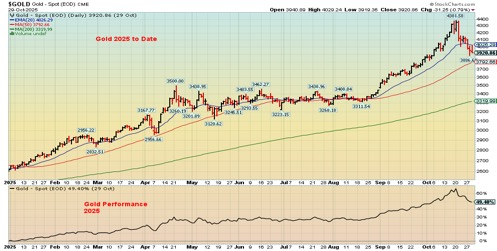
The recent collapse of gold prices (down almost 11% from the highs) with silver and the gold stocks down even more has raised some questions about what is going on. The current decline is the steepest so far for 2025. Gold is the safe haven. Is this just normal profit-taking following a huge run-up, or is something else going on? Some are speculating that the fall in gold prices reflects the potential for a liquidity crisis. As a result, we see selling to raise cash in the event of a possible crisis.
Company bankruptcies have been rising. No, they are not yet at levels seen during the savings and loan crisis of the late 1980s or the global financial crisis of 2007–2009. But is it the canary in the coal mine? Or as JP Morgan Chase CEO Jamie Dimon noted, if there is one cockroach there are probably more.
U.S. Bankruptcies (companies only) 1980–2025, Delinquencies of Loans/Leases to Consumers 1988-2025
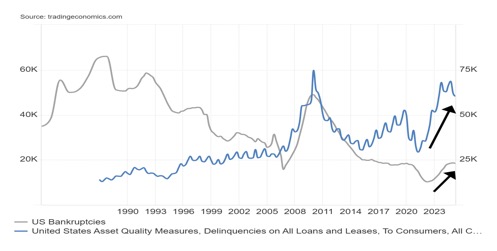
Source: www.tradingeconomics.com, www.uscourts.gov/topics/administrative-office-us-courts, www.federalreserve.gov
The chart above shows that delinquencies on loans/leases to commercial banks has reached levels seen at the time of the global financial crisis 2008. And we are not yet in a recession. Commerical bankruptcies are rising but not yet at levels seen during the global financial crisis 2008 and the savings and loans crisis of the late 1980s.
Source: www.stockcharts.com
Bankruptcies are rising, delinquencies are rising, consumer confidence is falling, leading indicators are falling, inequality is growing (the rich get richer, while everyone else gets poorer), social decay is highly visible, democracy is teetering, and debt keeps on rising – but the stock market doesn’t care. Not yet, anyway.
As the chart on the next page shows the U.S. Leading Economic Index (LEI) has been falling steadily since 2022 while consumer confidence is down around where it was during the 2008 financial crisis and the early 1980s recession.
U.S. Leading Economic Index (LEI), U.S. Consumer Confidence 2015–2025
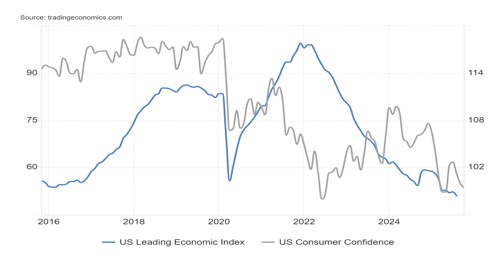
Source: www.tradingeconomics.com, www.umich.edu, www.conference-board.org
Chart of the Week
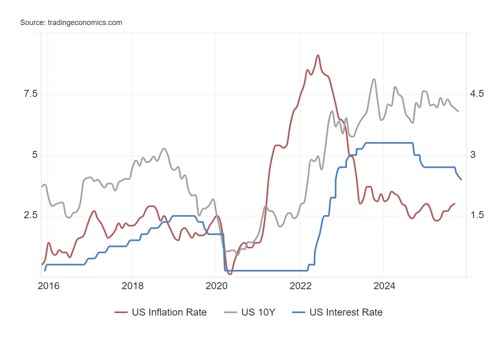
Source: www.tradingeconomics.com, www.federalreserve.gov, www.bls.gov
To nobody’s surprise, the Federal Reserve lowered the key Fed rate by 25bp at the recent FOMC meeting on October 29. The rate now stands at 3.75%–4.00%. The move followed the earlier lowering on September 2025. Canada’s Bank of Canada (BofC) also lowered its key bank rate to 2.25%, also lower by 25bp. In the U.S., the latest inflation rate was 3.00% and the 10-year U.S. Treasury note yield is 4.10% and rising.
What may have surprised everyone is that both the Fed (Jerome Powell) and the BofC (Tiff Macklem) noted that a December rate cut is not a foregone conclusion. Powell cited uncertainty surrounding trade and the lack of data given the government shutdown. Macklem cited trade uncertainties. Notably, the FOMC was not all in agreement and by lowering the rate only 25bp it drew the ire of President Trump who wants sharply lower rates. Once again, it raises the spectre of a Powell firing, even though Trump can’t do it and Powell’s term ends next May anyway.
Powell cited the lack of data as a serious concern. Powell did cite uncertainty in the jobs market, primarily as a result of Trump’s immigration crackdown. Add to that the recent sharp rise in announcements of layoffs.
Because of the government shutdown, at least 670 thousand federal workers will not get paid. The real number could be a lot higher, given there are at least 2 million federal employees. Thousands more are deemed essential and they won’t be paid either, nor will the military. Essential workers include air traffic controllers where airports in the U.S. are already in chaos. There has been a sharp rise of essential workers phoning in sick. Against that, they are being threatened with firing. Chaos and uncertainty reign.
But it goes beyond government workers, including military, not being paid, as it is also negatively impacting food stamps that are about to expire, rising costs for health care, and cuts to Medicaid. Courts have ordered the reinstatement of food stamps on the program known as SNAP. Combine all that with mass layoffs of a number of firms and the odds of an economic disaster rise. Against all that, Trump tears down the White House’s east wing to build a ballroom monument.
As well, we note bank credit is tightening and in response the Fed is easing up on any further quantitative tightening (QT), which could lead to a rise in money supply and increase liquidity.
The stock market wobbled, bond yields ticked higher, gold wavered but rebounded, and the US$ Index rose. There is a disconnect between a darkening economic situation and diving consumer sentiment, but a rising stock market and creation of ballroom monuments.
Markets & Trends
| % Gains (Losses) Trends | ||||||||
| Close Dec 31/24 | Close Oct 31/25 | Week | YTD | Daily (Short Term) | Weekly (Intermediate) | Monthly (Long Term) | ||
| S&P 500 | 5,881.63 | 6,840.20 (new highs) * | 0.7% | 16.3% | up | up | up | |
| Dow Jones Industrials | 42,544.22 | 47,562.07(new highs) * | 0.8% | 11.8% | up | up | up | |
| Dow Jones Transport | 15,894.75 | 15,890.17 | 2.8% | flat | up | neutral | up | |
| NASDAQ | 19,310.79 | 23,794.26 (new highs) * | 2.2% | 22.9% | up | up | up | |
| S&P/TSX Composite | 24,796.40 | 30,260.74 | (0.3)% | 22.4% | up | up | up | |
| S&P/TSX Venture (CDNX) | 597.87 | 957.88 | (0.6)% | 60.2% | up | up | up | |
| S&P 600 (small) | 1,408.17 | 1,435.53 | (2.8)% | 1.9% | up | up | up | |
| MSCI World | 2,304.50 | 2,851.94 | (0.4)% | 23.8% | down | up | up | |
| Bitcoin | 93,467.13 | 109,727.07 | (1.0)% | 17.4% | down | up (weak) | up | |
| Gold Mining Stock Indices | ||||||||
| Gold Bugs Index (HUI) | 275.58 | 580.85 | (1.5)% | 110.8% | down (weak) | up | up | |
| TSX Gold Index (TGD) | 336.87 | 690.17 | (2.0)% | 104.9% | down (weak) | up | up | |
| % | ||||||||
| U.S. 10-Year Treasury Bond yield | 4.58% | 4.08% | 1.5% | (10.9)% | ||||
| Cdn. 10-Year Bond CGB yield | 3.25% | 3.12% | 1.0% | (4.0)% | ||||
| Recession Watch Spreads | ||||||||
| U.S. 2-year 10-year Treasury spread | 0.33% | 0.50% | (5.7)% | 51.5% | ||||
| Cdn 2-year 10-year CGB spread | 0.30% | 0.72% | 1.4% | 140.0% | ||||
| Currencies | ||||||||
| US$ Index | 108.44 | 99.76 | 0.9% | (8.0)% | up | down (weak) | down | |
| Canadian $ | 69.49 | 0.7130 | (0.2)% | 2.6% | down | neutral | neutral | |
| Euro | 103.54 | 115.32 | (0.9)% | 11.4% | down | up (weak) | up | |
| Swiss Franc | 110.16 | 124.19 | (1.3)% | 12.7% | down | up (weak) | up | |
| British Pound | 125.11 | 131.42 | (1.3)% | 5.0% | down | neutral | up | |
| Japanese Yen | 63.57 | 64.90 | (0.8)% | 2.1% | down | down | down | |
| Precious Metals | ||||||||
| Gold | 2,641.00 | 3,998.45 | (2.7)% | 51.4% | up (weak) | up | up | |
| Silver | 29.24 | 48.57 | flat | 66.1% | up (weak) | up | up | |
| Platinum | 910.50 | 1,563.00 | (1.1)% | 71.7% | up (weak) | up | up | |
| Base Metals | ||||||||
| Palladium | 909.80 | 1,450.00 | 0.6% | 59.4% | up | up | up (weak) | |
| Copper | 4.03 | 5.09 | 0.2% | 26.3% | up | up | up | |
| Energy | ||||||||
| WTI Oil | 71.72 | 60.81 | (1.1)% | (15.2)% | down (weak) | down | down | |
| Nat Gas | 3.63 | 4.09 | 21.7% | 12.8% | up | up | neutral | |
Source: www.stockcharts.com
Source: www.stockcharts.com
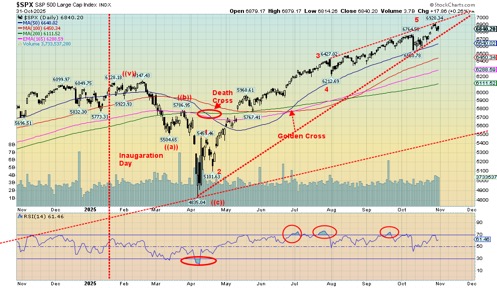
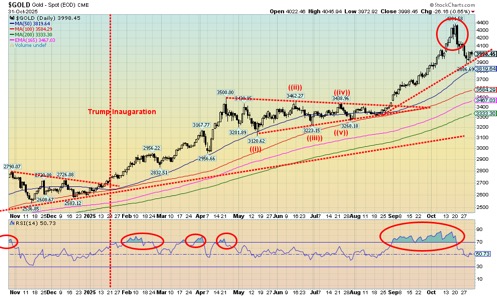
The never-ending bull market of 2025 just keeps on climbing. When will it end? Will it end in tears? Or just a whimper? Will it even end? After all, the IMF is still predicting decent U.S. growth over the next year. We seem to be forming some sort of ascending wedge triangle of late. A break of 6,700 could spell trouble. Under 6,550 the recent low is definitely trouble. Of course, new highs will keep the dream alive. The Fed cut rates as expected and that helped the market. But the Fed was cautious about further rate cuts, causing a small sell-off. New all-time highs were in vogue once again.
On the week, the S&P 500 (SPX) rose 0.7% to new all-time highs. The Dow Jones Industrials (DJI) rose just under 0.8%, also to new all-time highs. The NASDAQ joined, up 2.2% to new all-time highs, largely thanks to the MAG7. Indeed, the MAG7 were mostly stars this past week, continuing the narrow holdings that are leading the markets to new highs. Notably, the S&P 500 Equal Weight Index actually fell about 1.8%, diverging sharply with the SPX.
The NY FANG Index rose 2.5% to new all-time highs. The Dow Jones Transportations (DJT) rose 2.8% but is nowhere near its all-time highs, an ongoing divergence with the DJI. The S&P 400 (Mid) fell 1.6% while the S&P 600 (Small) was down 2.8%. Again, both diverging with the SPX.
The MAG7 led the market up and this past week was no exception. Amazon was up 8.9%, Apple up 2.9%, Google up 8.2%, Nvidia up 8.7%, and Tesla up 5.3% so that Elon Musk got richer again. Google, Apple, Amazon, and Nvidia all made all-time highs. Were there hiccups? Yes – Microsoft fell 1.1% while Meta took a hit, down 12.2%.
To maintain its place in the MAG7, Meta can’t disappoint on earnings. MAGS, the MAG7 ETF, also made all-time highs, up 3.2%.
Elsewhere, Bitcoin wobbled and fell about 1.0%. In Canada, the TSX Composite was down 0.3% and the TSX Venture Exchange (CDNX) was down 0.6%. In the EU, the London FTSE made all-time highs, up 0.8%, but the EuroNext fell about 0.4% after making all-time highs. The Paris CAC 40 lost 1.3% and the German Dax was down 1.2%. In Asia, China’s Shanghai Index (SSEC) made 52-week highs, up 0.1%, the Tokyo Nikkei Dow (TKN) soared to new all-time highs, up 6.3%, while Hong Kong’s Hang Seng (HSI) wobbled and fell about 1.0%.
Will this market end with a bang or a whimper? The more we go up, it suggests we’ll end with a bang, and suddenly. Most indicators suggest the current bubble is bigger than the Roaring Twenties bubble of the 1920s and the dot.com bubble of the 1990s. Market capitalization to GDP (the Buffett indicator) is in the stratosphere, price-earnings is higher today than in the 1920s and 1990s, and the market concentration in the MAG7 makes the Nifty Fifty of the 1970s look like nothing.
If there are caveats, we note that today’s companies appear better capitalized and make better profits than their counterparts in the 1920s and 1990s. Real interest rates are lower. Lots of earnings are outside the U.S. We continue to recommend caution about this market. The drop could come suddenly. Under 6,700 is the first sign of trouble.
Source: www.stockcharts.com
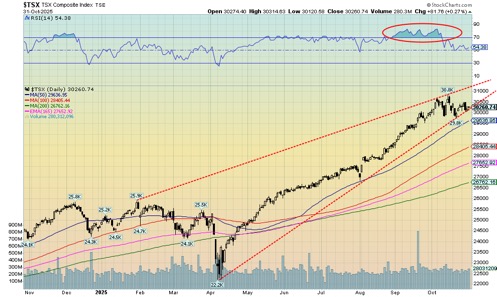
Are the days of weekly new highs for the TSX Composite over? After peaking just over 30,800 on October 15 we have been moving largely sideways ever since. Not helping is the correction in the commodities: golds, metals, and materials are all taking a breather. They led the market up and can lead it down too. Nonetheless, the TSX hasn’t broken down just yet. We have to break under 29,500 to suggest a steeper correction. This past week the TSX fell 0.3%. The TSX Venture Exchange is also wobbling, off 0.6% this past week and down about 8% from its recent high. Only four of the 14 sub indices were up this past week.
The best performer was Information Technology (TTK), up 2.2% to new all-time highs. Others made new all-time highs. Income Trusts (TCM) was one but it closed down 1.6%. Financials (TFS) did make a new all-time high and closed up a small 0.2%. The big loser on the week was Real Estate (TRE), down 3.5%. Is real estate suggesting a bigger problem? Surprisingly, Consumer Staples (TCS) fell 2.9%, Industrials (TIN) was down 2.2%, and Consumer Discretionary (TCD) fell 1.6%.
Telecommunications (TTS) fell 1.8% while Utilities (TUT) was off 1.2%. Not a particularly good week, but with Financials up small and Information Technology well up, the loss for the TSX was small. Another break of 30,000 would suggest lower prices. Under 29,000 we could test down to 28,000. This correction was overdue. The question is, is this just a correction or the start of a bigger drop? We won’t know that until we break under 27,000.
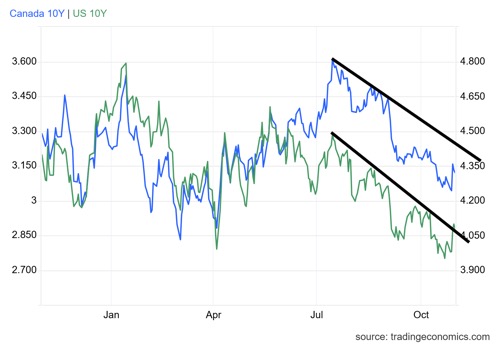
U.S. 10-year Treasury Note, Canada 10-year Bond CGB
Source: www.tradingeconomics.com, www.home.treasury.gov, www.bankofcanada.ca
The bond market doesn’t like the Fed taking a more hawkish stance on interest rates. After cutting rates 25 bp, as was widely expected at this past week’s FOMC, the market was stymied by Powell who indicated a December rate cut was not a foregone conclusion. Sticky inflation and a lack of data keep the Fed hamstrung. All this despite President Trump’s threats to fire Powell because he isn’t lowering rates sharply as he wants.
The Fed is already pulling back on its quantitative tightening and we wouldn’t be surprised by some increase in money supply that has been falling of late but recently began to rise slowly again. The Fed is ending its balance sheet run-off into December, ending its run-off of U.S. treasuries, and is reinvesting maturing mortgage-backed securities (MBS) into U.S. treasuries to ease some growing pressure in the repo market. We saw strains in the repo market before the onset of the pandemic in late 2019.
This past week saw the U.S. 10-year Treasury note hit as high as 4.10% before easing back to 4.08%. In Canada, the Government of Canada 10-year bond (CGB) rose to 3.12% from 3.09%. The CGB appears to be breaking that downtrend line from July while the U.S. 10-year is still shy of the downtrend line.
We need at least another week to determine whether this is just a little correction in the downtrend or the start of a new uptrend. After all, when you have $38 trillion in debt and a $2 trillion annual budget deficit, you can’t afford to let rates fall or investors will stop buying. The U.S. no longer has an AAA credit rating and even then, its AA+ rating is under strain. Simply put, the U.S. is not necessarily the world’s safe haven for money any longer.
Source: www.stockcharts.com
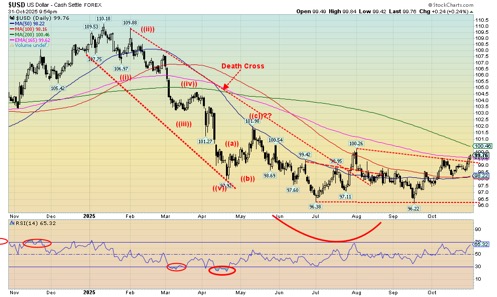
The US$ Index appears to have broken out to the upside from the consolidation pattern that had been forming since July. On the week, the US$ Index rose 0.9%. The currencies fell. The euro fell 0.9%, the Swiss franc was down 1.3%, the pound sterling was off 1.3%, while the Japanese yen was down 0.8%. Canada did better, with the Cdn$ off only 0.2%.
Helping the US$ is a more hawkish tone from the Fed, despite the recent Fed rate cut. They expressed uncertainty about the next FOMC because of still-sticky inflation and a distinct lack of data due to the government shutdown. That sparked a drop in the odds of December rate cut.
Resistance for the US$ Index is up at 100.50, which appears to be a minimum target. Based on the bottoming pattern, a move to 103 can’t be ruled out. A rising US$ Index is negative for gold, which fell again this past week.
Source: www.stockcharts.com
Gold fell again this past week, mostly because of a strengthening US$ Index and some unloading of leveraged positions in gold. The leveraged players want to play when the market goes up but, being leveraged, they are subject to margin calls if the market falls. Still, gold’s performance in October saw it close higher for the third consecutive month. It’s gained almost 21% during that time or $689. Now it has fallen for two consecutive weeks, an overdue correction. And it remains up 51.4% on the year. Silver is even better, up 66.1% on the year.
On the week, gold fell 2.7% while silver outperformed, ending the week flat. Platinum fell 1.1% but is still up 71.7% on the year. Of the near precious metals, palladium was up 0.6% while copper was up a tiny 0.2%. Palladium is up 59.4% on the year while copper is up 26.3%. The gold stock indices fell as the Gold Bugs Index (HUI) lost 1.5% and the TSX Gold Index (TGD) fell almost 2.0%. Both remain up over 100% on the year.
Technically, we appear to have found some support near $3,900 while the 50-day MA is just below at $3,820. A break under $3,800 could suggest further declines to $3,600. The decline over the past two weeks is being described as a liquidity event, not a fundamental event. The rise had been steep and many participants were highly leveraged. A drop like this sends the leveraged players to the sidelines, possibly with margin calls. We’ve mused as to whether this decline is a liquidity event in that the gold market smells a rat and is getting liquid, even as the prediction remains firm that we could eventually see higher prices ahead.
Higher prices remain as central bank gold-buying is not about to stop. They are purchasing upwards of 1,000 tonnes annually. The BRICS nations are still trying to get out from under U.S. dollar hegemony but building their gold reserves and lessening their holdings of U.S. treasuries. The U.S. has $38 trillion of debt, which is rising at least $2 trillion per year. It’s unsustainable. Gold is a hedge against monetary destruction.
We need to regain above $4,275 to suggest new highs. Only new highs will end this correction. We had expected some weakness into November/December and we appear to be on schedule. After that, another sharp rise could occur into 2026 before a possible top in March/April. The reasons for holding gold have not gone away. Political and economic uncertainty and unsustainable debt are the two prime reasons.
The Russia/Ukraine war and the war in the Middle East (Israel/Hamas) are not getting resolved, despite the so-called cease fire in the Middle East. Domestic political clashes are erupting in the U.S. and more marches are planned against the presidency of Donald Trump. And, need we repeat it, the U.S. debt is unsustainable.
Despite a little bounce back, we suspect this correction is not over yet. A decline to $3,600/$3,700 would not be a surprise.
Source: www.stockcharts.com
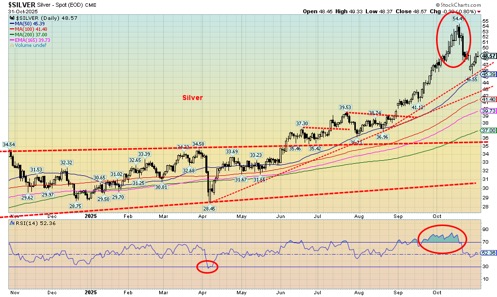
The one positive thing about this past week was that silver outperformed gold. Silver was flat while gold fell 2.7%. That suggests to us that the recent decline for gold, silver, and the gold stocks is probably only a correction and not the start of new major decline. Silver found support near the 50-day MA before rebounding slightly. We still have a way to go to suggest new highs. We have to break above $52.40 to suggest that. A drop under $45 suggests we will see the next support near $43.
We’d prefer not to see a break of $43 as that would suggest a steeper decline. The 200-day MA is down at $37, a level we do not expect to see. Like gold, silver was experiencing some profit-taking and responding to the stronger US$ Index. Nonetheless, we are encouraged with silver’s outperformance this past week. The gold/silver ratio is still extremely high at 82.15. We’re even above the recent low at 76.77. As we’ve noted many times, we have never seen such a period where gold relative to silver has remained so high. A decline is underway but we need to get under 70 to really suggest a decline in favour of silver.
Source: www.stockcharts.com
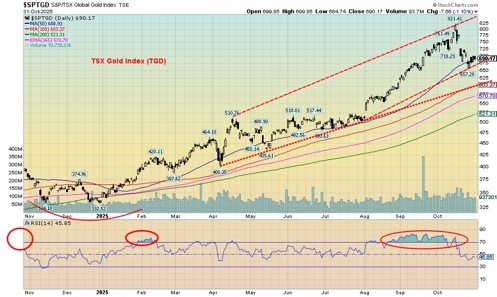
It should come as no surprise that, when you are up 100%+, profit-taking might kick in. It has happened with gold, silver, and especially the gold stocks – after a big 68% move from lows in June to the recent high, some might think of profit-taking. The gold stocks are up over 100% in 2025 and many individual stocks even more. So, the recent 20% correction for the TSX Gold Index (TGD) should not be a surprise. Even at that, the TGD remains up 104.9% in 2025 while the Gold Bugs Index (HUI) is still up 110.8%.
On the week, the TGD fell 2.0% while the HUI was off 1.5%. That’s certainly less than the previous week when both fell some 7%+. So far, the 50-day MA appears to be holding the decline. But a drop through 650 could suggest a further decline 600. We can’t help but notice that volume has died down, indicating that this move is most likely just a correction and not the start of a deeper bear move. But be warned that this correction doesn’t appear to be over. There is resistance up to 725, then 750. We have to get over 780 to suggest new highs ahead. Could a correction to the 200-day MA (520) take place? Yes, but we can’t determine if we’ll fall that low until we break under 600.
Source: www.stockcharts.com
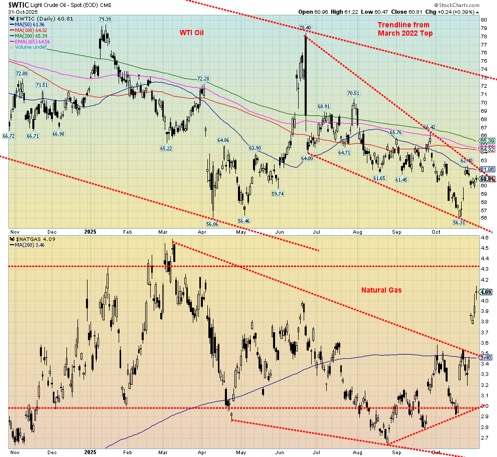
The gap higher a week ago has so far failed to get any follow-through. Instead, WTI oil prices settled back down as they fell 1.1% this past week, mostly filling in the gap. A sustained drop through $60 will now suggest that we could see new lows below $56. On the other hand, a move up through $62 could have the opposite effect. We are still forming what appears to be a descending wedge triangle (bullish). To be safe, we’d prefer to see a move above $63. Potential upside targets could then become $66.
It seems the market was disappointed that the Trump/Xi meetings in South Korea yielded nothing about China purchasing more oil from the U.S. and lessening its dependence on Russia. This week OPEC is meeting, where some expect that the meeting could see a modest increase in output. That would have a dampening effect on oil prices.
Brent crude fell 2.0% and both WTI and Brent remain down on the year: 15.2% and 13.7% respectively. Not so natural gas (NG), which leaped an unexpected 21.7%, gapping higher as WTI oil did previously. It seems expectations of a colder winter and increased demand, particularly from the EU to substitute Russian LNG, played a role. It didn’t spread to NG at the Dutch Hub as it actually fell 1.9%.
Both WTI oil and NG have more work to do to prove that they could go higher. That descending wedge for WTI appears enticing, suggesting an upside breakout. We await the result. Seasonally, as we have noted, both oil and NG’s strongest period is December to June.
Copyright David Chapman 2025
__
(Featured image by Aditya Vyas via Unsplash)
DISCLAIMER: This article was written by a third party contributor and does not reflect the opinion of Born2Invest, its management, staff or its associates. Please review our disclaimer for more information.
This article may include forward-looking statements. These forward-looking statements generally are identified by the words “believe,” “project,” “estimate,” “become,” “plan,” “will,” and similar expressions, including with regards to potential earnings in the Empire Flippers affiliate program. These forward-looking statements involve known and unknown risks as well as uncertainties, including those discussed in the following cautionary statements and elsewhere in this article and on this site. Although the Company may believe that its expectations are based on reasonable assumptions, the actual results that the Company may achieve may differ materially from any forward-looking statements, which reflect the opinions of the management of the Company only as of the date hereof. Additionally, please make sure to read these important disclosures.
David Chapman is not a registered advisory service and is not an exempt market dealer (EMD) nor a licensed financial advisor. He does not and cannot give individualised market advice. David Chapman has worked in the financial industry for over 40 years including large financial corporations, banks, and investment dealers. The information in this newsletter is intended only for informational and educational purposes. It should not be construed as an offer, a solicitation of an offer or sale of any security. Every effort is made to provide accurate and complete information.
However, we cannot guarantee that there will be no errors. We make no claims, promises or guarantees about the accuracy, completeness, or adequacy of the contents of this commentary and expressly disclaim liability for errors and omissions in the contents of this commentary. David Chapman will always use his best efforts to ensure the accuracy and timeliness of all information. The reader assumes all risk when trading in securities and David Chapman advises consulting a licensed professional financial advisor or portfolio manager such as Enriched Investing Incorporated before proceeding with any trade or idea presented in this newsletter.
David Chapman may own shares in companies mentioned in this newsletter. Before making an investment, prospective investors should review each security’s offering documents which summarize the objectives, fees, expenses and associated risks. David Chapman shares his ideas and opinions for informational and educational purposes only and expects the reader to perform due diligence before considering a position in any security. That includes consulting with your own licensed professional financial advisor such as Enriched Investing Incorporated. Performance is not guaranteed, values change frequently, and past performance may not be repeated.


Crypto Markets Volatile as Bitcoin Hovers, Solana Eyes AI Integration
Crypto markets remain volatile amid the Iran war, with Bitcoin near $70,000 and ETF inflows improving outlook. Ethereum faces declines...


Crowdfunding Evolves into Core Financial Infrastructure in Europe
European crowdfunding has matured under ECSPR, growing to 254 platforms by 2026 despite operational challenges. Key shifts include debates on...


DZ Bank Pioneers Blockchain Bond Issuance, Advancing Tokenized Finance
DZ Bank issued a bond via a public blockchain, marking a major step in tokenized bank bonds. The move could...


Ridemovi Secures Financing to Drive European Expansion and Sustainable Mobility Growth
Ridemovi, a Milan-based micromobility company operating bike, e-bike, and scooter sharing in Italy and Spain, secured bank financing led by...


Bank Al-Maghrib Launches Reforms to Boost Credit via Non-Performing Loan Market
Bank Al-Maghrib is advancing a secondary market for non-performing loans to free bank financing and boost credit. With Moroccan NPLs...
 |
|
 |  |
 |
|
-

 Biotech4 days ago
Italy’s Pharmaceutical Sector Drives Innovation, Sustainability, and European Leadership
-

 Markets2 weeks ago
Oil Surge Sparks Market Turmoil and Shadow Banking Fears
-
 Crowdfunding22 hours ago
Crowdfunding Evolves into Core Financial Infrastructure in Europe
-

 Fintech1 week ago
PayPay Targets Global Expansion After Landmark IPO