Markets
A New Gilded Age? Markets Soar as Biden Warns of Oligarchic Rule and Economic Turmoil
Stock markets surged ahead of Trump II’s presidency, as Biden warned of oligarchic rule led by Elon Musk. Echoing the Gilded Age’s inequality and financial turmoil, today’s era parallels technological advances, stock bubbles, and economic uncertainty. Gold and commodities historically thrive in such times. Rising debt and a strong dollar risk further instability amid looming crises.

We are noting President Biden’s warning, not for the politics, but for thoughts on oligarchies and their impact on the economy and markets. The warning harkens back to the words of former president Dwight Eisenhower who warned about the military-industrial complex and risk of the rise of misplaced power.
Oligarchies have been around since ancient times, with possibly the most famous being the Spartans of ancient Greece, who, after they conquered Athens in 404 BCE, ruled as an oligarchy. Oligarchies are characterized as a small group of people having control over a country, corporation, or institution for their own purposes. It is government by a few. It is known for corruption, selfishness, and general oppression of the population. While the term has been around for centuries, it came into heightened use in the 16th century.
Noteworthy oligarchies today include Russia, Ukraine, Iran, and the Philippines. Others that could be considered oligarchies are China, Japan, Colombia, Singapore, and Indonesia. The U.S.’s most famous period of oligarchies was the Gilded Age, the age of the robber barons, lasting roughly from the 1870s until the 1890s. It was a period following the U.S. Civil War and reconstruction leading to expansion of the U.S. into the West, a huge rise in immigration from Europe, economic transformation in industry and manufacturing, and the rise of corporate America. U.S. population doubled during that time from roughly 38 million to 76 million. Cities grew and the period saw the rise of unions and women’s rights.
The Gilded Age was a period of advancement in numerous technologies including the gramophone, telephone, typewriter, camera (Kodak), x-ray machine, and more. It was also the era of the railroads. As well, the period was characterized by the Indian Wars and U.S. expansion, culminating in the Spanish-American war 1898 that ended with the U.S. seizing territory from Spain, including the Philippines. The period was also noted for the rise of the banking institutions and railroads.
From the 1870s to the 1890s, the U.S. experienced two major recessions/depressions. The period of 1873–1879 was known as the Long Depression. The period got underway with the panic of 1873; a financial crisis was the trigger that included bank runs. Underlying factors were inflation, speculation (railroads), demonetization of silver, and, interestingly, fires in Chicago (1871) and Boston (1873). The panic and depression also spread to Europe.
The height of the Gilded Age was the 1880s that saw the official start of the Dow Jones, which was mostly railroads back then. There was a speculative boom in railroads and at their peak railroads made up some 60% of the U.S stock market valuation (sound familiar? MAG7). Still, there was an economic depression between 1882–1885, plus recessions in 1887–1888 and 1890–1891. The panic of 1896 brought on more recessions with the official recession being 1899–1900. These recessions mostly impacted the vast majority of the population as the oligarchs were relatively unhurt. It was a period where children worked in mines and most people lived in poverty.
The stock market peaked in 1869 and fell into a low in 1877, losing about 50%. The Gilded Age brought a bull market that lasted until a peak in 1881, up 240% from 1877. The markets then went into a long decline that didn’t bottom until 1896, down about 53% from the 1881 high. Altogether, the stock market gained roughly 58% from the 1869 high to a high in 1899. It was interrupted by financial panics, recessions, and depressions.
The Gilded Age was dominated by the oligarchs. The most significant ones were John D. Rockefeller (oil), Andrew Carnegie (industrial-steel), Cornelius Vanderbilt (railroads, shipping), and J.P. Morgan (banks). They were known for their ruthless business tactics, suppression of wages for workers, monopolies, suppression of competition, and formation of the trusts.
Today, we have Elon Musk (X, Space-X, Tesla), Jeff Bezos (Amazon), and Mark Zuckerberg (Meta) as the most prominent figures behind Trump. Trump’s cabinet holds 13 billionaires, the wealthiest cabinet in U.S. history. Combined, the big three are worth an astounding $858 billion (as at January 16, 2025). All of them are bigger than many countries. Musk is assuming a major position in the Trump administration, while the others have contributed to Trump’s campaign and inauguration while developing close ties.
There are, of course, other billionaires, but these are the top three. Some note that the oligarchy spreads into huge pools of money managed by Blackrock, Vanguard, and State Street. Together, they hold over $20 trillion or 20% of the world’s investible assets. A study by UBS found that 1% of the population holds more than the collective wealth of bottom 95%. Inequality, which was also a highlight of the Gilded Age, reigns.
Others have also noted the potential for a period of the oligarchs. The rise of the oligarchs got underway in the 1980s and expanded in the 1990s and 2000s. But the real period of explosion in their net worth occurred after the 2020 pandemic. This period was characterized by low interest rates, a huge rise in money supply, and the rise of artificial intelligence AI. AI can be good and bad.
The good aspects of AI include its ability to automate repetitive tasks, increase efficiency, improve accuracy in decision-making, provide personalized experiences, and solve complex problems in various fields like healthcare and science. The bad aspects include potential job displacement, ethical concerns related to bias in algorithms, privacy violations due to data collection, lack of transparency in decision-making, and the potential for misuse and for malicious purposes. The period of AI has seen a rise in disinformation, in both visual and written form. It has an ability to control.
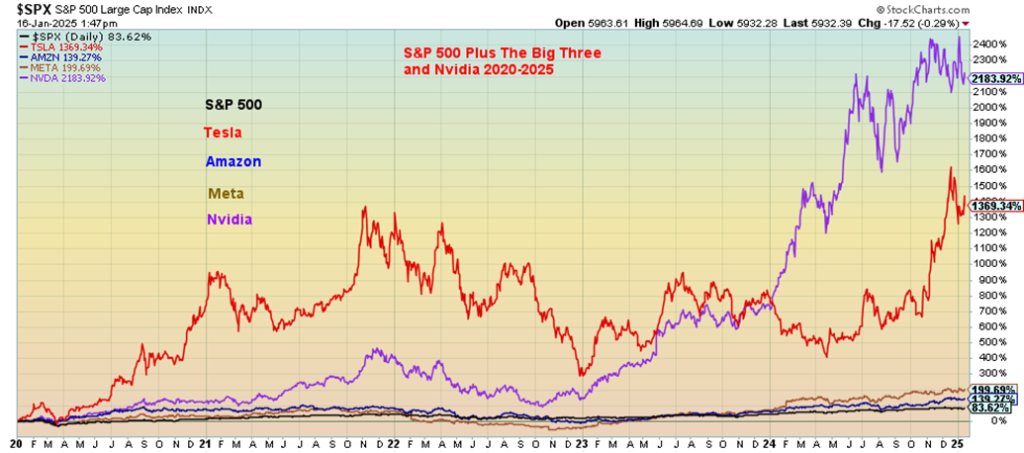
The Trump era begins on January 20, 2025. Already it is promising to be an era of chaos and volatility. It will also be the era of the oligarchs and whatever that means for the U.S. economy and the markets. We’re facing promises of tariffs, mass deportations, huge income tax cuts, and the potential for catastrophic cuts to government, including the elimination of entire departments as proposed under the Department of Government Efficiency (DOGE) headed by Elon Musk and proposals from Project 2025.
It could be the era of cryptocurrencies. All this and more could upend the stock and bond markets. However, it could be a positive period for commodities, including gold, silver, oil, lumber (rebuilding L.A?), copper, and more. Foreign policy proposes taking over Greenland and Panama, plus economic force to be used against Canada. U.S. expansion redux. It might also bring the U.S. into further conflict with other countries, including the EU, China, and Russia.
One area to watch is the bond market. It is the bond market that will weigh in the success or failure of Trump’s promises. Tariffs, mass deportations, and income tax cuts all are potentially inflationary, sending the already astronomical U.S. debt higher. Note that, during Trump’s first round during 2017–2021, the U.S. added $8 trillion to the Federal debt. Under the Biden administration, another $8 trillion was added, caused initially by spending for the COVID pandemic. A conservative figure is that another $8 trillion in debt could be added over
the next four years. Some forecasts see it as high as $12 trillion. The Federal debt to GDP ratio could go from 123% to 147% by 2029. Consumer and corporate debt are also astronomical. Total debt (governments, corporations, households) to GDP today stands at 342% but by 2029 it could be 413% (www.usdebtclock.org). Many have noted that the U.S. (and others as well) are on an unsustainable pace.
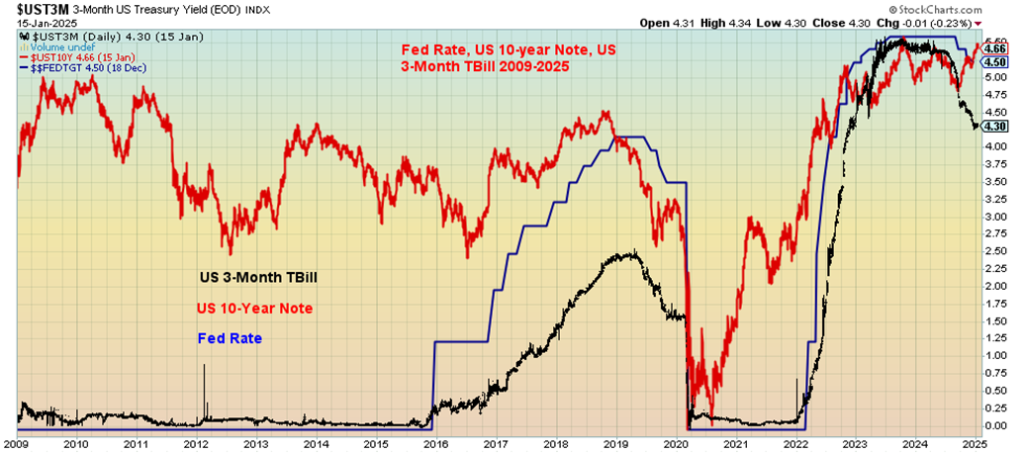
Adding to the bond market woes is that $6.7 trillion of bonds come due in 2025. That has already been noted by incoming Treasury Secretary Scott Bessent. They will be faced with a choice. Do they refinance with short-term treasury bills or longer-dated notes and bonds? Normally, it is funded only 15%–20% with T-bills. But T-bills are also cheaper, given that the yield curve has returned to normal. Currently, three-month T-bills yield 4.31% vs. 4.63% for the 10-year treasury note. The U.S. is now paying out more than $1 trillion for interest on the debt. That is one government expenditure that cannot be cut.
We note that inflation is sticky. The latest CPI came in at 2.9% as was expected, but that was up from 2.7% reported for November. It was the third consecutive monthly rise. In September it was 2.4%. The core rate was marginally better at 3.2% vs. the expected 3.3%. Still, the pressure seems to be up, not down as is preferred. Could this in turn cause the Fed to pause rate cuts? If inflation rises again, will the Fed have to hike rates instead?
Trump wants rates lower, a lot lower. While Jerome Powell was appointed by Trump, Trump has already indicated he wants lower rates. Trump has fought with Powell in the past and threatens to again challenge the independence of the Fed. Powell has stated he will not resign. His mandate expires in May 2026. An open fight between Powell and Trump could shake global capital markets.
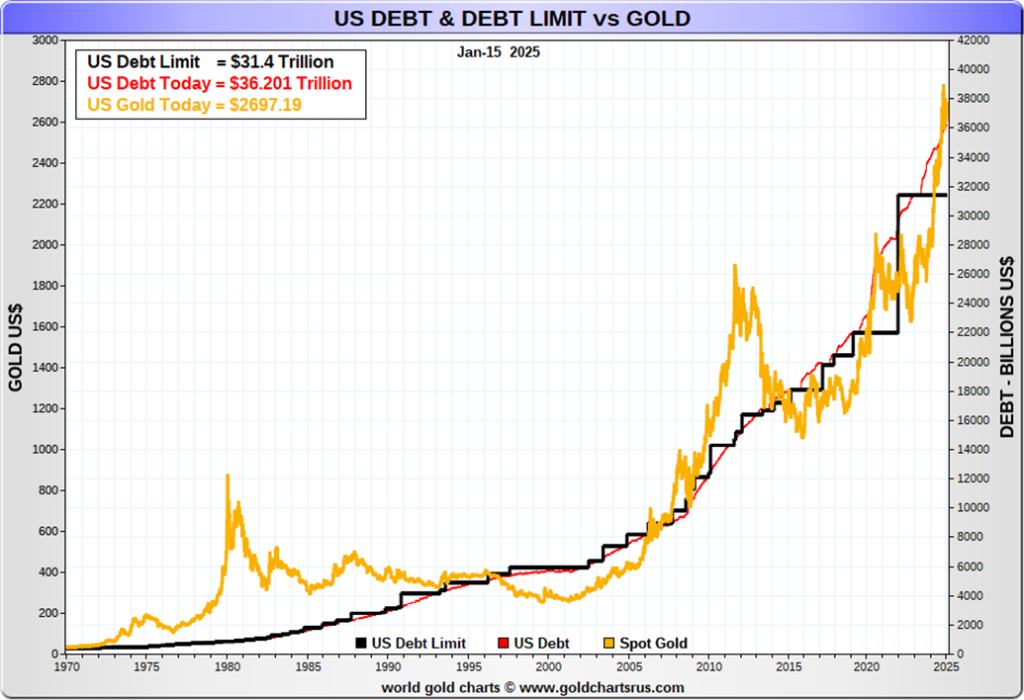
What about the debt ceiling? That has been contentious in the past, resulting in government shutdowns. The current debt ceiling remains at $31.4 trillion. Deals have been cut (using extraordinary measures) to avoid a showdown over the debt ceiling and allow the bills to be paid. But it will rear its head once again in the first quarter of 2025. Outgoing Treasury Secretary Janet Yellen has warned that a debt ceiling crisis could soon be upon us.
The last government shutdown was 2018–2019 under Trump. But that was more over appropriations for Trump’s Mexican wall. The last debt ceiling shutdown occurred in 2013. Since 2021, the debt ceiling has remained the same but deals have always been cut to allow bills to be continued to be paid.
Today the U.S. federal debt sits at $36.2 trillion. Of that, $7.3 trillion is held by intragovernmental departments such as Social Security. The remaining $28.8 trillion is held by the public, of which $8.6 trillion is held by foreigners, primarily central banks. The U.S. is highly dependent on foreigners taking up their debt. While the amount held is up $1.1 trillion over the past year, big buyers such as China have been slowly stepping away.
One of our favourite visuals is that of the U.S. debt and debt limit vs. gold. Gold prices appear to rise in lockstep with the debt and the debt limit. The debt represents fiat money while gold represents real money. Continued expansion of the debt has been beneficial to the oligarchs as spending inevitably trickles into their pockets.
We have consistently stated that 2025 could be a year of chaos and volatility. Unsurprisingly, the chaos got underway almost immediately in the first week. Now comes the inauguration on January 20, 2025 and everyone will be waiting to see what Trump might do. Will he do what he says, or is it all bluster and idle threats. We’ll soon find out. The stock market has been rising into the event. Buy the rumour, sell the news? However, watch the bond market. And gold will rise.
Chart of the Week
Dow Jones Industrials (DJI) 1920–1934
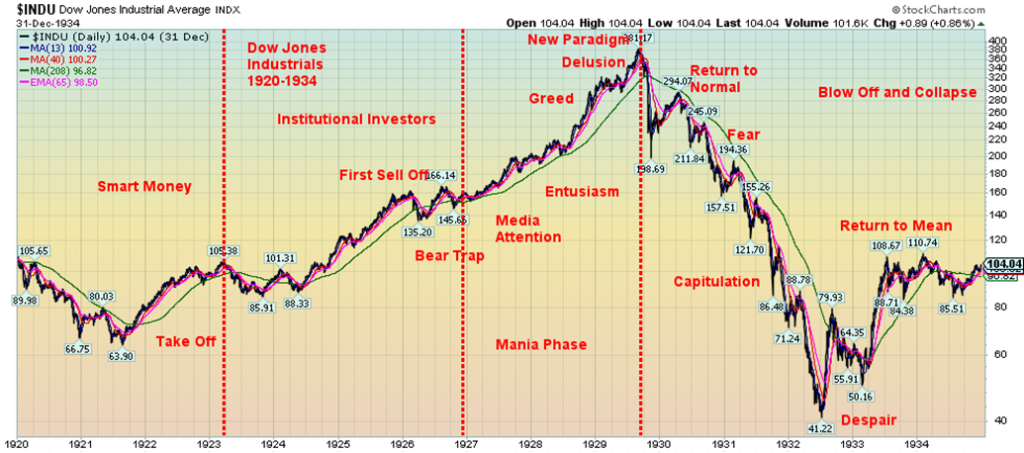
Market crashes and bear markets occur regularly. The only difference between a crash and bear market is the speed with which they happen. Crashes are quick and brief but their effects can last longer. Bear markets are slow and prolonged. Crashes have occurred since ancient times. However, in more modern times, the Tulip mania crash of 1637 is often cited as the classic example of a mania and crash.
Since then, it is difficult to list all of them, although you can find a great summary in Wikipedia (https://en.wikipedia.org/wiki/List_of_stock_market_crashes_and_bear_markets). We’ll cite our favourites, beginning, of course, with Tulip mania. Others that stand out:
- the panic of 1837 that brought a great depression known as the hungry 40s
- the panic of 1873 that brought on the Long Depression
- the panic of 1896 that triggered another depression
- the panic of 1907 as Roosevelt tried to rein in the monopolies
- the crash of 1929 that ushered in the Great Depression
- the panic of 1937 and the secondary recession as part of the Great Depression
- the stock market crash of 1973–1974, the Nifty Fifty, oil embargo, Watergate crash, and recession
- the crash of October 1987, with the brief but deadly record drop in the stock market
- the 1991 Japanese stock market crash leading to Japan’s long recession
- the 1998 Russian rubble Long Term Capital Management (LTCM) crash
- the dot.com/high-tech crash in 2000
- the September 11, 2001 crash
- the continuation of the dot.com/high-tech crash in 2002
- the Chinese stock market bubble burst and crash in 2007
- the financial crisis, sub-prime loan/Lehman Brothers crash, and the Great Recession in 2007–2009
- the EU/Greek debt crisis in 2010–2011
- the 2015 Chinese stock market crash
- the 2018 cryptocurrency crash
- the 2020 COVID panic
- the 2022 stock market decline, followed by Russian stock market crash due to the invasion of Ukraine
Stock market crashes and declines happen with regularity, and so do bubbles. Over the past decade, we have witnessed a housing bubble, stock market bubble, and a cryptocurrency bubble. The latter may be led by Bitcoin, but we’ve already noted the rise of meme cryptos with the addition of Fartcoin. Not to be outdone, it seems there is also Butthole Coin. In the first week of 2025, Butthole Coin soared 752%. It currently has a market cap of $45 million and trades around 4.5 cents. There are junior mining companies with market caps of less than $45 million and some of them actually hold something of value.
Adding to the bubble aspect of crypto was the start of trading for a Trump meme crypto. On its first day, it soared from $7 to $30, a gain of 366% in one day. It raised its market cap to $6 billion in no time, an unreal figure for effectively a worthless meme. That made the meme worth almost as much as Endeavour Mining (EDV) and larger than many gold and metal mining companies. All this is symptomatic of a bubble.
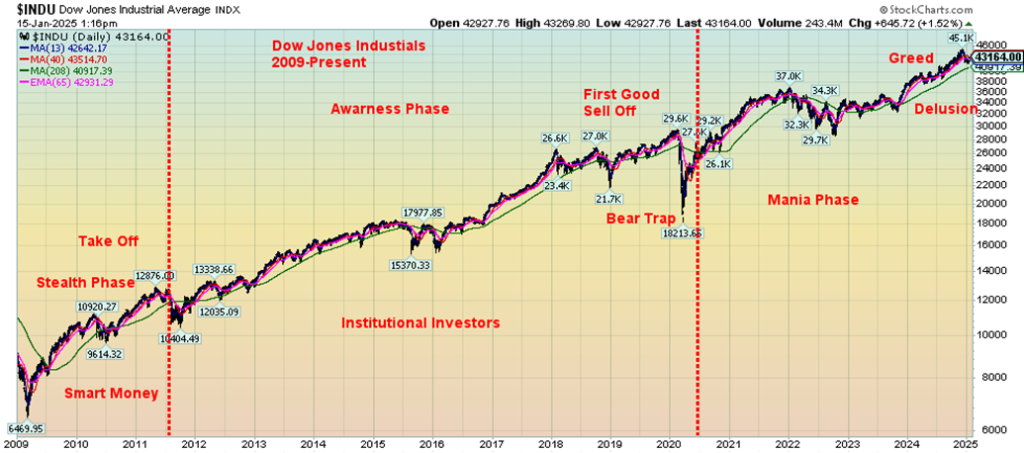
Markets tend to go through phases, as shown theoretically in this chart. We then applied these phases to the 1920–1929 market that culminated in the stock market mania of the Roaring Twenties and subsequent Crash of ’29 followed by the Great Depression. The chart is a classic.

So how does the current cycle compare with this theoretical version? Admittedly, it is not as clean to the theory as the 1920–1934 version appears to be. Nor do we have any confirmation that the blow-off phase has completed. We place the take-off stealth phase as lasting from 2009–2011, ending with the EU/Greek crisis and a market sell-off. The awareness phase lasted, it appears, from 2011 to 2020, despite market sell-offs in 2015–2016 and again in 2018. Nonetheless, this was a period where institutional investors were piling into the market, particularly after the Trump tax cuts. The period ended rather nastily with the COVID pandemic panic. As it turned out, that was merely a bear trap.
Thanks to oodles of money and interest rates near zero, the mania phase got underway. Stocks, housing, and everything else rose. The fact that the Fed began tightening in 2022, helping to spark the sell-off in 2022, did not in the end stop the speculation. This was the period of MAG7, the AI stocks, and cryptocurrency. We have certainly entered into the greed and delusional phase. But we don’t know whether we have made the final top and the “new paradigm.” Some areas such the housing market and commercial real estate have already seen their bubble burst. Maybe Butthole Coin is the signal that the top is in. It can’t get much crazier. Chaos and volatility remain the themes for 2025.
Dow Jones Industrials 2009–2025
Markets & Trends
| % Gains (Losses) Trends | ||||||||
| Close Dec 31/24 | Close Jan 10/25 | Week | YTD | Daily (Short Term) | Weekly (Intermediate) | Monthly (Long Term) | ||
| Stock Market Indices | ||||||||
| S&P 500 | 5,881.63 | 5,996.66 | 2.9% | 2.0% | neutral | up | up | |
| Dow Jones Industrials | 42,544.22 | 43,487.83 | 3.7% | 2.2% | neutral | up | up | |
| Dow Jones Transport | 16,030.66 | 16,431.26 | 3.2% | 3.4% | neutral | up | up | |
| NASDAQ | 19,310.79 | 19,630.20 | 2.5% | 1.7% | up (weak) | up | up | |
| S&P/TSX Composite | 24,796.40 | 25,067.92 | 1.2% | 1.4% | neutral | up | up | |
| S&P/TSX Venture (CDNX) | 597.87 | 616.34 | 1.3% | 3.1% | up | up | neutral | |
| S&P 600 (small) | 1,408.17 | 1,441.99 | 4.4% | 2.4% | down (weak) | up | up | |
| MSCI World | 2,304.50 | 2,322.54 | 0.3% | 0.8% | down (weak) | down | up | |
| Bitcoin | 93,467.13 | 105,072.62 | 10.9% | 12.4% | up | up | up | |
| Gold Mining Stock Indices | ||||||||
| Gold Bugs Index (HUI) | 275.58 | 296.67 | 1.1% | 7.7% | neutral | neutral | up | |
| TSX Gold Index (TGD) | 336.87 | 366.29 | 1.9% | 8.7% | up | up (weak) | up | |
| % | ||||||||
| U.S. 10-Year Treasury Bond yield | 4.58% | 4.63% | (2.9)% | 1.1% | ||||
| Cdn. 10-Year Bond CGB yield | 3.25% | 3.32% | (4.3)% | 2.2% | ||||
| Recession Watch Spreads | ||||||||
| U.S. 2-year 10-year Treasury spread | 0.33% | 0.34% | (10.5)% | 3.0% | ||||
| Cdn 2-year 10-year CGB spread | 0.30% | 0.37% | flat | 23.3% | ||||
| Currencies | ||||||||
| US$ Index | 108.44 | 109.42 (new highs) | 0.2% | 0.9% | up | up | up | |
| Canadian $ | 69.49 | 69.07 (new lows) | (0.3)% | (0.6)% | down | down | down | |
| Euro | 103.54 | 102.72 (new lows) | 0.3% | (0.8)% | down | down | down | |
| Swiss Franc | 110.16 | 109.30 (new lows) | 0.2% | (0.8)% | down | down | neutral | |
| British Pound | 125.11 | 121.68 (new lows) | (0.3)% | (2.7)% | down | down | down (weak) | |
| Japanese Yen | 63.57 | 64.01 | 0.9% | 0.7% | down | down | down | |
| Precious Metals | ||||||||
| Gold | 2,641.00 | 2,748.70 | 1.2% | 4.1% | up | up | up | |
| Silver | 29.24 | 31.14 | (0.5)% | 6.5% | up (weak) | up (weak) | up | |
| Platinum | 910.50 | 965.50 | (3.1)% | 6.0% | up (weak) | down (weak) | neutral | |
| Base Metals | ||||||||
| Palladium | 909.80 | 967.10 | (0.1)% | 6.3% | neutral | neutral | down | |
| Copper | 4.03 | 4.37 | 1.6% | 8.4% | up | neutral | up (weak) | |
| Energy | ||||||||
| WTI Oil | 71.72 | 77.39 | 1.1% | 7.9% | up | up (weak) | down (weak) | |
| Nat Gas | 3.63 | 3.95 (new highs) | (1.0)% | 8.2% | up | up | neutral | |
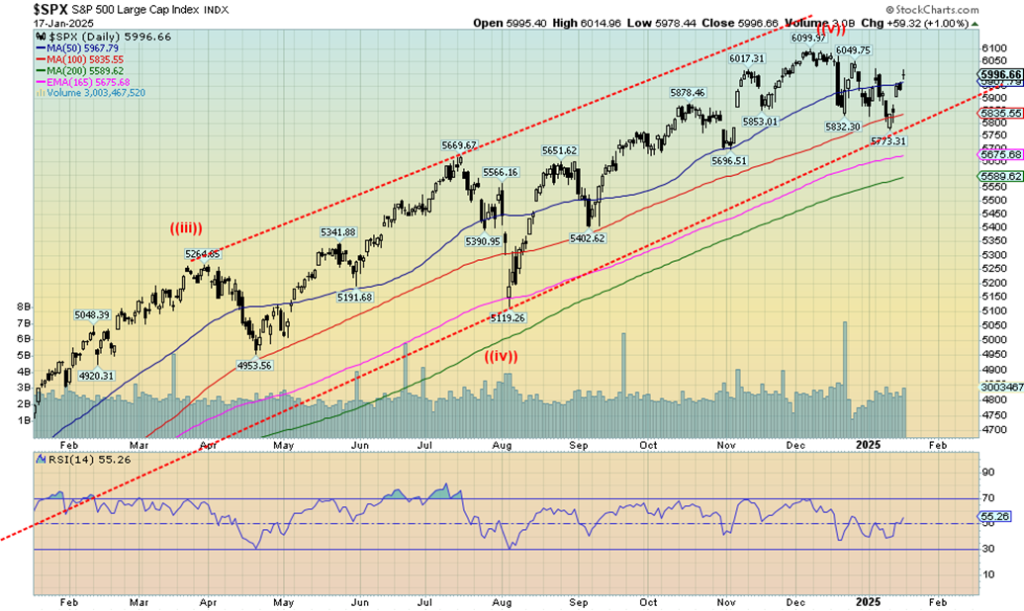
It was the second full week of 2025 as the unknown looms on January 20, 2025. Markets have been rising into the date. But is it a buy the rumour, sell the news type of situation? Trump has threatened many things to happen on Day 1 such as tariffs, deportations, etc. None of these will ultimately be good for the market. Then there are rising bond yields as the 10-year hit near 4.80% before settling back to close at 4.63%.
On the week, the S&P 500 (SPX) rose 2.9%, the Dow Jones Industrials (DJI) was up 3.7% (flight to safety of blue chips?), the Dow Jones Transportations (DJT) gained 3.2%, while the NASDAQ was up 2.5%. SPX is the one that’s closest to its former high. All the others remain well off, so far. The S&P 400 (Mid) was up 4.5% while the S&P 600 (Small) gained 4.4%. Neither of them is near their former high, either but that they led the week has some believing we are headed even higher. The S&P 500 Equal Weight Index gained 3.9%, outperforming the SPX, while the NY FANG Index was up 2.1%.
Elsewhere, Canada’s TSX gained 1.2% while the junior TSX Venture Exchange (CDNX) gained 1.3%. In the EU, the London FTSE made new all-time highs, up 2.8%, and the German DAX also made all-time highs, up 3.4%. The EuroNext was up 2.8% and the Paris CAC 40 rose 3.8%. In Asia, China’s Shanghai Index (SSEC) was up 2.3%, the Tokyo Nikkei Dow (TKN) fell 1.9%, while Hong Kong’s Hang Seng (HSI) jumped 2.7%. Noteworthy were the new all-time highs for the FTSE and the DAX.
The unknown starts on Monday (Note: U.S. markets are closed for Martin Luther King Day). Promises made in his first term were mixed. Remember the wall Mexico would pay for? Okay, that didn’t happen. But the blocking of Muslims did happen, even as deportations didn’t really happen much. Under Trump the debt soared, but the economy was still relatively robust until the pandemic hit. Over half of his first-term promises were never kept. Less than 25% were realized. The rest he had to compromise on. But it was a period when most of his cabinet picks could push back against him. His latest picks are more loyal and will, or at least are supposed to follow orders, regardless of their qualifications or lack thereof.
Trump is transactional, but are his promises bluster or opening salvos to force a deal? Day 1 next week could see the start of mass deportations, tariffs on Canada, Mexico and others, another Muslim ban—never mind that 3.5 million to 4.5 million Muslims already are in the U.S—ending of the Russia/Ukraine war, restrictions on citizenship, pardoning of J6 defendants currently in jail, deregulation of industry and banking, attacks on so-called “woke” ideology, and firing of all those responsible for the Afghanistan withdrawal. We may have missed some.
How all this impacts stock markets, bond markets, etc. is anyone’s guess. However, many of these actions are not friendly to markets. An upcoming period of chaos and volatility should be positive for gold and, by extension, silver and gold stocks. Gold, silver, and the gold stocks have outpaced the stock indices so far in 2025. Trump’s love of cryptocurrency could spur higher prices there as well. Will the cryptocurrency bubble burst?
The stock market has been rising this past week, leaving stocks up so far in 2025. But they remain short of their recent highs. If things are good, we should once again see new all-time highs. If not, the pattern suggests that we may fall instead. Failure to make new all-time highs will be viewed negatively. We break down under 5,800; under 5,400, it’s lights out.
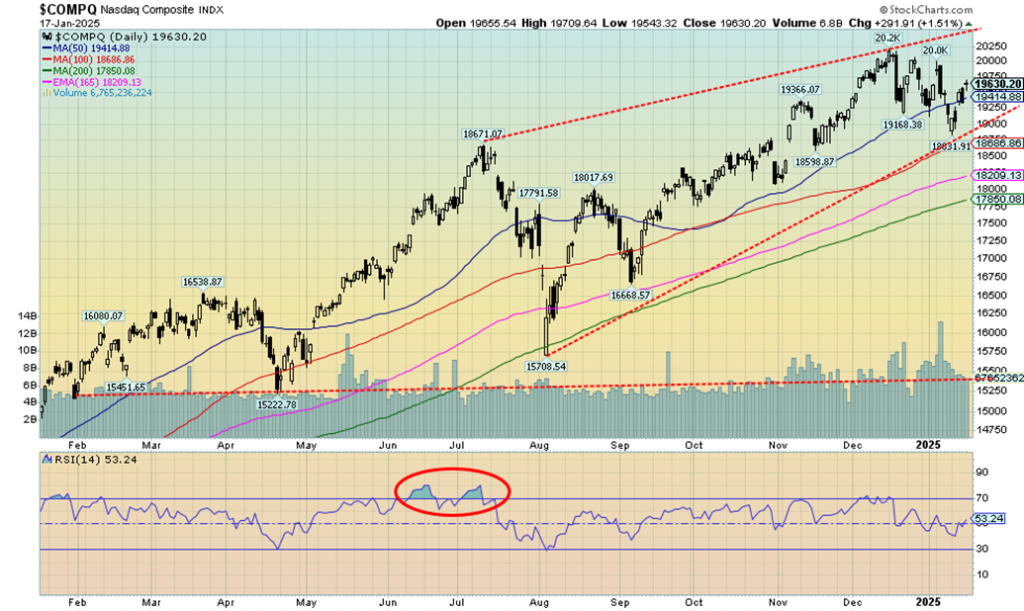
The NASDAQ rose 2.5% this past week, thanks to a rise in a number of the MAG7 stocks. The NY FANG Index rose only 2.1%, but some MAG7 stocks leaped. Amazon was up 3.2%, Google +2.3%, Microsoft +2.4%, Tesla +8.1%, and Nvidia +1.3%. Tempering the rise was Meta, down 0.5%, and Apple, off 2.9%. Notably, despite the rise this week, the NASDAQ remains well off its all-time high hit in November. It’s still down roughly 3%.
The SPX is off only 1.7%. The NASDAQ cleared the 50-day MA, but resistance remains at 20,000. If it can get through that level then new highs become possible. Our support zone is the lows near 18,800. A break under 19,000 would signal lower levels. The 200-day MA support is near 17,850. So far, the NASDAQ is in a bit of a downtrend, so, breaking above 20,000 is important to bust that downtrend.
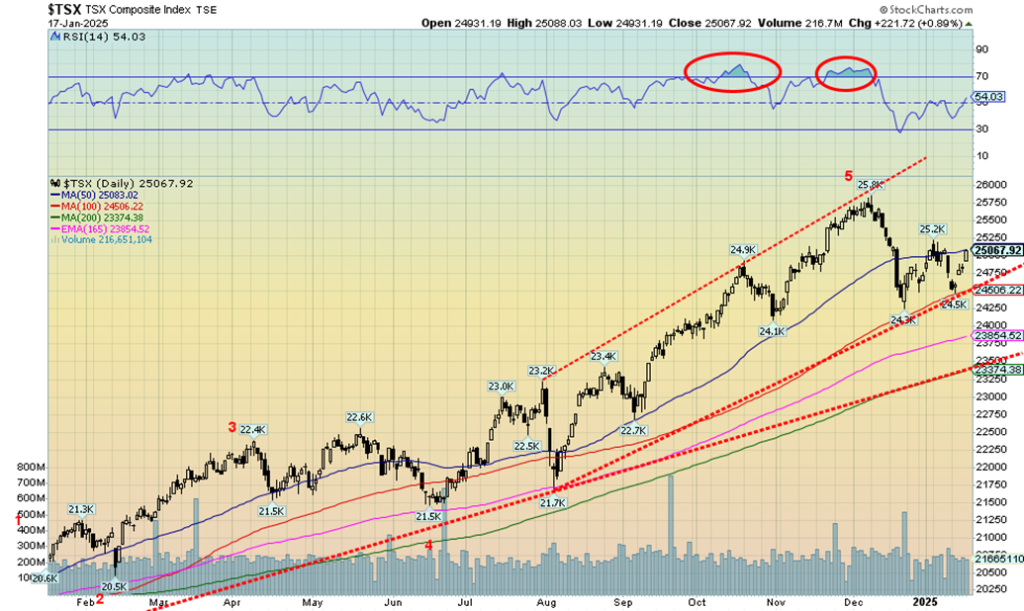
The TSX Composite rose 1.2% this past week but remains well off the November highs near 25,800. Could it also be ready to stall at the 50-day MA, which is where it closed on Friday? Five of the 14 sub-indices fell this past week, led by Energy (TEN) that fell 2.4%. Income Trusts (TCM) dropped 1.3%, while Telecommunications (TTS) fell 1.1%. The leaders on the upside were Metals & Mining (TGM), up 2.6%, followed by Financials (TFS), up 2.4%, and Information Technology (TTK), up 2.2%.
Going into 2025, the material sectors (golds, metals, and energy) remain our favourites to own. The TSX is at resistance, having successfully bounced off that uptrend line from the August 2024 low. A break under 24,500 will end it and could at minimum send us down to the gentler uptrend line near 23,500. Still, if we can continue upward, there is some resistance at 25,200. Above 25.5, new highs are possible.
U.S. 10-year Treasury Note, Canada 10-year Bond CGB
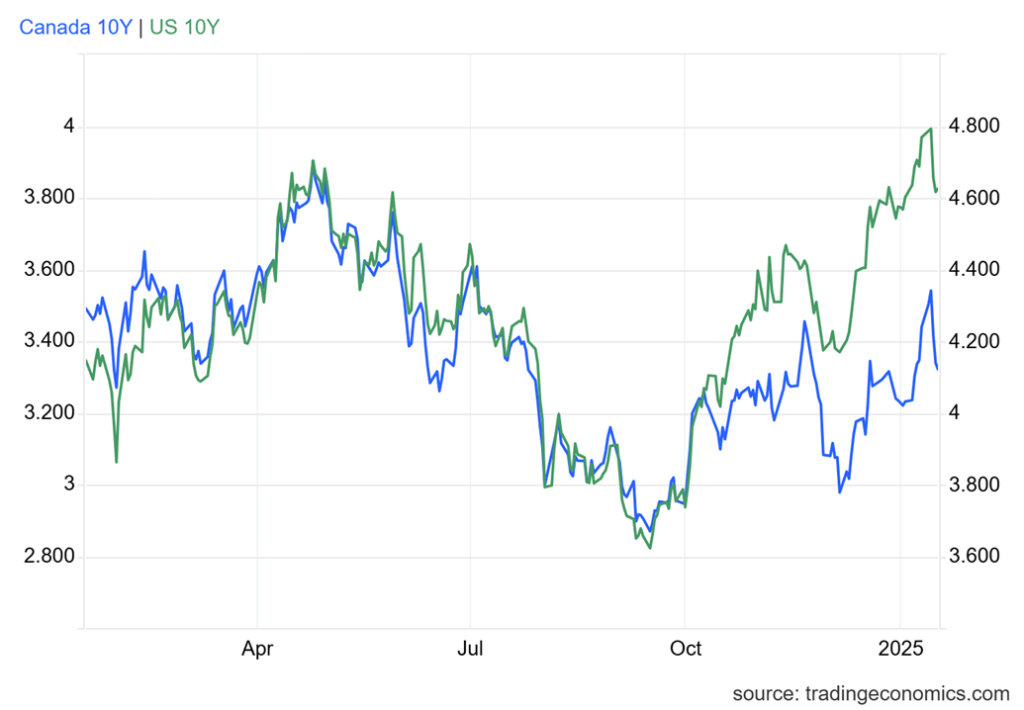
Inflation did not really rear its ugly head this past week with the release of both the CPI and PPI for December. The year-over-year (y-o-y) PPI was as expected at 3.3%, while the y-o-y CPI was also on the money at 2.9%. The core CPI was marginally better at 3.2%, down from 3.3% and the expected 3.3%. That said, it was the third monthly rise for the CPI making many wonder, will inflation rear its head again? Many of Trump’s policies are inflationary so it remains a possibility. The U.S. 10-year treasury note rose to a high of 4.79% before settling back to 4.63% on the somewhat softer CPI.
But the reality is that, while the Fed cut rates 100 bp, the 10-year rose 100 bp. It is the long end of the market where mortgage rates, etc. are priced, not the short end. It’s helped make the yield curve wider and leaves the U.S. Treasury wondering whether they should borrow short or borrow long. If the expectation is that rates will fall, then borrowing shorter dates helps. But if interest rates are to rise further, then it’s better to issue long dates. Bluntly speaking, the bond market is not acting as it did in the past where, if the Fed cut rates, long rates fell too. It’s a warning sign.
The bond market is looking at the debt ceiling and the potential for another fight. It is looking at the $2 trillion+ deficits that the U.S. still appears to be issuing every year with expectations that Trump could make it worse. The bond market is not merciful. The Fed controls the short end of the market, but the bond dealers control the long end and if they see trouble they sell. If they perceive that U.S. bonds are becoming too risky, they’ll sell. After all, S&P has already cut the U.S.’s debt rating from AAA to AA+.
Canada’s bond rates are rising as well, but not to the same extent as the U.S. bond rates. The 10-year Government of Canada bond (CGB) is at 3.32%, down from 3.47% just a week ago. Still, Canada also now has a positive yield curve given the cuts by the BofC. However, you might be surprised to know that Canada’s fiscal situation is not as dire as the U.S., where the U.S. federal debt to GDP ratio is 123% and could rise to 150% over the next few years. Canada’s federal debt to GDP is around 69%, the lowest in the G7. But add in the provinces and it soars to over 100%.
The U.S. dollar remains the world’s reserve currency and is expected to continue in that role. That helps create demand for U.S. securities. However, rising rates reflect growing nervousness about the stability of the U.S. market. Crossing 5% on the 10-year could be a sign of deeper trouble.
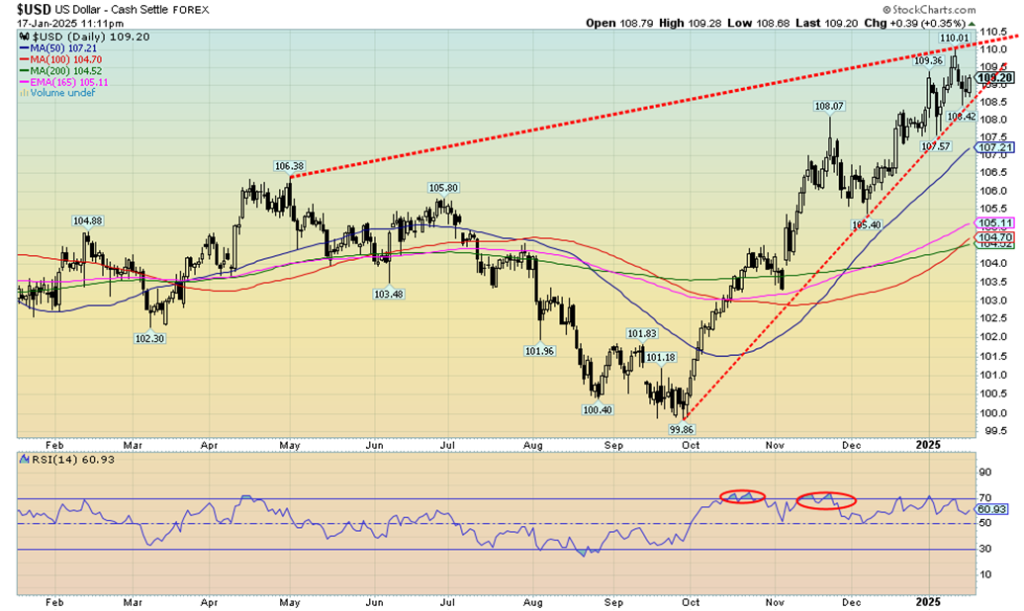
The US$ Index hit 52-week highs again this past week as it surged on a wave of speculation about the incoming Trump administration. The US$ Index settled back later, but on Friday it jumped to ensure a weekly gain. On the week, the US$ Index was actually down a small 0.2% despite the 52-week high. The currencies? They were all making 52-week lows.
The euro actually gained 0.3%, the Swiss franc was up 0.2%, the pound sterling was a loser, down 0.3%, while the Cdn$ also lost 0.3%. Only the Japanese yen didn’t make 52-week lows and it gained 0.9%. So, despite the new highs and lows, most if not all reversed on the week, ending either down (USDX) or up (euro, SF). Despite the ongoing strength of the dollar, gold has been gaining but fell on Friday when the USDX rebounded.
Could the USDX be forming a bit of an ascending wedge triangle? Maybe. The pattern is bearish. The triangle breaks under 108.50 and could in theory take the USDX back to at least 104. A breakdown under 104 would be more dangerous. There is room within the triangle to rise to 110. Since the wedge triangle is so new, we can’t confirm whether it actually is one or not. A firm break above 110 would do the opposite and end thoughts of the wedge triangle.
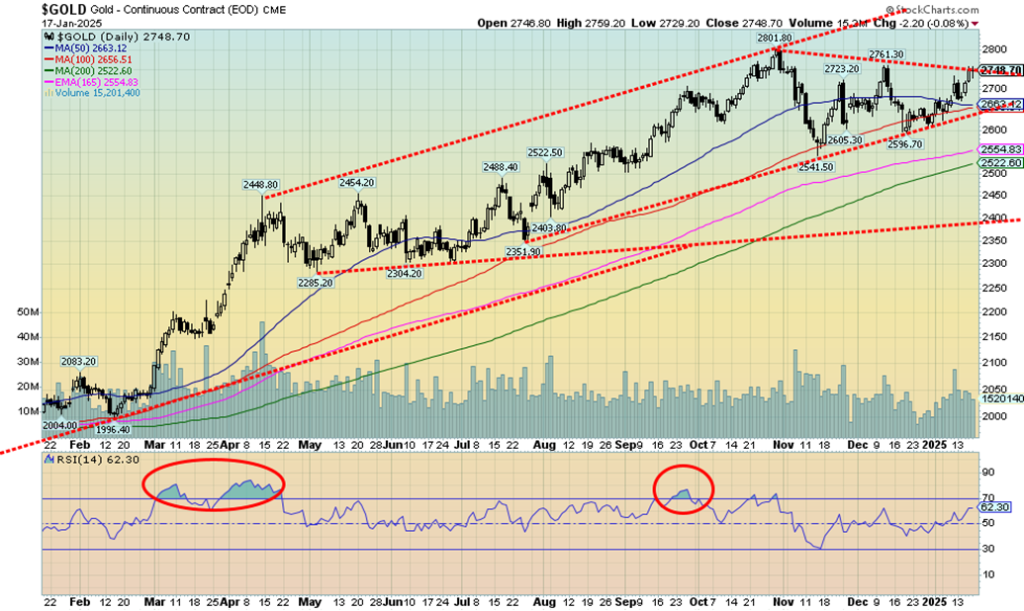
Despite a down Friday, gold prices managed to gain this past week, up 1.2%. Silver was down 0.5% while platinum fell 3.1%. Of the near precious metals, palladium was down 0.1% while copper (a leading indicator) gained 1.6%. The Gold Bugs Index (HUI) was up 1.1% and the TSX Gold Index (TGD) gained 1.9%. The catalyst for gold was the unknowns surrounding the incoming president, Donald Trump.
Trump’s policies on trade, tax cuts, deportations, etc. all give rise to uncertainty and that in turn is positive for gold. Demand has been shooting up in the London gold market as dealers seek to purchase physical bullion to close out futures trades in New York. The demand was to bring the bullion to the U.S. before any tariffs could be imposed. The same is happening with silver. The fear is that there just isn’t enough physical supply around.
Lease rates have soared to their highest level in decades. That hasn’t stopped the hunt for physical gold and silver, even as some suggest that because gold and silver are monetary metals they’d be exempt from tariffs. All these squeezes in the physical market could send gold and silver prices even higher. Gold stopped at our $2,750 breakout spot this week, but we fully expect it to break above it soon.
A strong U.S. dollar on Friday dampened gold a bit. But we noted that despite gold slipping the gold stocks rose. That’s ultimately bullish. Targets for gold remain up: $3,060 for gold and at least $38/$39 for silver. Higher prices could be seen later. The policies of incoming president Donald Trump could be very positive for gold as it is expected that the debt will grow even faster. And the market is also looking for at least two rate cuts from the Fed in 2025. If, as we noted, 2025 is a year of chaos and volatility, gold will do well in that kind of market.
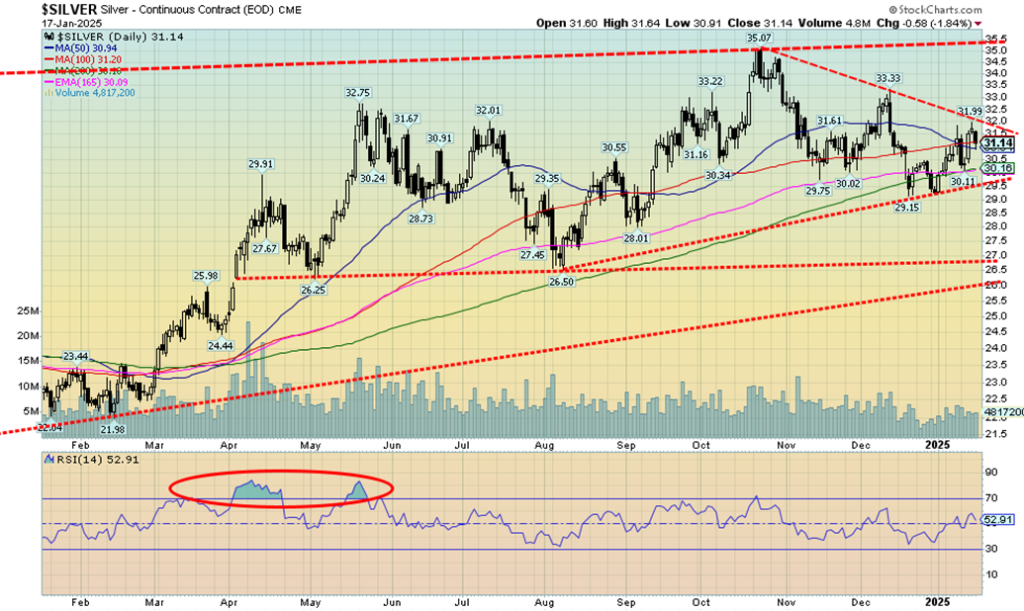
Despite gold rising this past week, silver prices softened, losing 0.5%. Still, with being only slightly over two weeks into the new year, silver is up 6.5% vs. gold up 4.1%. Only the gold stocks (HUI, TGD) have gained more than silver. Silver fell sharply on Friday, once again falling short of a breakout of that downtrend line from the October high of $35.07. We need to get through $32 resistance to break out and we need to break above $33.75 to suggest new highs above $35.07.
Despite everything, silver is leading gold, which is what we want to see in a bull market. Note: silver also leads to the downside. Silver has support down to $30 and $29.50. However, we still need to break above $32 to suggest to us that a low is in. Further resistance can be seen up to $33.25, but above that level the $33.75 breakout looms. Despite silver’s struggles, it still appears to hold more upside promise than gold. Gold has been making new all-time highs for sometime now. On the other hand, silver’s all-time highs were made in 1980 and in 2011 near $50.0. On an inflation-adjusted basis, that’s $175 and $67 today.
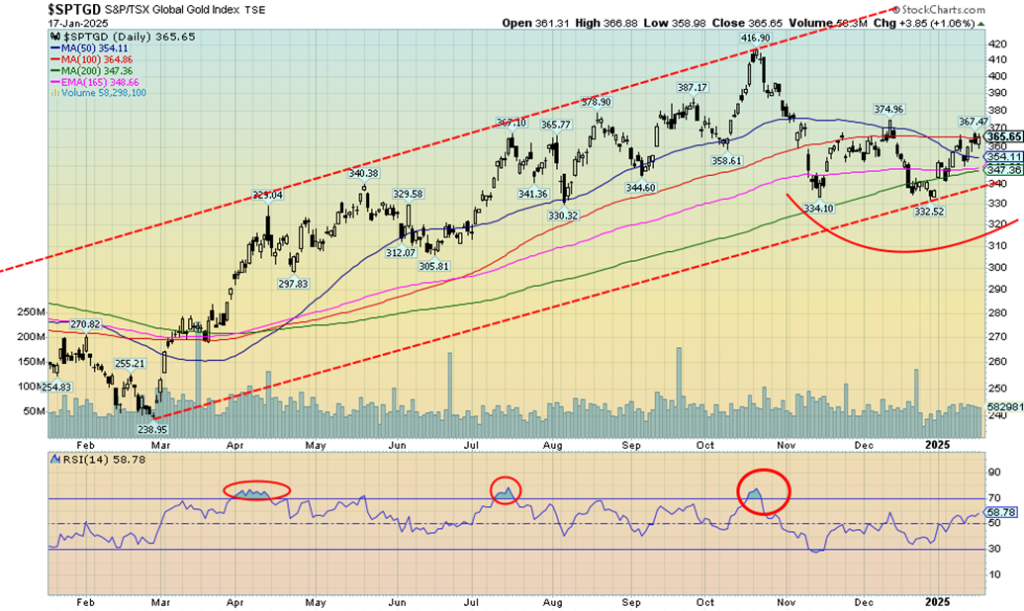
Gold stocks continued their recent rise this past week. What’s especially impressive is that they rallied on Friday despite a drop in gold prices. The TSX Gold Index (TGD) gained 1.9% this past week while the Gold Bugs Index (HUI) rose 1.1%. The TGD still needs to break out over 400 to suggest to us we could see new highs over 417. We still remain a long way from the 2011 high of 455, which would be at least 610 today after adjusting for inflation. The TGD stopped at the 100-day MA, a potential resistance zone. The HUI is at resistance of converging 50- and 200-day MAs, with the 100-day still above at 308.
The HUI needs to break above 334 to suggest new highs. Its all-time high, also in 2011, was at 639. We are a long way from that level. It shows how gold stocks remain undervalued, despite gold itself flirting with all-time highs. Over on the TSX Venture Exchange (CDNX) where it’s 50%+ junior mining stocks, it is even more undervalued. Sometimes it feels like nobody knows junior mining stocks even exist, so enamoured are they with AI and cryptos. But as another writer pointed out, junior miners perform best in a bust economy as they did in the 1930s and 1970s. The sector remains an accumulation buy. Support for the TGD is down to 345 and 340. Under 340, we are most likely headed lower.
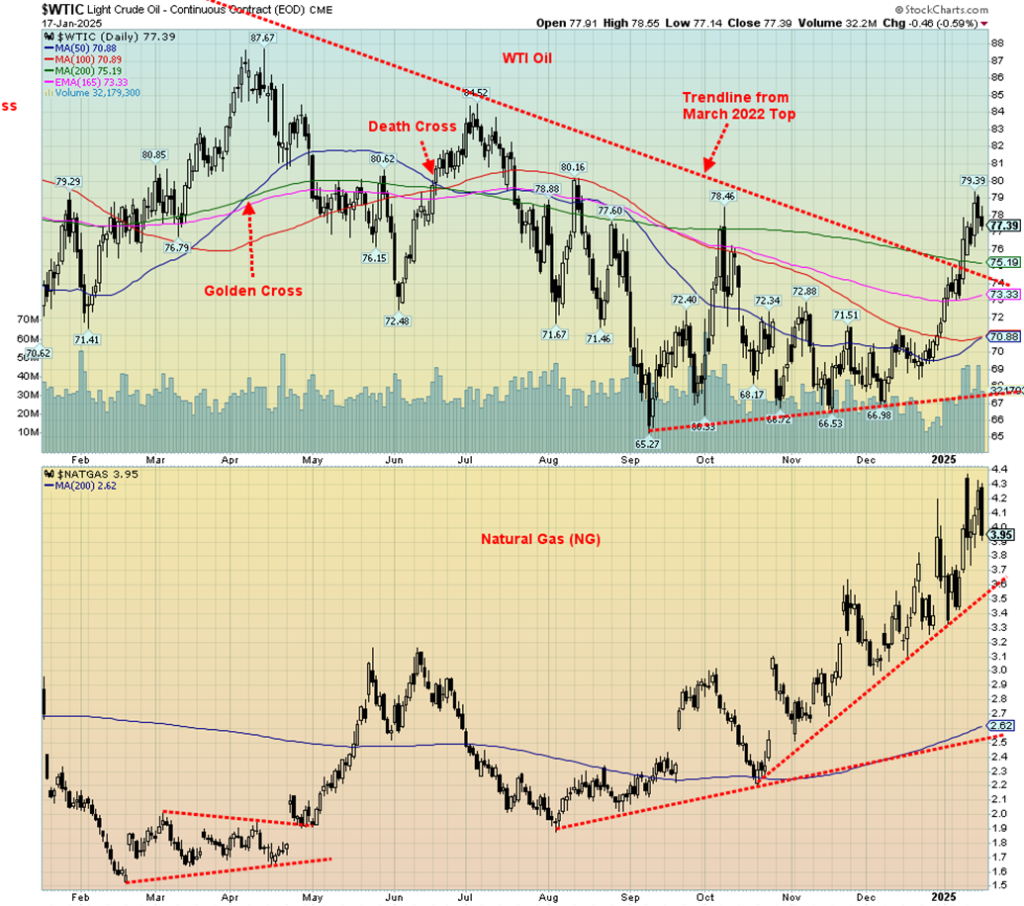
Oil prices finished the week to the upside, but softened on the news of an Israeli/Hamas cease fire. It may also end the Houthi attacks in the Red Sea which all along were billed as support for Hamas. However, don’t take any of this for granted. Breaking cease fires is a regular occurrence. Irrespective of this, WTI oil was up 1.1% this past week, briefly touching on $80 before settling back. Brent crude got up to $82 before settling back but still gained 1.2%. Natural gas (NG), still responding to the cold weather with more to come, actually hit new highs over $4.30 but settled back to close at $3.95, down 1.0% on the week. EU NG at the Dutch Hub was still responding to colder weather and gained 4.4% on the week.
The energy stocks were decidedly mixed as the ARCA Oil & Gas Index (XOI) gained 4.7% but the TSX Energy Index (TEN) fell 2.4%. The TEN fell as Canadian Natural Resources (CNQ) dropped 3.9%. Some profit-taking, fear of higher interest rates, and the potential for tariffs all conspired to drop the TEN.
WTI oil is still holding above that trend line, down from the 2022 Russian invasion of Ukraine top. That continues to suggest to us that we should go higher. We had noted $80 as potential resistance and, so far, that’s the case. There is even more resistance, up between $85 and $95. Once over $95, oil prices could begin to surge, particularly if problems break out over Iran. It’s a country in the sightlines of the U.S. A recent pact with Russia heightens the potential for trouble in the Persian Gulf. Sanctions on Russia’s ghost ships have also recently helped the price of oil. Take away supply and prices rise. There is also talk from the incoming Trump administration of re-installing sanctions on Venezuela. That could further curtail supply.
Copyright David Chapman 2025
__
(Featured image by Erol Ahmed via Unsplash)
DISCLAIMER: This article was written by a third party contributor and does not reflect the opinion of Born2Invest, its management, staff or its associates. Please review our disclaimer for more information.
This article may include forward-looking statements. These forward-looking statements generally are identified by the words “believe,” “project,” “estimate,” “become,” “plan,” “will,” and similar expressions, including with regards to potential earnings in the Empire Flippers affiliate program. These forward-looking statements involve known and unknown risks as well as uncertainties, including those discussed in the following cautionary statements and elsewhere in this article and on this site. Although the Company may believe that its expectations are based on reasonable assumptions, the actual results that the Company may achieve may differ materially from any forward-looking statements, which reflect the opinions of the management of the Company only as of the date hereof. Additionally, please make sure to read these important disclosures.
David Chapman is not a registered advisory service and is not an exempt market dealer (EMD) nor a licensed financial advisor. He does not and cannot give individualised market advice. David Chapman has worked in the financial industry for over 40 years including large financial corporations, banks, and investment dealers. The information in this newsletter is intended only for informational and educational purposes. It should not be construed as an offer, a solicitation of an offer or sale of any security. Every effort is made to provide accurate and complete information. However, we cannot guarantee that there will be no errors.
We make no claims, promises or guarantees about the accuracy, completeness, or adequacy of the contents of this commentary and expressly disclaim liability for errors and omissions in the contents of this commentary. David Chapman will always use his best efforts to ensure the accuracy and timeliness of all information. The reader assumes all risk when trading in securities and David Chapman advises consulting a licensed professional financial advisor or portfolio manager such as Enriched Investing Incorporated before proceeding with any trade or idea presented in this newsletter.
David Chapman may own shares in companies mentioned in this newsletter. Before making an investment, prospective investors should review each security’s offering documents which summarize the objectives, fees, expenses and associated risks. David Chapman shares his ideas and opinions for informational and educational purposes only and expects the reader to perform due diligence before considering a position in any security. That includes consulting with your own licensed professional financial advisor such as Enriched Investing Incorporated. Performance is not guaranteed, values change frequently, and past performance may not be repeated.

-

 Africa2 weeks ago
Agadir Allocates Budget Surplus to Urban Development and Municipal Projects
-

 Cannabis3 days ago
South Africa Proposes Liberal Cannabis Regulations with Expungement for Past Convictions
-

 Biotech1 week ago
Volatile Outlook for Enlivex Therapeutics as Investors Await Clinical Catalysts
-

 Markets5 days ago
Weather-Driven Supply Outlook Lifts Coffee Markets in Brazil and Vietnam


