Business
Markets Now Appear Steady, but Cracks Are Forming Beneath
Financial markets appear calm, yet risks are rising. Fed divisions and higher global bond yields, especially in Japan, threaten stability as the yen carry trade unravels. Canada’s strong jobs data lifted yields and its currency. Markets were mostly quiet, though silver hit new highs and natural gas rose. Economic inequality grows while geopolitical tensions affect oil.

Considerable talk continues about who will be the next Fed chairman. One thing is certain, however; whoever it will be will have to be a Trump loyalist and be prepared to lower interest rates, even sharply. So far, the choice seems to be leaning towards Kevin Hassett, the former senior advisor and Chairman of the Council of Economic Advisors (2017–2019) during Trump’s first term.
Hassett is currently the Director of the National Economic Council since 2025, appointed by Trump. Hassett has also worked at the American Enterprise Institute, a conservative think tank, and has also worked as an economic advisor on the presidential campaigns of George W. Bush (2004), John McCain (2008), and Mitt Romney (2012).
What’s key here is to lower interest rates, something highly desired by President Trump. How will the market react to someone who is clearly a political appointee to do the president’s bidding? That’s unknown, of course. However, one thing we glean from all of this is that the measurement of the economy’s success is not so much the GDP numbers but how much the stock market goes up. Lower interest rates, plus the potential for additional liquidity through quantitative easing (QE) and government spending, including the huge deficits, all help increase money supply. That in turn goes into the stock market and the wealthy become wealthier. As for everyone else? Meh!
The previous week (Technical Scoop – December 1st, 2025) we noted the deep divisions in the Fed and that, in the past, deep divisions within the Fed occurred before the onset of a recession. The Fed moved to quantitative tightening (QT) in 2022 and both the Fed balance sheet and money supply (M1) contracted. But even as the Fed balance sheet continued to contract, M1 started rising again in 2024. Since 2008 M1 has exploded 1,279%. As for the stock market? The S&P 500 is up 357%.
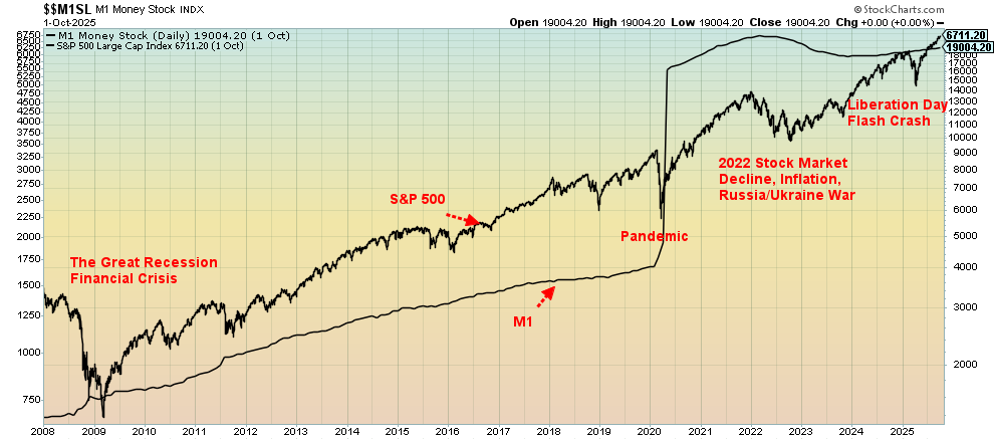
To give this further perspective, we note that U.S. federal debt has soared 307% during the same period and gold is up 363%. More cash in the financial system, more debt into the financial system, and assets soar—stocks, gold, art, coins, houses, etc. A bubble develops. And now President Trump wants to keep the party going. The measure of success of the economy is that the stock market keeps on rising. The S&P 500 is up 16.5% so far in 2025 and if that continues, then the economy must be good. But, then again, maybe not.
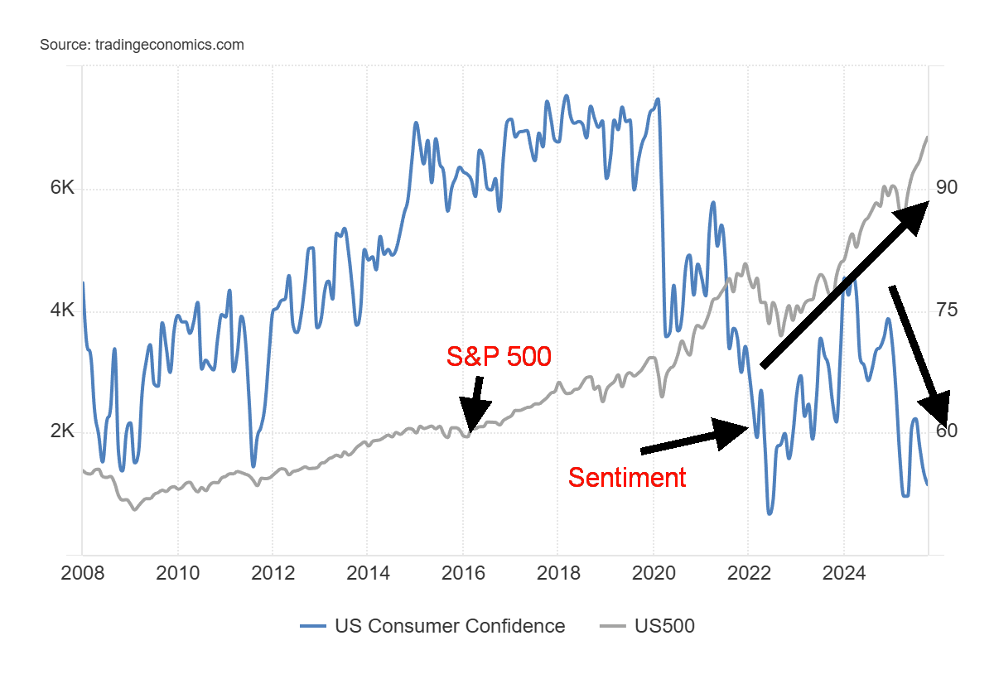
As we’ve often noted, consumer sentiment is down around levels seen at the bottom of major recessions like 1980–1982 and 2007–2009. Consumer sentiment down sharply, stock market up. They have a name for that—the K-shaped economy. Surprisingly, however, retail sales have remained okay and, according to reports, the recent Black Friday sales have gone well. The consumer is 70% of the economy, so as the consumer goes so goes the economy. But as we have learned 10% of earners account for roughly 50% of consumer spending. 10 AI stocks account for 40% of the S&P 500.
According to numbers at U.S. Debt Clock (www.usdebtclock.org), there are 23,879,091 millionaires in the U.S. or less than 1% of the population. There are 900–1100 billionaires in the U.S. or 0.00004% of the number of millionaires. For the upper 10% of the population, the bulk of their wealth comes from the stock market. Therefore, there is interest in keeping it up. Hence, a compliant Fed that deals with interest rates and liquidity is quite important. The more wealth they have, the more they spend.
Government spending is also good for the economy. Just three items make up 60% of U.S. government spending: Medicare/Medicaid, Social Security, and defense. Interest on the debt makes up at least 13.5% of government spending and, together with the first three items, they basically offset the U.S.’s government’s tax revenues. What does that tell you? The U.S. spends $7.2 trillion/annually, but only takes in $5.3 trillion, according to the latest numbers. Technically, the U.S. is bankrupt.
Are we headed for an everlasting nirvana of a stock market that goes up 15%–20% per year? Trump/Hassett might deliver it to them. As to the bottom half of the economy? Meh! Despite the impressive gains of the stock market, it’s only fair to point out that the S&P 500 in terms of gold (S&P 500/Gold ratio) has fallen over 70% from its all-time high in 2000 and is down almost 40% from its most recent high seen in 2022. The ratio is down 24.5% in 2025.
Gold is more valuable than the stock market. But Trump wants to ensure the stock market keeps going up so he can point to a strong economy, and he wants lower interest rates to make borrowing money cheaper for all, especially the U.S. government with its $38 trillion dollar of debt. By keeping interest rates low, the stock market goes up, and people—governments, corporations, and households—keep borrowing money to buy things and keep the economy rolling. All this ensures that gold will keep going up as it’s the safe haven, the counter asset.
Tale of Two Economies? S&P 500 vs. Consumer Sentiment 2008–2025
However, as many have pointed out, there is danger lurking in the background. Trump may be able to manipulate the Fed into lowering interest rates and providing oodles of liquidity to the market, but he can’t control the bond market. And here is where the danger lies. We have noted that after years of slumber Japan’s inflation is rising and in response Japan’s bond yields are also rising. The Bank of Japan (BOJ) must respond by hiking interest rates on its key rate.
For years following the 2008 financial collapse and Great Recession, Japan’s 10-year bonds (JGBs) have traded sub 1.00%. They even went negative during the period 2016–2021 as Japan constantly teetered on the edge of a recession. Japan’s GDP growth rate since 1990, when their stock market and real estate market topped following what was clearly a bubble in the late 1980s, has averaged barely 1%/annually. At least for the moment, Japan remains the world’s fifth largest economy, having recently given up its fourth place ranking to India.
Japanese 10-year treasury bond vs. U.S. 10-year treasury note 2007–2025
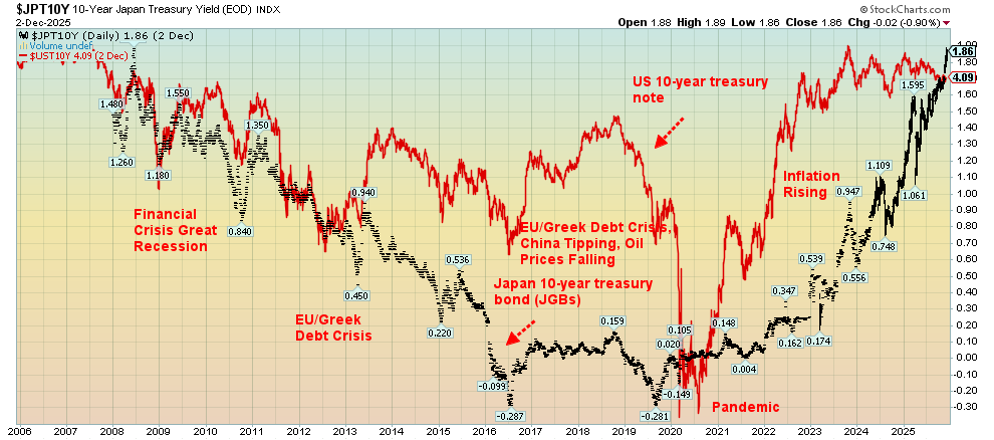
Japan’s 10-year Treasury bond has now risen to an unheard-of 1.86%. The rise is weighing on interest rates everywhere. The yen carry trade (i.e., borrow cheap money in Japan, convert it, then buy U.S. Treasury bonds/notes or crypto stocks, etc. for the higher returns) is unravelling. The trade works if Japanese interest rates remain low and the yen stays weak. But now Japanese rates are rising, the yen remains weak, and the U.S. is cutting rates as well. Investors (speculators?) are forced to sell their foreign assets to pay back their yen loans. The recent downtrend of Bitcoin is a sign that the yen carry trade is unwinding. There is an estimated $1 trillion tied up in the yen carry trade.
Japan has the world’s highest debt/GDP, estimated at 230%. With the killing of the yen carry trade, Japan’s huge debt load may come under pressure as it’s forced to rollover maturities at much higher rates than they are used to or prepared for. We have noted the potential for a sovereign debt crisis. It’s one thing when developing countries, particularly in Africa and even countries like Ukraine, teeter on the edge of default. It’s another when the world’s fifth largest economy is flirting with default.
Rumours persist that both the U.K. and France also have difficult debt problems. And let’s not forget that the U.S. has the largest debt pile in the world: over $38 trillion for the federal government and over $105 trillion for all governments, corporations, and households. That’s over 30% of all global debt. Debt is the Achilles heel.
U.S. 10-year yields have held mostly above 4% since 2023. That is becoming the floor. Fear of more debt, continued growth in the economy, a still-rising stock market, and the Fed lowering interest rates and providing the financial system with liquidity weighs on the bond market and keeps rates higher. The word ‘inflation’ is front and center. As well, refinancing $38 trillion in debt is becoming more difficult.
The yen carry-trade has helped facilitate a speculative boom. The unwinding of that trade and the subsequent rise in interest rates could weigh heavily on risk appetite worldwide.
Chart of the Week
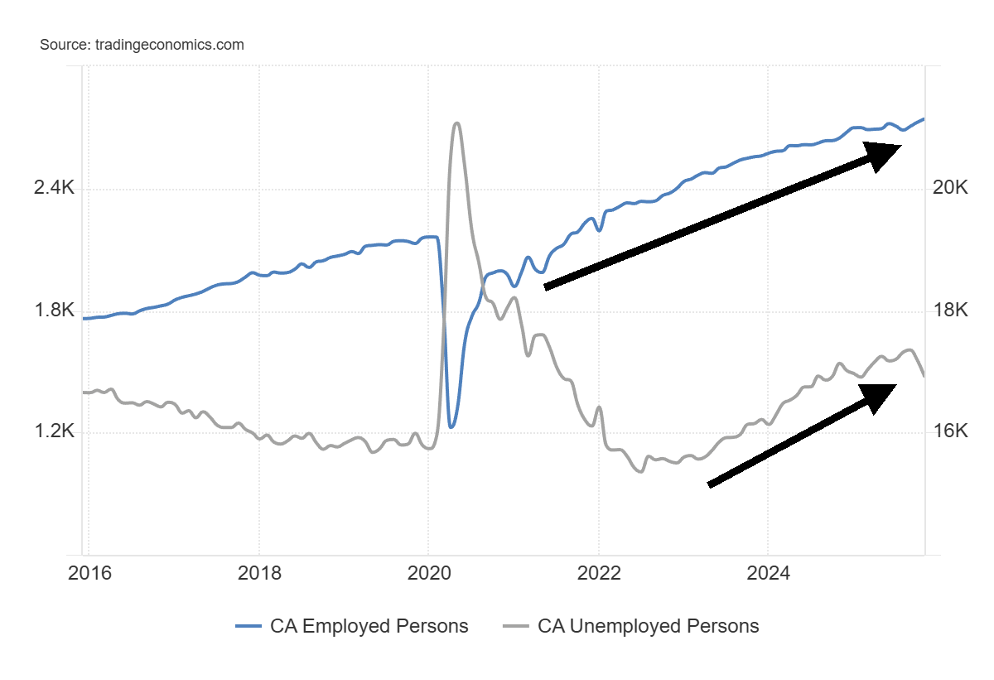
Canada Employed Persons vs. Unemployed Persons 2015–2025
Where, oh, where are the U.S. job numbers that normally come out the first Friday of each month? Oh yes, the shutdown. While Canada continues to publish its job numbers, the U.S.’s numbers are nowhere to be found. Okay, we do note from the Bureau of Labour Statistics (BLS) that they are now due to come out on December 16, 2025. At least, the November job numbers. As to the October job numbers, those are still to be seen.
The U.S. shutdown has disturbed the release of numerous numbers that are counted on by the Fed, economists, financial firms, corporations, and more. The job numbers are one of, if not the most important, releases each month, along with GDP and inflation (CPI, PPI, PCE). Without them we are flying blind as to the state of the economy. To date, no projections are available as we’re sure that all who depend on these numbers are flying by the seat of their pants.
Nonetheless, Canada keeps up the releases. Even if parliament shut down, government offices would continue to function as Canada does not have the ability to shut down the government like the U.S. does. Funding continues. Canada’s departments and agencies also operate with considerably less government interference. Canada does not use appropriations but instead operates on parliamentary confidence.
Canada does have appropriation bills but, given their financial importance, if they fail to pass parliament then the government loses on a confidence vote, and an election is called. However, the government departments and agencies continue to operate. They cannot be shut down.
Canada Unemployment Rate vs. Employment Rate 2015–2025
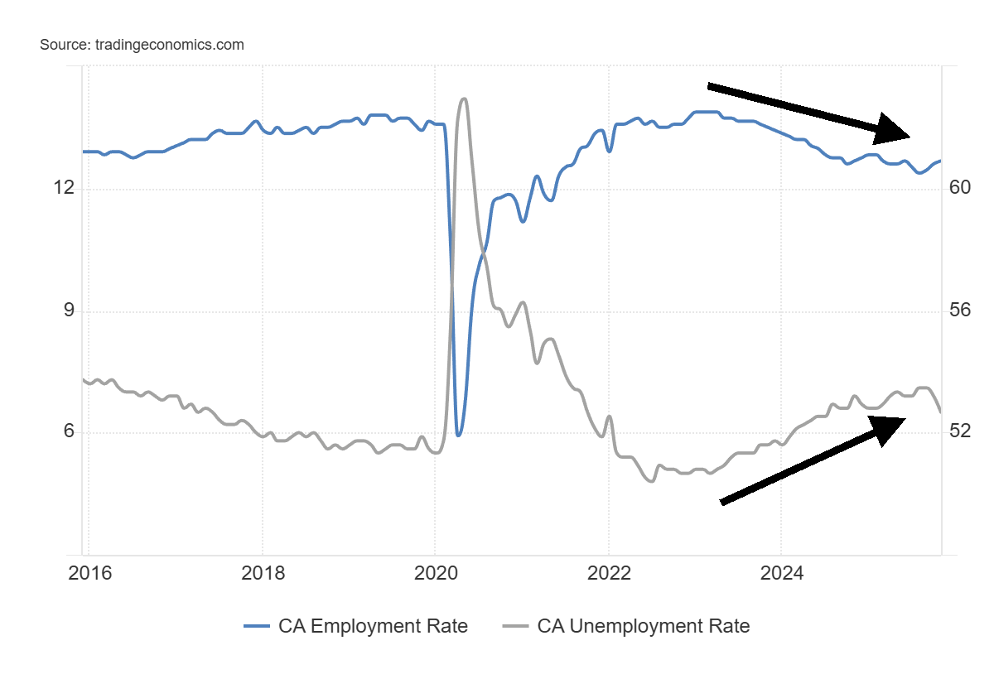
Surprisingly, Canada continued to deliver good employment numbers in November. Some 53,600 jobs were created in November, well above the consensus of a 5,000 drop. This comes on top of the 66,600 increase in October. If there was a concern with these numbers, it was that 63,000 of them were part-time workers while the number for full-time workers fell 9,000. Most of the jobs were in health and social assistance, accommodation and food services, and natural resources. Wholesale and retail trade fell. The biggest gain was in Alberta. Youth employment saw the largest gain.
As a result of the big gain, the unemployment rate fell to 6.5%, a big decline from the previous month’s 6.9%. It’s the lowest unemployment rate for 2025. If there was a fly in the ointment, it was the R8 unemployment rate (the highest reported by Statistics Canada that includes discouraged searchers, waiting group, portion of involuntary part-timers) rose to 8.4% from 8.2%. The number of people employed rose to 21,135.5 thousand, up 53,600 on the month.
Even the youth unemployment rate fell to 14.1% from 14.7% (October numbers only to date). All of this has us wondering, what was the impact of the tariffs? The gains and losses are uneven. Algoma lays off people, Alberta hires (oil patch?). Immigration curbs also had an impact on the rates. Were these numbers outliers, or the start of a trend?
If there was another fly in the ointment, it was that the participation rate fell to 65.1% from 65.3%. That suggests that fewer were working, despite the increase in employed persons.
Overall, these numbers were mixed, but at least they showed gains and the unemployment rate fell.
Now, will those U.S. numbers ever come out?
Markets & Trends
| % Gains (Losses) Trends | ||||||||
| Close Dec 31/24 | Close Dec 5/25 | Week | YTD | Daily (Short Term) | Weekly (Intermediate) | Monthly (Long Term) | ||
| S&P 500 | 5,881.63 | 6,870.40 | 0.3% | 16.8% | up | up | up | |
| Dow Jones Industrials | 42,544.22 | 47,954.99 | 0.5% | 12.7% | up | up | up | |
| Dow Jones Transport | 15,894.75 | 17,183.12 (new highs) | 3.6% | 8.1% | up | up | up | |
| NASDAQ | 19,310.79 | 23,578.13 | 0.9% | 22.1% | up | up | up | |
| S&P/TSX Composite | 24,796.40 | 31,311.41 (new highs) * | (0.2)% | 26.6% | up | up | up | |
| S&P/TSX Venture (CDNX) | 597.87 | 939.76 | 0.3% | 57.2 | up (weak) | up | up | |
| S&P 600 (small) | 1,408.17 | 1,479.87 | 0.6% | 5.1% | up | up | up | |
| ACWX MSCI World x US | 51.43 | 66.97 | 0.8% | 30.2% | up | up | up | |
| Bitcoin | 93,467.13 | 89,476.28 | (1.8)% | (4.3)% | down | down | up | |
| Gold Mining Stock Indices | ||||||||
| Gold Bugs Index (HUI) | 275.58 | 663.76 | (2.0)% | 140.9% | up | up | up | |
| TSX Gold Index (TGD) | 336.87 | 773.75 | (3.2)% | 129.7% | up | up | up | |
| % | ||||||||
| U.S. 10-Year Treasury Bond yield | 4.58% | 4.14% | 3.0% | (9.6)% | ||||
| Cdn. 10-Year Bond CGB yield | 3.25% | 3.42% | 8.6% | 5.2% | ||||
| Recession Watch Spreads | ||||||||
| U.S. 2-year 10-year Treasury spread | 0.33% | 0.57% | 9.6% | 72.7% | ||||
| Cdn 2-year 10-year CGB spread | 0.30% | 0.78% | 6.9% | 160.0% | ||||
| Currencies | ||||||||
| US$ Index | 108.44 | 98.99 | (0.4)% | (8.7)% | down | neutral | down | |
| Canadian $ | 69.49 | 0.7229 | 1.0% | 4.0% | up | neutral | neutral | |
| Euro | 103.54 | 116.43 | 0.4% | 12.5% | up | up (weak) | up | |
| Swiss Franc | 110.16 | 124.33 | (0.2)% | 12.9% | down (weak) | up (weak) | up | |
| British Pound | 125.11 | 133.33 | 0.8% | 6.6% | up | neutral | up | |
| Japanese Yen | 63.57 | 64.39 | 0.6% | 1.3% | down | down | down | |
| Precious Metals | ||||||||
| Gold | 2,641.00 | 4,196.58 | (0.5)% | 58.9% | up | up | up | |
| Silver | 29.24 | 58.33 (new highs) * | 3.5% | 99.5% | up | up | up | |
| Platinum | 910.50 | 1,649.00 | (1.6)% | 81.1% | up | up | up | |
| Base Metals | ||||||||
| Palladium | 909.80 | 1,470.50 | 1.5% | 61.6% | up (weak) | up | up (weak) | |
| Copper | 4.03 | 5.37 | 3.5% | 33.3% | up | up | up | |
| Energy | ||||||||
| WTI Oil | 71.72 | 60.12 | 1.1% | (16.2)% | up (weak) | down | down | |
| Nat Gas | 3.63 | 5.30 (new highs) | 11.1% | 46.0% | up | up | up | |
Source: www.stockcharts.com
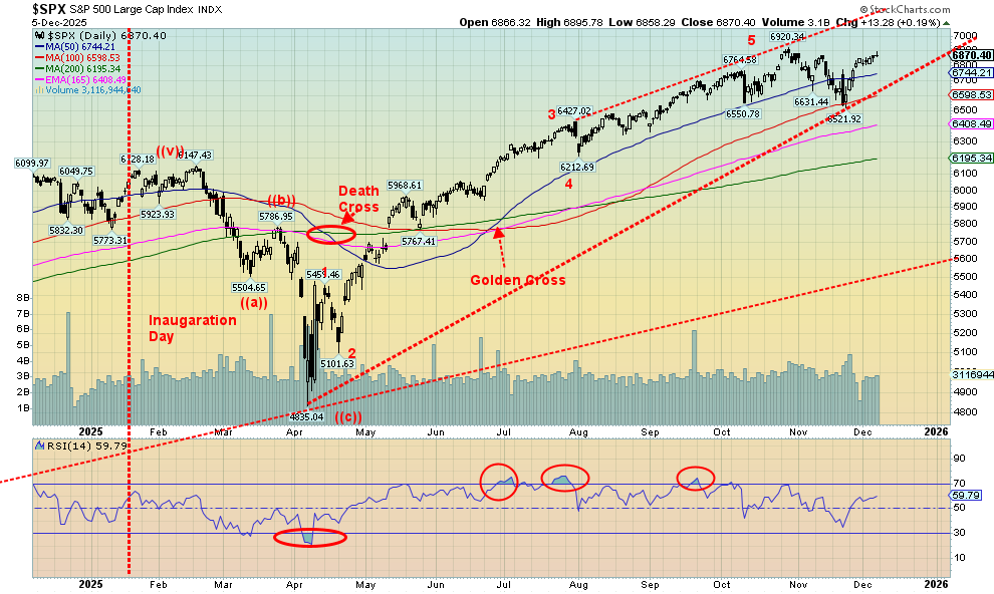
As we move into the home stretch for 2025, markets continue to dazzle. New highs are now within sight for the major indices. Okay, not the Dow Jones Transportations (DJT), although it did make 52-week highs this past week, up 3.6%, the best of the major indices. The S&P 500 (SPX) has moved past the point of suggesting new all-time highs. That point was at 6,826 and we closed at 6,870. New highs, it seems, are on the horizon.
A remarkable run for 2025, but promises of lower interest rates, oodles of liquidity, and a $2 trillion deficit help push the market higher. The fly in the ointment is the bond market not cooperating with yields rising, not falling, and the warning sign from gold.
On the week, the SPX rose 0.3%, the Dow Jones Industrials (DJI) was up 0.5%, as noted, the DJT made new 52-week highs, up 3.6%, and the NASDAQ rose 0.9%. The S&P 400 (Mid) rose 0.4% while the S&P 600 (Small) was up 0.6%. The S&P 500 Equal Weight Index rose 0.2% and is underperforming the S&P 500, thanks to the strong performance of the MAG7 plus a few others. The NY FANG Index fell 0.1% while Bitcoin turned tail and fell 1.8%. Is Bitcoin warning of a sell-off ahead? Or does Bitcoin have its own special issues? Bitcoin is down 4.3% in 2025.
In Canada, the TSX Composite fell 0.2% but the TSX Venture Exchange (CDNX) rose 0.3%. In the EU, the London FTSE was down 0.6%, the EuroNext was largely flat, the Paris CAC 40 fell 0.1%, and the German DAX was up 0.8%. In Asia, China’s Shanghai Exchange (SSEC) rose 0.4%, the Tokyo Nikkei Dow (TKN) was up 0.5%, while Hong Kong’s Hang Seng (HSI) rose 0.9%. The party of 2025 just keeps on going.
December is notably a good month for stocks, and then we have the Santa Claus rally in the last five days of December and the first few days of January. Pinpointing a top in early January would not be a surprise, given that we are now expecting new all-time highs. Still, while December is typically a strong month, not every year cooperates. Anybody remember 2018? However, signs are positive for the rest of the month.
We guess the motto is “be long, you can’t be wrong.” 2025 has been a great year. But what about 2026? Our forecast issue is next week.
The big story of the week will be the FOMC on Wednesday and the widely expected rate cut. Will it be “buy the rumour” (the Fed will cut interest rates) and “sell the news” (the Fed cut interest rates)?
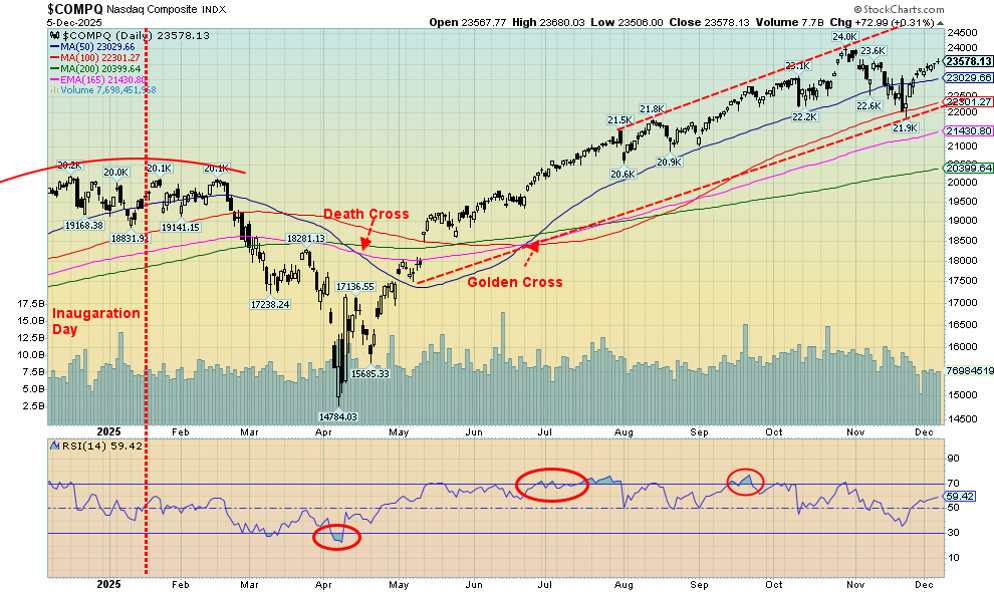
Thoughts of lower interest rates, oodles of liquidity, and deficits all help stocks stay up and this week was no exception with the NASDAQ up 0.9% once again, threatening new all-time highs. We have now passed the point at 23,500 which suggests new highs are now possible. The NY FANG Index actually fell 0.1%, putting a crunch on the gains and has us wondering whether the NASDAQ can hit new highs without the full participation of the MAG7 and FANG stocks. Of the MAG7, Apple did make all-time highs, up 0.6%.
Netflix tumbled 6.8% on concerns over the purchase of Warner Brothers Discovery. It wasn’t viewed positively. The biggest gainer was Baidu, up 7.5%, while the biggest loser was Snowflake, down 8.7%. Volume is tailing off as we move into December. Tax loss season should be quiet, given markets are up this year. The NASDAQ is up 22.1% in 2025, the best of the U.S. major indices.
Selected Performance since Inauguration Day, January 20th, 2025
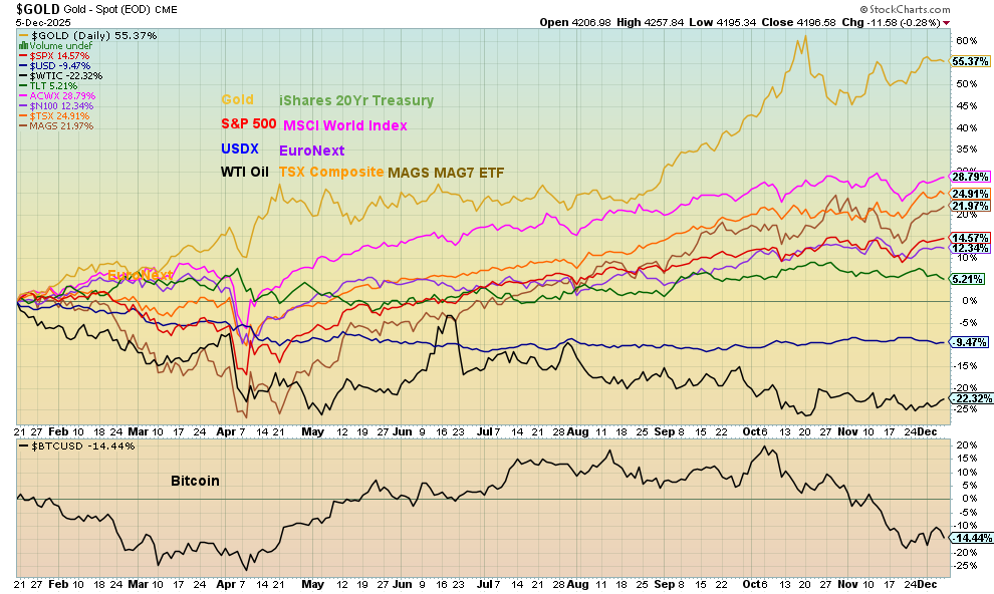
It’s fun showing this chart as we can call it the Trump effect chart. Despite an off week, gold remains the leader since Inauguration Day on January 20, up 55.4%. Next is the MSCI World Index (ex USA) ETF, up 28.8%. WTI oil remains in the cellar, down 22.3%, while Bitcoin is gaining, down 14.4%. The US$ Index is also down 9.5%. But the real story is that 2025 has been a golden year.
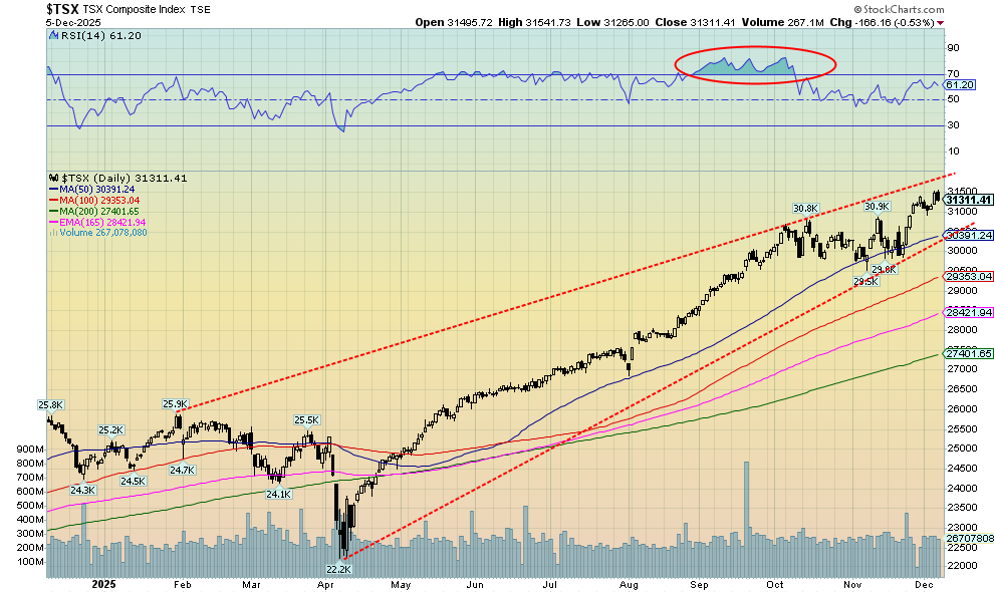
New all-time highs are getting to be habit for the TSX. We did it again this past week. But the week ended on a sour note as the TSX made all-time highs, then closed lower, a reversal day (not a key reversal). The TSX did not take out the low of the previous day, which would have set up a key reversal day. The TSX fell 0.2% this past week while the TSX Venture Exchange (CDNX) rose about 0.3%. Only four of the 14 sub-indices rose on the week, led by Health Care (THC), up 4.6%. Consumer Staples made all-time highs but closed down 1.0%.
Financials (TFS) made all-time highs but gained 1.4%. Financials plus the materials (golds, metals, materials) have led the TSX up in 2025. While the TSX made all-time highs, the TSX 60 did not, a divergence. We are nearing the top of the bull channel. A breakdown under 30,400 would be negative. But we need to break under 29,500 to tell us a top is in. New highs keep the party going.
U.S. 10-year Treasury Note, Canada 10-year Bond CGB
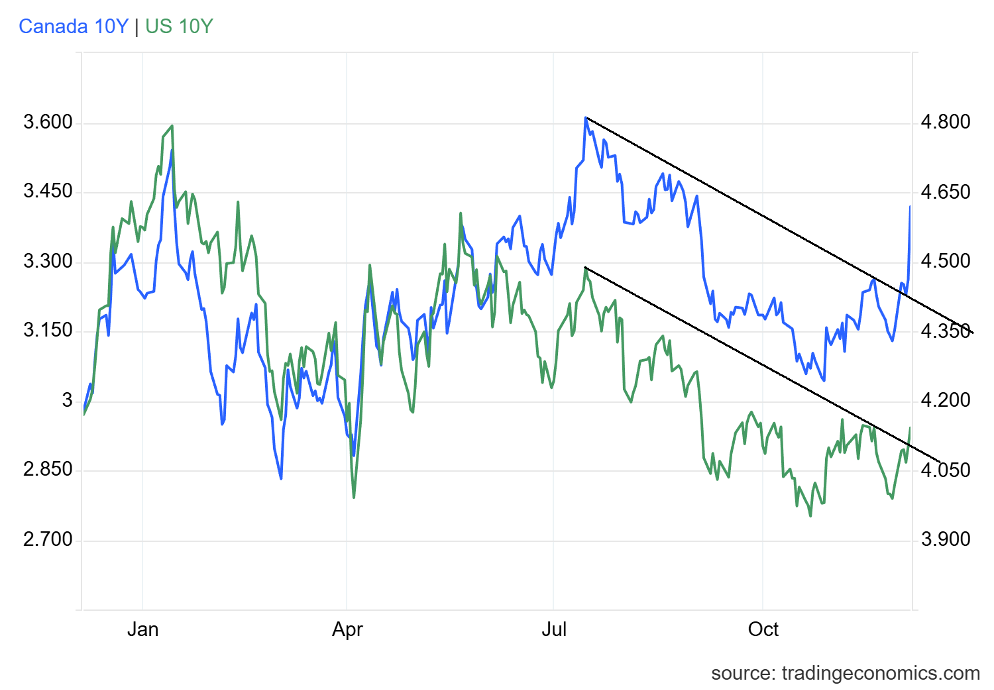
Yikes! Bonds had a terrible week. If there is one area that could upset the apple cart with President Trump, it’s the bond market. Trump may be able to lambaste the Fed for not cutting interest rates more quickly, but that spooks the bond market. The bond market is also spooked by yet another delay in releasing November, let alone October, job numbers. Those numbers are now not expected to be released until December 16th, 2025.
To date, the only job report we can look at is the ADP employment report. The ADP report for private business showed a decline of 32,000 jobs in November vs. an upwardly revised October to a gain of 47,000 jobs and forecasts of a rise of 10,000 jobs. On the other hand, initial weekly claims fell to 191,000 for the last week of November, well below the consensus of 220,000. Hiring may be slowing but firing also seems to be slowing.
Helping push bond yields up was a surge in corporate borrowings. As well, the deficit of the U.S., now approaching $2 trillion, is a growing concern for the market as that means even more government borrowings, which in turn crowds out corporate borrowings. Tariffs aren’t helping and corporations continue to report decent profits, which puts upward pressure on both the stock market and bond yields.
Conflicting economic data and thoughts that after a December rate cut the Fed may be limited in cutting rates further in 2026 helped bond yields rise. Of course, that won’t sit well with Trump. Maybe Hassett will do his bidding. There is the growing pressure, as we have noted, of sharply rising bond yields in Japan. Finally, inflation isn’t coming down, as witnessed by the PCE release (see next).
The U.S. 10-year Treasury note rose 12 bp or 3.0% this past week to 4.14%. In Canada, it was worse as the 10-year Government of Canada bond (CGB) was up 27 bp or 8.6% to 3.42%, thanks to the strong job numbers. The CGB broke out of a clear downtrend and is now headed higher. The U.S. 10-year sits on the cusp of breaking out. Higher treasury rates are bad news for borrowers as corporate bond yields are pushed higher as well as mortgages for consumers.
The 2–10 spreads also rose with the U.S., up to 57 bp from 52 bp, and Canada’s CGB was up to 78 bp from 73 bp. Both are pointing to a potential recession.
PCE Inflation, CPI Inflation, Fed Rate 2015–2025
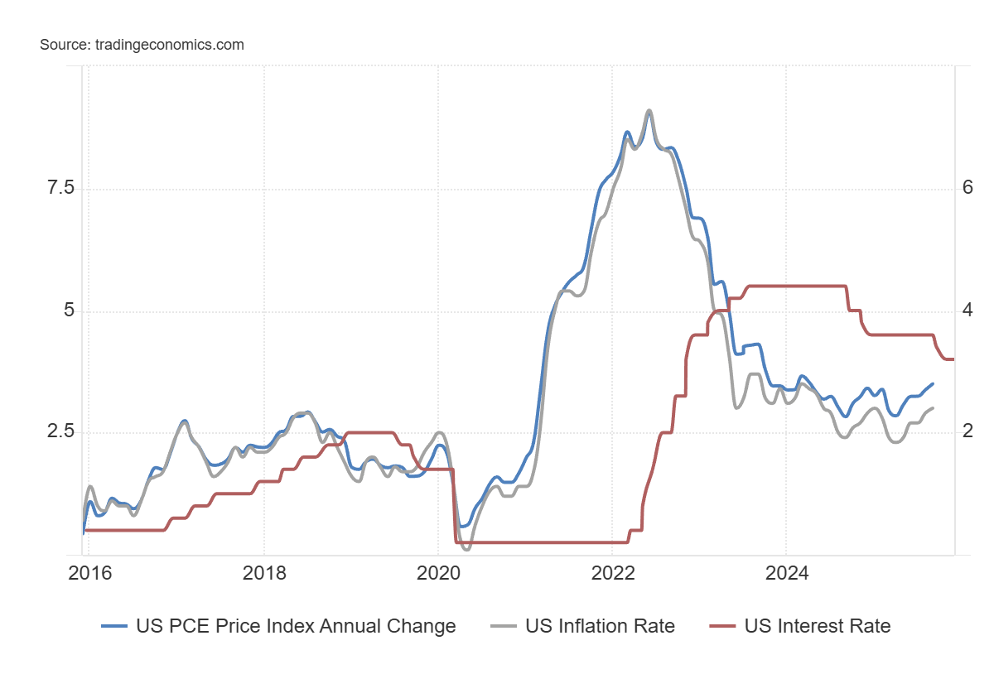
The Fed’s favoured inflation numbers, Personal Consumption Expenditures (PCE) jumped in September to 2.8%. Yes, we’re still awaiting the October numbers, which are not yet available due to the government shutdown. September PCE rose 2.7%. The Fed target rate is 2.0%. That compares to the inflation rate (also in September) of 3.0%. The Fed rate is 4.0%, thus leaving the real rate at 1.0% over CPI and 1.2% over PCE. It continues to be widely expected that the Fed will cut this coming week to 3.75%.
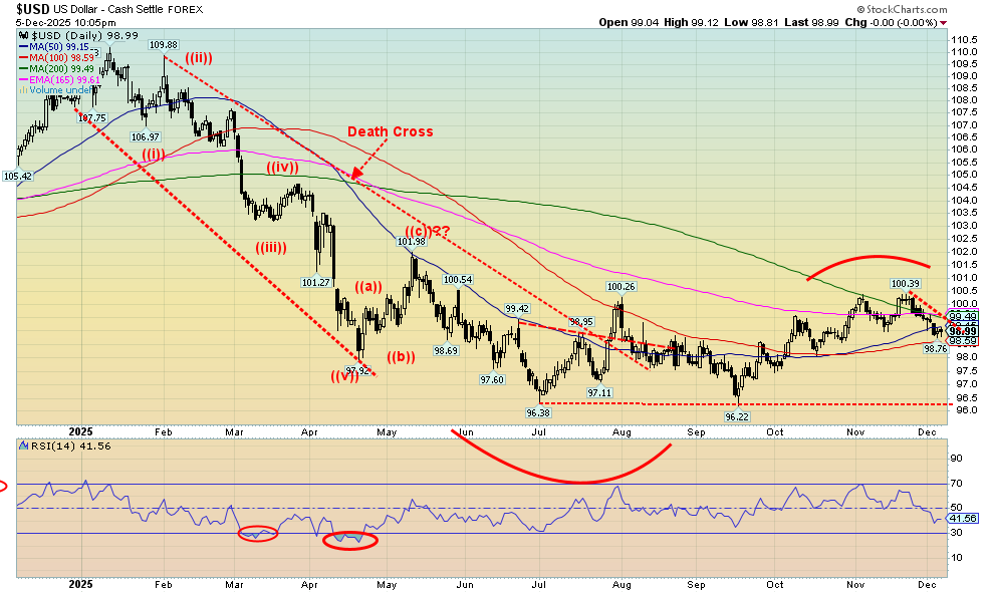
Fears of the Fed cutting interest rates at the December 9–10 FOMC are putting downward pressure on the US$ Index (USDX). The index fell 0.4% this past week while other currencies mostly rose. The euro was up 0.4%, the Swiss franc wobbled and fell about 0.2%, the pound sterling was up 0.8%, while the Japanese yen rose 0.6%. But the big winner on the week was the Cdn$, up 1.0%, thanks to the strong November job numbers.
The uptrend that was in place for USDX now appears to be broken. A breakdown under 98.50 could send USDX lower. That’s positive for gold and precious metals. Under 98 we are definitively headed lower, and under 97.20 new lows below 96.38 are possible. Only new highs above 100.39 can save USDX now.
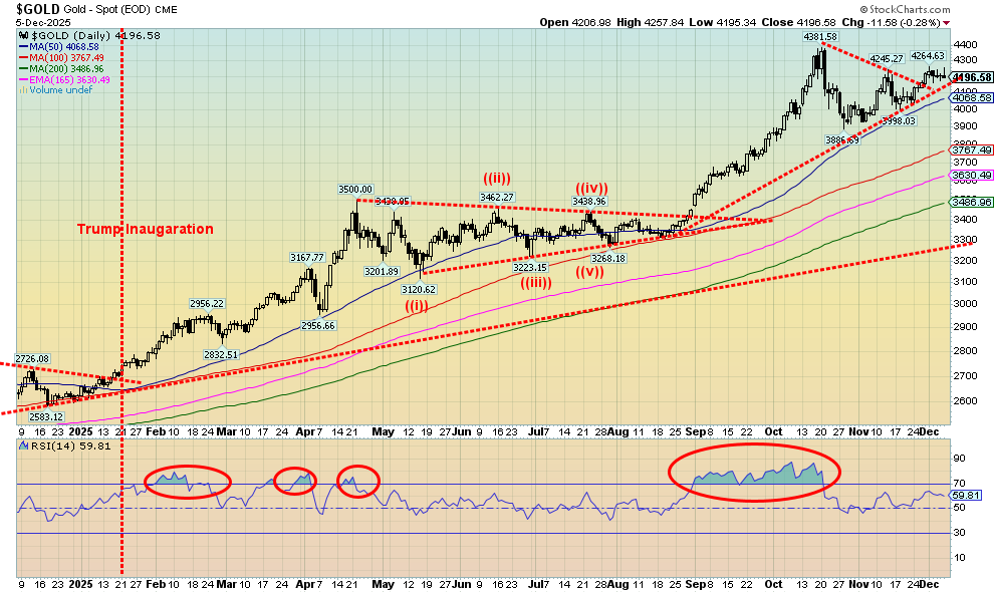
The gold rally of 2025 was put on pause this past week. Overall, gold fell a small 0.5% while silver continued its big run, up 3.5% to new all-time highs. Platinum fell 1.6% while the near precious metals saw palladium rise 1.5% and copper jump 3.5%. The gold stocks were back on their heels with the Gold Bugs Index (HUI) down 2.0% and the TSX Gold Index (TGD) off 3.2%. Still, no one can complain, given that gold is up 58.9% on the year, outpacing most of the other assets. Silver is up 99.5%, now almost doubling.
If there is a concern we have, it is that only silver has been making all-time highs while gold and the gold stocks remain short of new all-time highs. Dow Theory says the averages must agree with each other. While the precious metals are not stock indices, they should all agree with each other all making new all-time highs together. Until that happens, there remains some downside risk. While gold broke out over a small downtrend line and does project up $4,650 or even up to $4,875, we still need to see new highs if we are to realize those targets. A break back under $4,100 would signal trouble and under $4,000 would signal new lows under $3,887.
With high expectations of a Fed interest rate cut this coming week, the pressure is put on the US$ Index while boosting gold. Momentum has also played a role and ongoing purchases from central banks are also putting upward pressure on gold prices. As well, we are seeing increased demand from Chinese insurance companies and India pension funds. Gold is on target for its best year since 1979. That was the year that gold soared from around $215 at the beginning of the year to a high of $835 by January 1980.
A comparable move today would take gold to $7,600. The odds of that happening are low to nil right now. Recommendations to hold gold from the likes of Goldman Sachs and JP Morgan Chase also help demand as more flows into ETFs. The chaos emanating from the Trump presidency doesn’t hurt, either. It creates uncertainty and the U.S. debt just keeps on rising. If one is concerned about the debt, then holding gold is wise.
Seemingly lagging are the junior gold developers, many of which trade on the TSX Venture Exchange (CDNX). Most junior miner indices contain companies that produce, not develop. The best known is the VanEck Junior Gold Miners ETF (GDXJ), up 155% in 2025, thus far outpacing the HUI and TGD. The Sprott Junior Gold Miners ETF (SGDJ) is up 156%. Eric Sprott, the founder, has significant positions in numerous junior gold developers and junior gold producers. Talisker Resource (TSK.TO) leads the pack for returns in 2025, up 390%.
The precious metals have been the place to be in 2025. Will that continue into 2026?
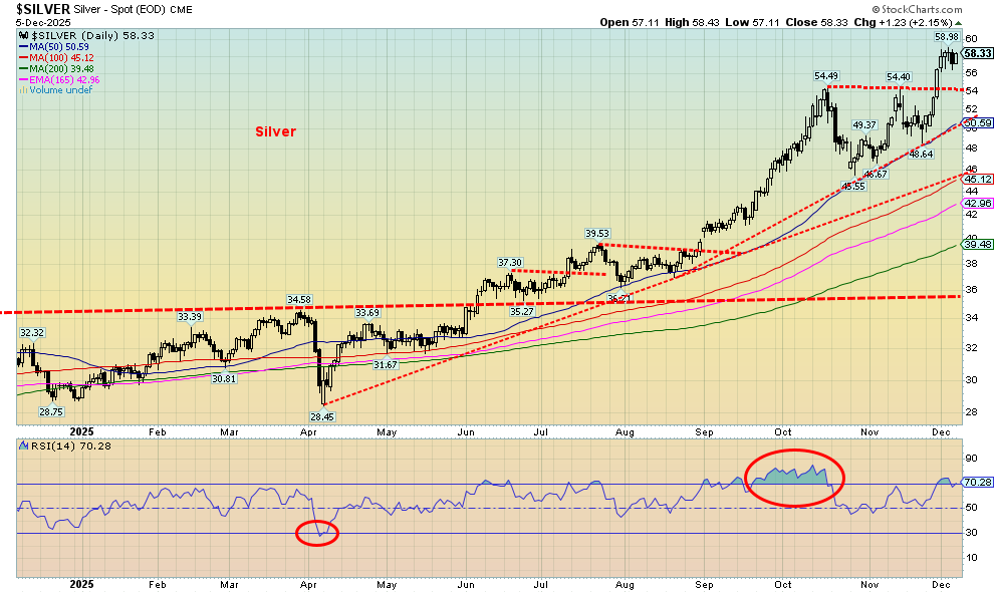
Silver continues its remarkable recent run and once again makes new all-time highs before settling back. On the week, silver jumped 3.5%, far outpacing gold and the gold stocks. Industrial demand and the tightening supply of physical silver have led to the price rise. Can it be maintained? At this stage, the simple answer is yes. Silver broke out of what appeared initially as a potential double top. It failed, telling us we are headed higher. Potential targets are up to $63. Higher targets may exist.
We have been a bit overbought with the RSI poking above 70, but so far nothing like that stretch in September/October where overbought was the norm. The past week has seen a much-needed consolidation. That may continue, but eventually silver should break out and continue its upward journey. What we don’t want to see is it break back under $54 and especially $48.50 as that would signal to us that the uptrend is over. Under $48.50 would signal to us that new lows are possible under $45.55.
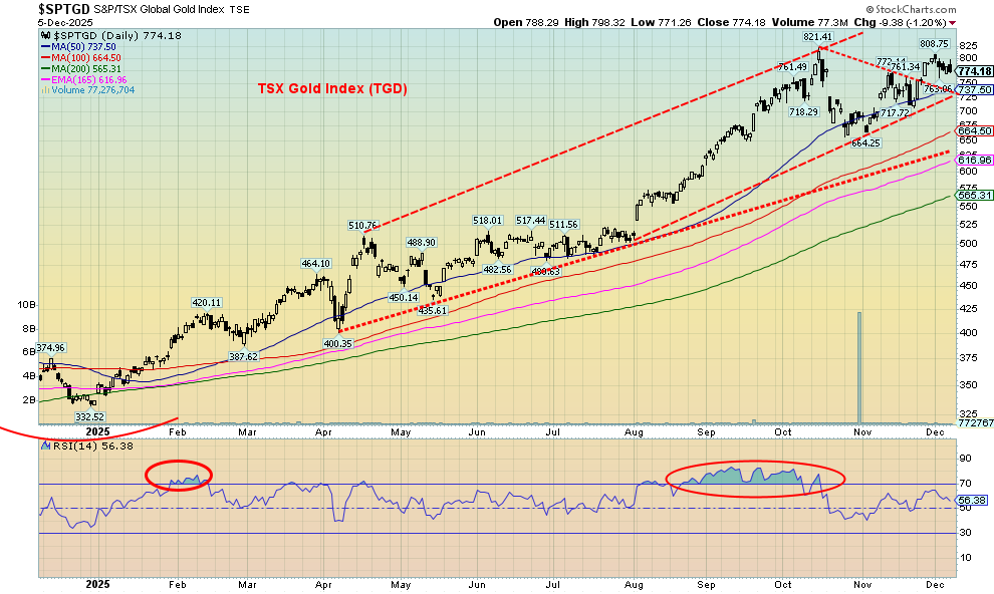
After a strong up week the previous week, it shouldn’t be surprising that the gold stocks paused this past week. The Gold Bugs Index (HUI) fell 2.0% while the TSX Gold Index (TGD) was off 3.2%. Still, no one can complain as the HUI is up almost 141% in 2025 and the TGD is up 129.7% so far in 2025. Amazing returns. Some individual stocks are up even more.
We did break out of a small downtrend with projections for the TGD rising to 900/975. That’s another 16% away. A break back under 725 and especially under 700 would signal we are headed lower. We remain optimistic that the uptrend will continue and guarantee the gold stock indices will have their best year since 1979. With an RSI at 56 we have room to move higher. The negative is that the RSI is currently pointed down. Hence, those breakdown points are important. That said, a breakdown could set in place a low from which a new uptrend could get underway.
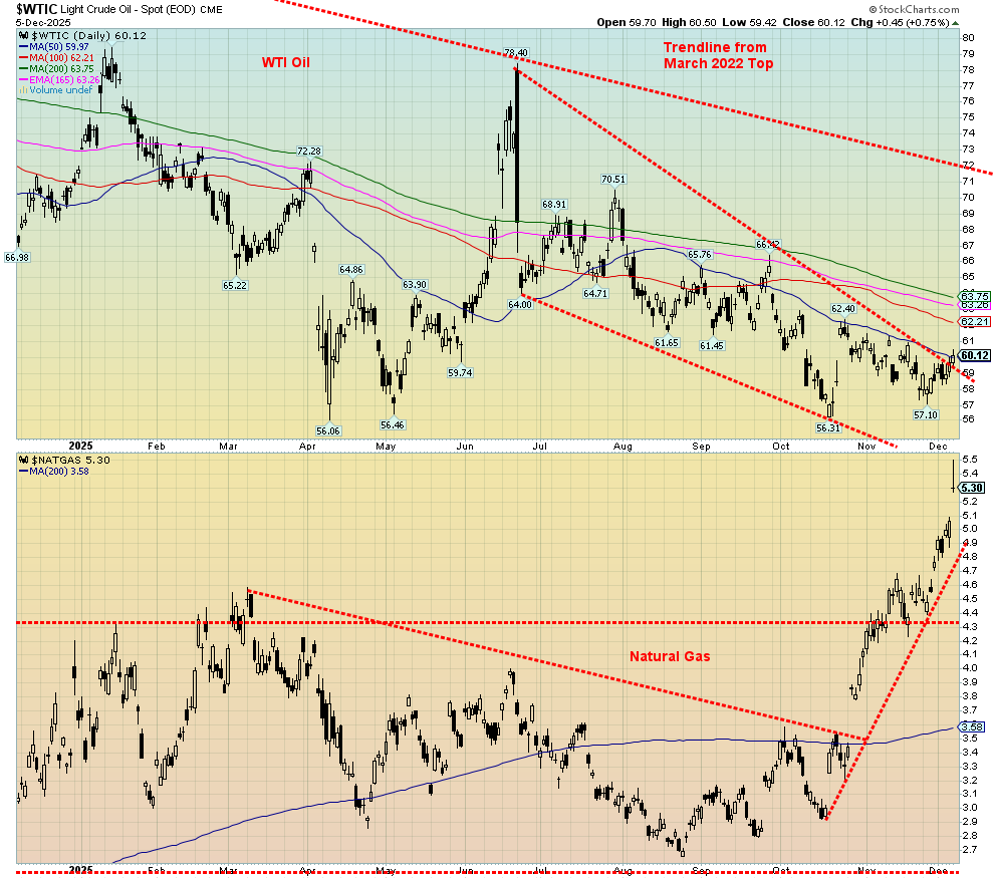
Oil prices can’t get out of the way of themselves. But are they now breaking out? Yes, WTI oil appears to be trying to break over that downtrend line. But the reality is we’d feel a lot better if we took out those earlier highs at $62.40 and $66.24. Otherwise, it is just a wobble. On the negative side, we learned about increased Russian oil exports and there is the ongoing threat by the U.S. to attack Venezuela, holder of the world’s largest oil reserves and the world’s 12th largest oil producer. Despite the claims of taking out a narco president, Maduro, the real reason behind it is the desire to take hold of Venezuela’s oil reserves. It seems that Venezuelan oil fits the refineries of the U.S. better than oil from other sources.
The U.S. may be the world’s largest producer, but much of it goes for export and the U.S. is the world’s largest consumer of oil. Thus, imports remain important and Venezuelan oil is perfect for their refineries that can’t handle other types of oil. The U.S. imported 7.2 million barrels per day (b/d) in 2024 vs. producing 13.4 million b/d, consuming 20.5 million b/d and exporting 3.6 b/d. The U.S. ranks ninth in oil reserves with about 74 billion barrels vs. Venezuela’s 303 billion barrels.
This past week WTI oil rose 1.1%, Brent crude was up 1.0%, natural gas (NG) at the Henry Hub jumped 11.1% to fresh 52-week highs, while NG at the EU Dutch Hub fell 4.8%. Cold weather and ongoing strong demand from the EU drove U.S. demand while warm weather along with thoughts of peace (Russia/Ukraine) weakened the EU’s demand. The ARCA Oil and Gas Index (XOI) rose 1.1% while Canada’s TSX Energy Index (TEN) was up 0.3%. Comparatively, oil stocks are outpacing oil itself.
NG gapped higher on Friday. Now there is a nice gap between $5.30 and $5.10 to potentially fill. Or is this a breakaway gap that won’t be filled and NG keeps moving higher? NG has a steep uptrend and is overbought.
But, as usual, the focus is always on oil, less so on NG. The U.S. needs to replace its stocks as both crude oil and gasoline stocks are hovering near or just above 5-year lows. That could be positive for oil prices.
__
(Featured image by Juan Carlos Ramirez via Unsplash)
DISCLAIMER: This article was written by a third party contributor and does not reflect the opinion of Born2Invest, its management, staff or its associates. Please review our disclaimer for more information.
This article may include forward-looking statements. These forward-looking statements generally are identified by the words “believe,” “project,” “estimate,” “become,” “plan,” “will,” and similar expressions, including with regards to potential earnings in the Empire Flippers affiliate program. These forward-looking statements involve known and unknown risks as well as uncertainties, including those discussed in the following cautionary statements and elsewhere in this article and on this site. Although the Company may believe that its expectations are based on reasonable assumptions, the actual results that the Company may achieve may differ materially from any forward-looking statements, which reflect the opinions of the management of the Company only as of the date hereof. Additionally, please make sure to read these important disclosures.
Copyright David Chapman 2025
David Chapman is not a registered advisory service and is not an exempt market dealer (EMD) nor a licensed financial advisor. He does not and cannot give individualised market advice. David Chapman has worked in the financial industry for over 40 years including large financial corporations, banks, and investment dealers. The information in this newsletter is intended only for informational and educational purposes. It should not be construed as an offer, a solicitation of an offer or sale of any security. Every effort is made to provide accurate and complete information.
However, we cannot guarantee that there will be no errors. We make no claims, promises or guarantees about the accuracy, completeness, or adequacy of the contents of this commentary and expressly disclaim liability for errors and omissions in the contents of this commentary. David Chapman will always use his best efforts to ensure the accuracy and timeliness of all information. The reader assumes all risk when trading in securities and David Chapman advises consulting a licensed professional financial advisor or portfolio manager such as Enriched Investing Incorporated before proceeding with any trade or idea presented in this newsletter.
David Chapman may own shares in companies mentioned in this newsletter. Before making an investment, prospective investors should review each security’s offering documents which summarize the objectives, fees, expenses and associated risks. David Chapman shares his ideas and opinions for informational and educational purposes only and expects the reader to perform due diligence before considering a position in any security. That includes consulting with your own licensed professional financial advisor such as Enriched Investing Incorporated. Performance is not guaranteed, values change frequently, and past performance may not be repeated.


Bank Al-Maghrib Launches Reforms to Boost Credit via Non-Performing Loan Market
Bank Al-Maghrib is advancing a secondary market for non-performing loans to free bank financing and boost credit. With Moroccan NPLs...


Cyberpunk Trading Card Game Surges Past Goals on Kickstarter
The Cyberpunk Trading Card Game crowdfunding campaign has seen massive success, quickly surpassing its initial goal and raising over 12...


Aurora Shifts Strategy Toward Global Medical Cannabis Markets
In March 2026, Aurora exited the recreational cannabis market to focus on higher-margin global medical cannabis. With 81% of revenue...


SPECT-CT: Advanced Imaging for Precise Cardiac Assessment
SPECT-CT is a key cardiac imaging technique that evaluates blood flow to heart muscle, identifying reduced perfusion and prior damage....


Blockchain Adoption Accelerates as SwissChain and Amundi Launch Tokenized Financial Solutions
SwissChain Holding SA has digitized its share certificates using blockchain, improving transparency, efficiency, and ownership tracking while maintaining Swiss legal...
 |
|
 |  |
 |
|
-

 Impact Investing1 week ago
Antarctica Warming Reshapes Global Atmospheric Circulation
-

 Crowdfunding2 weeks ago
Rendity Crowdfunding Platform Shuts Down Amid Rising Investor Problems
-

 Business3 days ago
Anemic Labor Market and the End of Passive Money Flows
-

 Business2 weeks ago
The TopRanked.io Weekly Digest: What’s Hot in Affiliate Marketing [PureVPN Affiliate Program Review]