Markets
Markets Surge on Trump Victory—But Can Overvaluation and Recession Risks Stall the Rally?
Following the election of Trump the stock markets soared, the US$ Index soared, interest rate yields rose then fell back, gold and the metals sold off while oil was mixed. Numerous all-time highs were seen in stock market indices. But the stock market is already overvalued. Can it be sustained? We continue to see the economy as teetering on the edge of a potential recession even as the U.S. economy has been the strongest in the developed world.

Trump wins. Now what?
Admittedly, when writing about the potential impact of Trump presidency, it is difficult to write what hasn’t already been written. We say potentially because, technically, he doesn’t take over until January 20, 2025 at the inauguration. Trump never conceded the 2020 election. However, Harris and the Democrats have conceded, saving the agony of a drawn-out legal battle.
Our concern in The Scoop is economic. Irrespective of this, the U.S. remains a deeply divided country. Those divisions are not about to go away tomorrow, and that too has potentially negative economic implications. First, let’s go back to the first Trump election in 2016. The claim has been what a great economy Trump’s four years were. Our table on the following page summarizes it.
While there are many more indicators we could list, these are the key ones. Noteworthy was that GDP was sluggish while the U.S. deficit soared. Primarily because of the pandemic that officially began in March 2020. Unemployment soared, interest rates fell, money supply exploded, the Fed’s balance sheet exploded, the US$ Index fell, the stock market and gold soared after initially falling, and house prices soared. But, given oodles of money (quantitative easing QE), ultra-low interest rates, and soaring money supply, it laid the foundation for the rise of inflation in 2021. It wasn’t the only reason inflation soared with supply disruptions playing a big role.
It also helped spark the sharp rise in stocks, gold, and house prices. The U.S. economy recovered and became the envy of the developed world. The unemployment rate (U3) came down sharply and hit its trough in April 2023 at 3.4% (currently 4.1%) after peaking at 14.9% in April 2020. Despite tariffs, the U.S. trade deficit rose from $46.6 billion in January 2016 to $62.0 billion in December 2020. That was just a pause and by March 22 it soared to $102 billion. It improved after that but now as started go down once again. The poverty rate fell from 2016 to 2020 by 15%, possibly helped by all the government payments to deal with the pandemic.
The U.S. federal debt soared from $21 trillion in 2016 to $29 trillion by 2020. Today it is $36 trillion and expected to reach $50 trillion by 2028. The U.S. budget deficit, which was $0.90 trillion in 2016, soared to $2.79 trillion by 2020. Today it is $2.19 trillion and expected to soar to $4.67 trillion by 2028. Debt to GDP, which was 108%, leaped to 123.5% by 2020. Today it is 122.8% and is estimated to climb to 156.7% by 2028. According to forecasts based on a Trump win.
At best, the Trump years economically were mixed, with the most significant being the massive growth in the U.S. debt, primarily because of the tax cuts and the pandemic. The U.S federal debt is up $6.9 trillion since December 2020 and is expected to soar another $14 trillion from 2024 to 2028. We believe that is an unsustainable pace.
Trump Record 2017–2020
| Indicator | Change |
| GDP Q4 2016–Q4 2020 | +$2,979 billion or +15.6% |
| Federal debt | +7,771 billion or +39% |
| Unemployment rate U3 Dec 2016–Dec 2020 | Dec 2016: 4.7% Dec 2020: 6.7% +42.6% |
| Unemployment rate U6 Dec 2016–Dec 2020 | Dec 2016: 9.2% Dec 2020: 11.7% +27.1% |
| Stock market SPX Dec 2016–Dec 2020 | +67.8% |
| Gold Dec 2016–Dec 2020 | +64.5% |
| Retail sales Dec 2016–Dec 2020 | +20% |
| Home owners’ equity in real estate | +45% |
| Fed balance sheet assets | +65% |
| Budget deficit 2016–2020 | $0.90 – $2.79 billion or 310% |
| Inflation Dec 2016–Dec 2020 | +8.2% |
| Fed funds rate Dec 2016–Dec 2020 | Dec 2016: 0.29% Dec 2020: 0.10% |
| 10-Year Treasury note yield Dec 2016–Dec 2020 | 2.35% vs. 0.94% |
| 30-year mortgage rate | Dec 2016: 4.32% Dec 2020: 2.67% |
| US$ Index Dec 2016–Dec 2020 | Dec 2016: 102.29 Dec 2020: 89.92 (12.1%) |
| Money supply M1 M2 | M1 +532% M2 +45% |
| Trade deficit 2017-2020 | Jan 2017: $46.6 billion Dec 2020: $62.0 billion |
| Poverty rate | 2016: 14% 2020: 11.9% |
| Debt to GDP % | 2016: 108.0% 2020: 123.5% |
So, what are we to expect from a second Trump presidency? And what could be the impact on the stock market, the economy, gold, interest rates, the U.S. dollar, and, the global economy? We will not delve into the geopolitical or domestic political aspects. For the latter, the country remains very divided. Geopolitically, the wars still rage on.
The first thing on everyone’s lips is the threat to impose tariffs on the world. First off, it’s 10% on imports from anywhere in the world. Even 20% has been mentioned. Second, additional tariffs on China to bring it to 60%. Some say this is just an opening salvo to get a deal. Global trade is already re-trenching. Additional tariffs could spark further retrenchment. Retaliation tariffs are very likely, which would cause global trade to re-trench further. The relevance of the World Trade Organization (WTO) is becoming increasingly irrelevant.
What it all means is that exports could slow considerably. The customer winds up paying the bill for the tariffs with increased prices. Irrespective of this, it also weighs on public finances. Thus, it is potentially inflationary. Walmart, plus numerous other retailers, rely heavily on goods from China. Apple does as well, plus numerous other corporations. “Beggar thy neighbour” policies redux?
The fall of world trade and protectionism is bad for the global economy. Gold could benefit from a global trade war as it did in the 1930s. While at that time gold was fixed, companies such as Homestake Mining (now part of Barrick Gold) benefitted; while the Dow Jones Industrials (DJI) was falling 89%, Homestake rose over 400%.
Besides the impact on China, the world’s largest exporter, tariffs will negatively impact Mexico and Canada. The U.S./Mexico/Canada trade agreement USMCA is up for review by 2026. However, Trump has threatened to tear it up right away. Collapse of the trade agreement would have a huge negative impact on both Canada and Mexico, potentially costing their economies dearly. Mexico would suffer the most. Add in Trump’s threats to close the U.S. Mexico border and the potential impact on Mexico becomes even worse. Trade policy could also negatively impact foreign policy as tensions rise between countries and the U.S.
Trump has promised to deregulate all sorts of things from climate and environmental laws to banking and cryptocurrency. His promise to make the U.S. the crypto capital of the world already sparked a huge rally for Bitcoin, which hit a record high. Deregulation in the oil and gas industry would be positive for oil and gas stocks, but potentially very harmful to the environment that is already being battered by severe storms, wildfires and more due to climate change. Green energy would take a serious hit. The result is that things might actually get worse on the climate side.
While banks rejoiced at the thoughts of deregulation in the banking sector, frameworks like Basel III could be in trouble. Basel III was designed to strengthen banks’ ability to withstand financial shocks. It was to come into effect January 1, 2025. If the U.S. pulled out it would probably collapse.
Trump has promised huge tax cuts for corporations plus general tax cuts. When he did this in 2017, we saw the stock market soar but the windfall from the tax cuts was very uneven and benefitted primarily corporations and the wealthy. The result was that inequality rose. It also added trillions to the U.S. debt and the U.S. budget deficit. By the end of Trump’s first term, U.S. federal debt to GDP leaped to almost 130%. Further tax cuts could add substantially to the debt, put pressure on the U.S. bond market, and raise inflation, forcing the Fed to hike rates instead of cutting.
Inflation didn’t go up much the first time, but we are starting now from a much higher base where the stock market is already overvalued by numerous methods, interest rates are also high compared to 2017, and the debt is considerably higher, as is the debt/GDP. The initial reaction might be positive, but in the longer term it could cause severe problems. The 2017 tax cuts would not only continue, but his policies would add substantially to the debt and deficit without potential huge cuts to programs.
It is noteworthy that the U.S. spending totals about $7.2 trillion. Four items, Medicare, Social Security, Defense and Interest on the debt make up 5.2 trillion or 72% of spending. Mostly they can’t be cut.
One area of concern is Trump’s desire to control the Federal Reserve. If that happened, it could have profound negative impact on global finances. The Fed is the leading central bank in the world. Attempts to control it would send an extremely negative signal to the rest of the world. As a worst case, it could result in a sell-off of U.S. treasuries and the U.S. dollar, and it could hike interest rates substantially, crashing the U.S. economy and probably the rest of the world as well. But gold would benefit.
Immigration was a major item during the election. Trump has threatened to expel upwards of 11 million illegal immigrants. Initially they would be held in internment camps. The estimated cost of this operation is up to $1 trillion. But many, most of these illegals also hold jobs in the U.S. The resultant impact on the U.S. economy especially agriculture could be quite negative. So called “Dreamers” could also be rounded up irrespective that they were born in the U.S. and hold jobs many of them in American corporations and governments. He has also threatened to fire up to 85% of U.S. government employees a move that could possibly result in the shutdown of government. Who would send out the Social Security cheques?
Our summary only touches the economic issues, leaving many others in abeyance. Nonetheless, our conclusion from Trump’s potential policies is that it could have a profound impact on economic growth in the U.S. and globally, force up interest rates, and add to the already huge debt, and severely damage international relations.
It’s 2024, not 2016. The stock market is grossly overvalued compared to 2016. In 2016, the Shiller PE was 28.7; today it is 38.1, the second highest on record but below the record seen in 1999. In 2007, before the 2008 financial crisis, it was lower than today. Price to book is 5.25 vs 2.9 in 2016. The debt today is $36 trillion, not $21 trillion. The debt to GDP is 123% not 108%.
Interest rates were lower. The Fed rate in early 2017 was 0.75%. Today it is 4.75%. The 10-year was 2.32%, not 4.32%. The inflation rate might be the closest at 2.4% vs 2.1% in early 2017. We noted the trade deficit is higher today than in 2016. In January 2017 it was $43.6 billion. The latest report showed the trade deficit in September 2024 at $84.4 billion. The Michigan Consumer Confidence Index was 98.5 vs. 70.5 today. Annual GDP growth in 2016 was 2.2% (Q4) vs. 2.7% (Q3) today. The unemployment rate in Jan 2017 was 4.7% and falling. Today it is 4.1% and rising. We could go on. The divisions in the country were a lot lower in 2017. Finally, there were no wars to speak of in 2016. Today we have the Russia/Ukraine conflict and the very serious conflict in the Middle East. No one talks about the conflict in Sudan.
The difference in today’s reality vs. that in 2017 is considerable. Yet policies similar to the earlier period are being touted such as tax cuts and tariffs. Worse, proposals to deport millions of illegals and fire government workers could result in huge negative costs to the economy. But the most interesting one for the financial world is a potential brawl between the Fed and the White House which in turn could have a negative impact on the bond market, interest rates, and the U.S. dollar. No, it’s different today. What worked then may not be so successful today. It could be a challenging four years. But one of the major beneficiaries could be gold as the U.S. dollar falls, the U.S. treasury market falls, and the overvalued U.S. stock market falls.
“Most of all, it means the global policymaking environment will become more uncertain. In this sense, the world has changed.”—Neil Shearing, Chief Economist, Capital Economics
Chart of the week: Price Performance 2017–2024
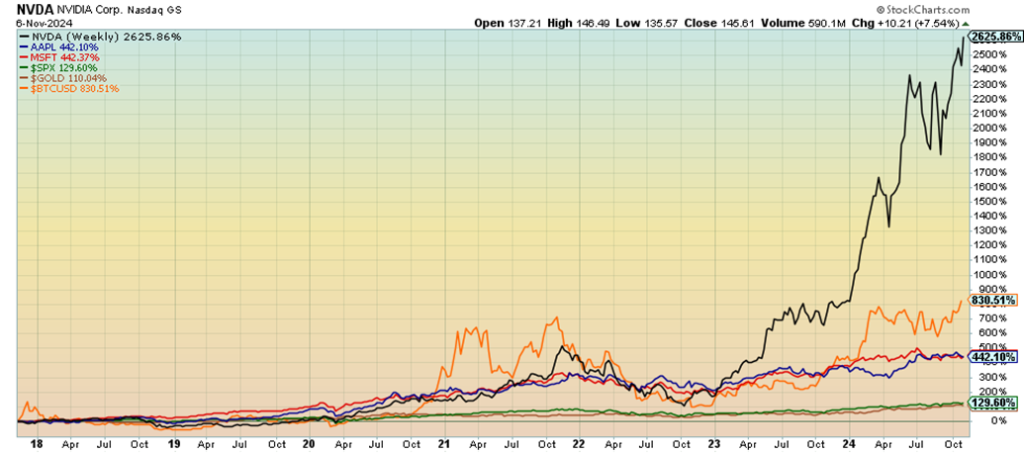
It has been a miraculous ride. We now have three $4 trillion dollar companies: Nvidia (NVDA), Apple (AAPL), and Microsoft (MSFT). Yes, $4 trillion. Since 2017, NVDA is up 2625%, Apple up 442%, and Microsoft up 442% as well. The S&P 500 is up 130% and gold up 110%. It’s actually mindboggling as that means the three companies are actually larger than the third, fourth, and fifth largest economies in the world. Our table below shows the three are bigger than Germany, Japan, and India. They are bigger as the combined market cap of the three exceeds the GDP of the three countries by almost $1.5 trillion. With that kind of size, one could argue that they have tremendous influence, not only on the global economy but also on the U.S. and the rest of world as well.
| Corporation | Market Cap | Country | GDP (2023) |
| Nvidia (NVDA) | $4.496 trillion | Germany | $4.456 trillion |
| Apple (AAPL) | $4.675 trillion | Japan | $4,213 trillion |
| Microsoft (MSFT) | $4.338 trillion | India | $3,350 trillion |
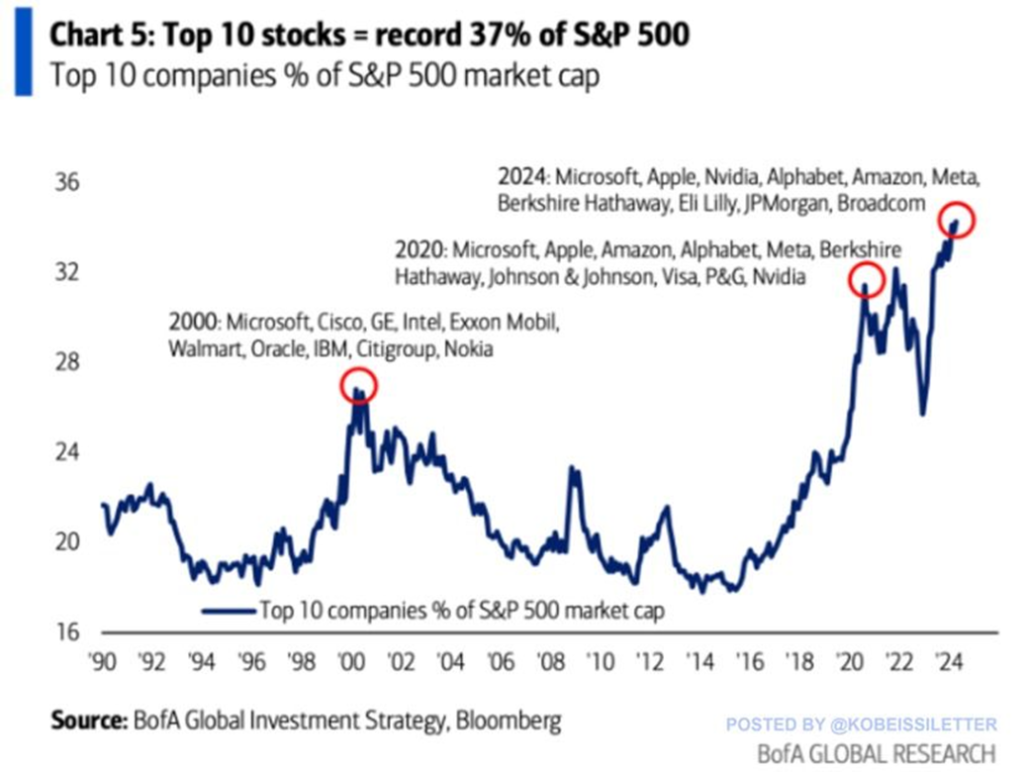
Interestingly enough, we found a chart that shows how much room the 10 largest companies take up in the S&P 500. It’s an astounding record of currently 37%. The concentration is concerning. It is the highest level ever and exceeds the high levels before the dot.com/high-tech crash of 2000–2002 and the global financial crisis of 2007–2009. What hits heights like those also could come crashing down faster than it went up. It’s a warning sign.
Markets & Trends
| % Gains (Losses) Trends | ||||||||
| Close Dec 31/23 | Close Nov 8, 2024 | Week | YTD | Daily (Short Term) | Weekly (Intermediate) | Monthly (Long Term) | ||
| Stock Market Indices | ||||||||
| S&P 500 | 4,769.83 | 5,995.54 (new highs)* | 4.7% | 25.7% | up | up | up | |
| Dow Jones Industrials | 37,689.54 | 43,988.99 (new highs)* | 4.6% | 16.7% | up | up | up | |
| Dow Jones Transport | 15,898.85 | 17,353.94 (new highs) | 6.1% | 9.2% | up | up | up | |
| NASDAQ | 15,011.35 | 19,286.98 (new highs)* | 5.7% | 28.5% | up | up | up | |
| S&P/TSX Composite | 20,958.54 | 24,759.40 | 2.1% | 18.1% | up | up | up | |
| S&P/TSX Venture (CDNX) | 552.90 | 609.24 | 0.9% | 10.2% | up (weak) | up | down (weak) | |
| S&P 600 (small) | 1,318.26 | 1,508.36 (new highs)* | 8.6% | 14.4% | up | up | up | |
| MSCI World | 2,260.96 | 2,380.69 | 0.1% | 5.3% | down | up | up | |
| Bitcoin | 41,987.29 | 76,705.92 (new highs)* | 10.8% | 82.7% | up | up | up | |
| Gold Mining Stock Indices | ||||||||
| Gold Bugs Index (HUI) | 243.31 | 311.99 | (1.7)% | 28.2% | down | up | up | |
| TSX Gold Index (TGD) | 284.56 | 369.83 | (1.9)% | 30.0% | neutral | up | up | |
| % | ||||||||
| U.S. 10-Year Treasury Bond yield | 3.87% | 4.31% | (1.8)% | 11.4% | ||||
| Cdn. 10-Year Bond CGB yield | 3.11% | 3.21.% | (3.0)% | 3.2% | ||||
| Recession Watch Spreads | ||||||||
| U.S. 2-year 10-year Treasury spread | (0.38)% | 0.05% | (70.6)% | 113.2% | ||||
| Cdn 2-year 10-year CGB spread | (0.78)% | 0.10% | (44.4)% | 112.8% | ||||
| Currencies | ||||||||
| US$ Index | 101.03 | 104.95 | 0.6% | 3.9% | up | up (weak) | neutral | |
| Canadian $ | 75.60 | 71.89 | 0.4% | (4.9)% | down | down | down | |
| Euro | 110.36 | 107.20 | (1.0)% | (2.9)% | down | down | neutral | |
| Swiss Franc | 118.84 | 114.21 | (0.5)% | (3.9)% | down | up (weak) | up | |
| British Pound | 127.31 | 129.22 | flat | 1.5% | down | up (weak) | up | |
| Japanese Yen | 70.91 | 65.57 | 0.4% | (7.5)% | down | neutral | down | |
| Precious Metals | ||||||||
| Gold | 2,071.80 | 2,694.80 | (2.0)% | 30.0% | neutral | up | up | |
| Silver | 24.09 | 31.45 | (3.8)% | 30.6% | down (weak) | up | up | |
| Platinum | 1,023.20 | 978.50 | (2.4)% | (4.4)% | down (weak) | up | up | |
| Base Metals | ||||||||
| Palladium | 1,140.20 | 992.20 | (10.5)% | (13.0)% | down | up | down | |
| Copper | 3.89 | 4.31 | (1.4)% | 10.8% | down (weak) | up (weak) | up | |
| Energy | ||||||||
| WTI Oil | 71.70 | 70.38 | 1.3% | (1.9)% | up (weak) | down | down | |
| Nat Gas | 2.56 | 2.67 | 0.4% | 4.3% | neutral | up | down (weak) | |
What a week. The election of President Trump sent stock markets soaring. Okay, not all. The promise of tax cuts, deregulation, drill, drill, drill, a push for lower interest rates, and even the potential for budget cuts was music to Wall Street. Everybody leaped to new all-time highs. Okay, not everybody.
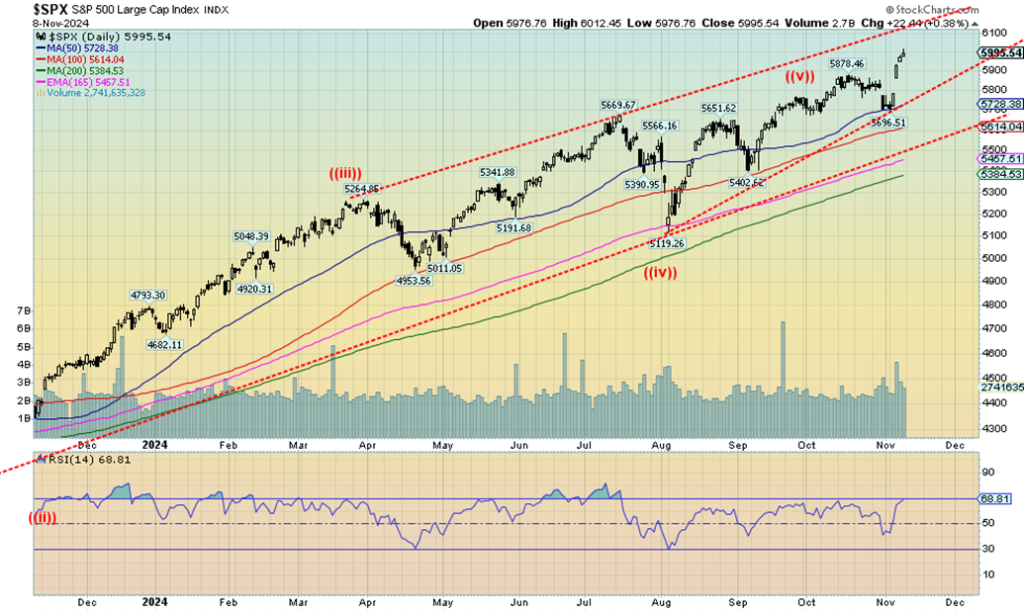
On the week, the S&P 500 (SPX) was up 4.7%, the Dow Jones Industrials (DJI) gained 4.6%, the Dow Jones Transportations made new highs but not all-time highs, up 6.1%, while the NASDAQ was up 5.7%. The DJT continues to diverge from the DJI given the DJI is at record highs while the DJT remains well below its record high. Even the junior indices gained as the S&P 400 (Mid) and the S&P 600 (Small) made all-time highs, up 6.3% and 8.6%. Trump’s proposals are good for small caps. Others making all-time highs were the S&P 100 (OEX), the Dow Jones Composite (DJC), the NYSE, the Wilshire 5000, and all the Russell’s 1000, 2000, 3000. Happy days are here again. Bitcoin soared to new all-time highs with Trump’s promise of making the U.S. the crypto capital. On the weekend Bitcoin surpassed $80,000. The S&P 500 Equal Weight Index was up 4.3% to new all-time highs while Berkshire Hathaway gained 2.6%. Buffett is sitting on an astounding $325 billion of cash. Smart money getting out?
Okay, all this elation is coming at a top in an already overvalued market. What could go wrong? In Canada, the TSX composite did not make fresh highs but was up 2.1%. The TSX Venture Exchange (CDNX) was up 0.9%. In the EU, the London FTSE fell 1.0% as did the Paris CAC 40, the EuroNext was down 1.2%, while the German DAX held up.
In Asia, for whatever reason, China’s Shanghai Index (SSEC) jumped on Trump’s election, up 5.5%, the Tokyo Nikkei Dow (TKN) gained 3.8%, while Hong Kong’s Hang Seng (HSI) gained 1.4%. The MSCI World Index was up only 0.1%. The EU was down but Asia up. China was elated with the new bailout package of $1.1 trillion.
Milestones were hit: 6,000 for the SPX and 44,000 for the DJI. Usually, these key numbers see a correction take place. The first break point for the SPX is at 5,700. The next one is at 5,400 and the final one at 5,100. Indicators are diverging with previous highs. Divergences are seen across most time frames, particularly the dailies (short term) and weeklies (intermediate term). The NASDAQ is diverging on all time frames.
Too many negative divergences, overvaluation, and complacency and greed driving the market all tell us we’re starting from a high, not a low, and the market will eventually fail. This coming week will be interesting. Can we follow through?
Shiller PE Ratio 1870–2024
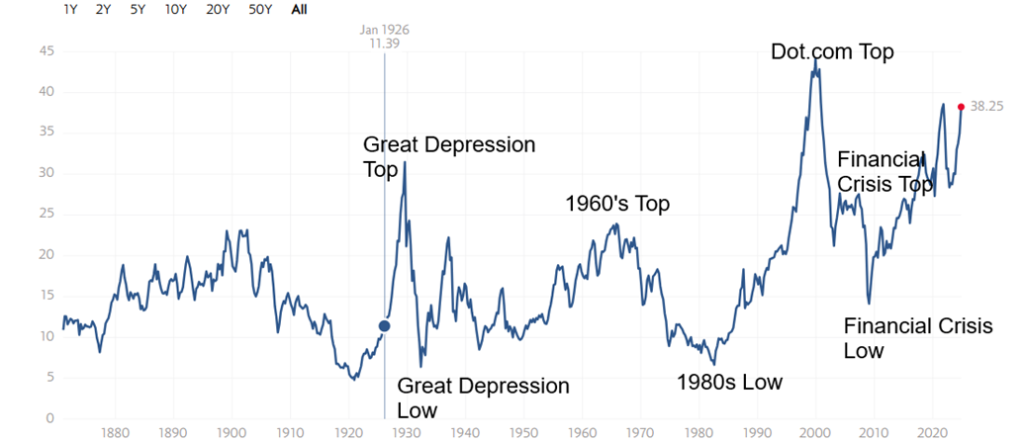
The Shiller PE Ratio is at its highest level since the dot.com top of 1999–2000, another sign of overvaluation in the stock market.
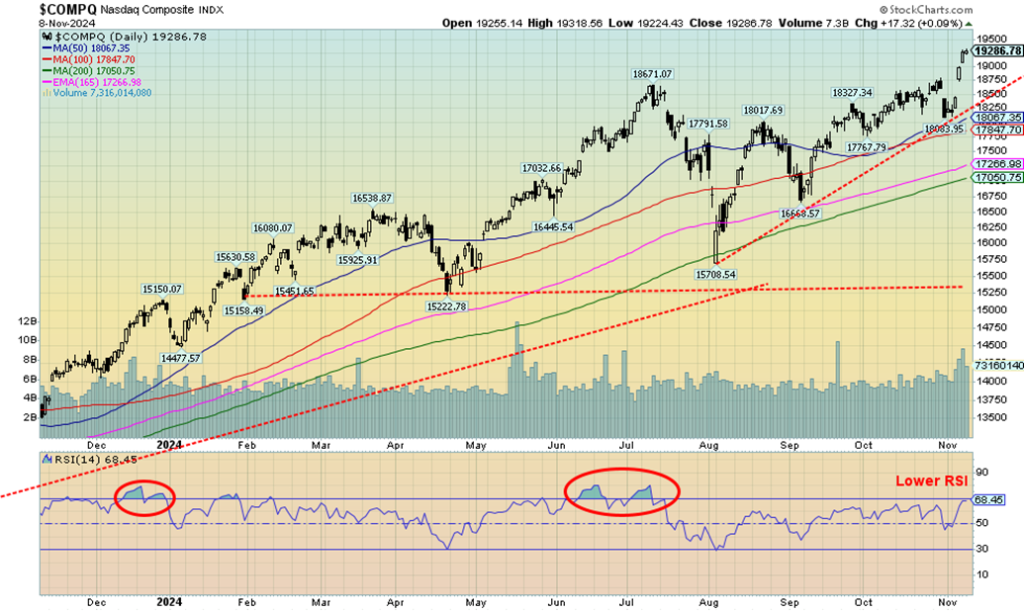
The NASDAQ celebrated the election of Trump this past week by jumping 5.7% to new all-time highs. So did its sister the NASDAQ 100 and the NY FANG Index. Amongst the FAANGs or MAG7, Amazon, Netflix, and Nvidia all jumped to new all-time highs. Tesla leaped 29% while Amazon, Netflix, and Broadcom all were up over 5%. Oh, there were losers too as the Chinese stocks Baidu and Alibaba were both down this past week. But the big winner was Tesla and Elon Musk as he most likely bought his way to a powerful position in Trump’s cabinet. A celebrity capitalist with his hands on the levers of government? What could go wrong?
Despite the leap, the NASDAQ is quickly becoming overbought again, but it is diverging from earlier highs—meaning, we are getting lower highs (see the RSI) on a host of indicators but higher levels for the NASDAQ. A classic divergence. The divergences are also showing up on the weekly and monthly charts. When we see that, we know a fall is coming, even if we still can’t predict when. With 18,000/18,100 now being support, a break of that level could signal a possible top. Under 17,750 would be the next key point, then finally 16,675. Below 15,700 it’s all over. They are warning signs and not a guarantee we would break down.
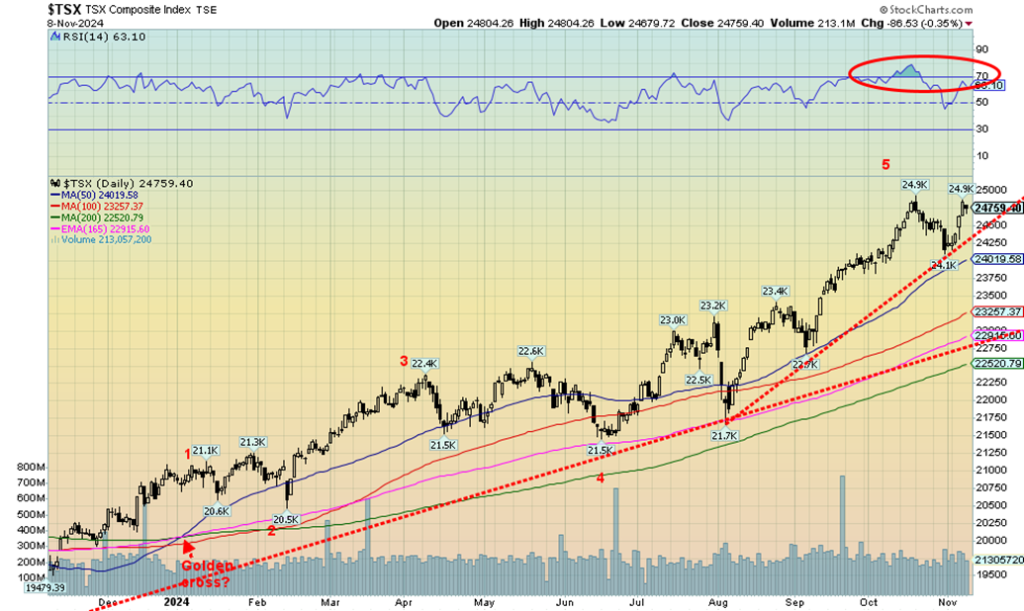
The TSX had an up week like the U.S. stock indices, with one notable difference. The TSX did not make new all-time highs, falling just short. Still, the TSX gained 2.1%. The junior TSX Venture Exchange (CDNX) struggled, but closed the week up 0.9%. Both are up on the year, 18.1% and 10.2% respectively. On the week, nine of the 14 sub-indices were up. Two made all-time highs (Financials TFS +3.1%, Information Technology TKK +5.8%) while one made 52-week highs before tumbling negative (Health Care -3.6%). Leading the up parade was the previously mentioned Information Technology TKK, followed by Consumer Staples TCS +3.2% and the Financials TFS.
The downs were led by Health Care THC and Telecommunications TTS -3.6% (Thanks, BCE). THC had a big reversal and may have topped. Golds TGD, Mining & Metals TGM, and Materials TMT were all down 1.9%, 0.7%, and 1.4% respectively. Notably, the RSI for the TSX is diverging with the previous high. New highs for the TSX might take away the divergence. The TSX breaks down under 24,250 and under 24,000. Major long-term support is at 22,500–22,900. The trend remains up, although a break under 24,100 could start to change that and give us our first sign of a potential top.
Canada Employment Change vs. Unemployment Rate 2019–2024
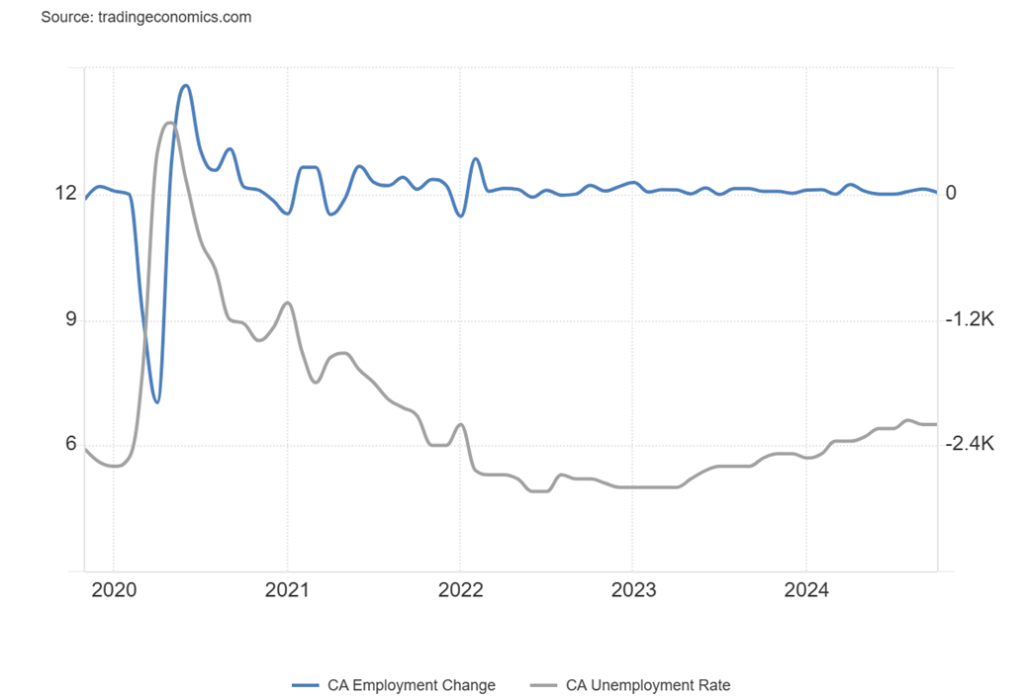
Canada’s employment grew by 14,5000 in October but it was below the estimate of 25,000 jobs. Grant you, this report came off of the better than expected September jobs report that saw 46,700 created. Encouragingly, the report shows that 25,600 full-time jobs were created vs. a loss of 11,200 part-time jobs. It continues to show a decent jobs market in Canada.
The unemployment rate was unchanged at 6.5%. The labour force participation rate dipped to 64.8% from 64.9%. The R8 unemployment rate that includes discouraged workers and waiting part-timers was also unchanged at 7.9%. We suppose the good news for everyone was that average hourly wages were up year over year (y-o-y) by 4.9% when they had expected a gain of only 4.4%.
The falling participation rate reflects fewer students looking for jobs and more retirees. The population employment ratio also slipped 0.1% to 60.6%. Many now expect that the BofC could cut rates 50 bp in December. Nonetheless, while the report was weaker than expected, it still shows Canada’s economy adding jobs and full-time ones at that.
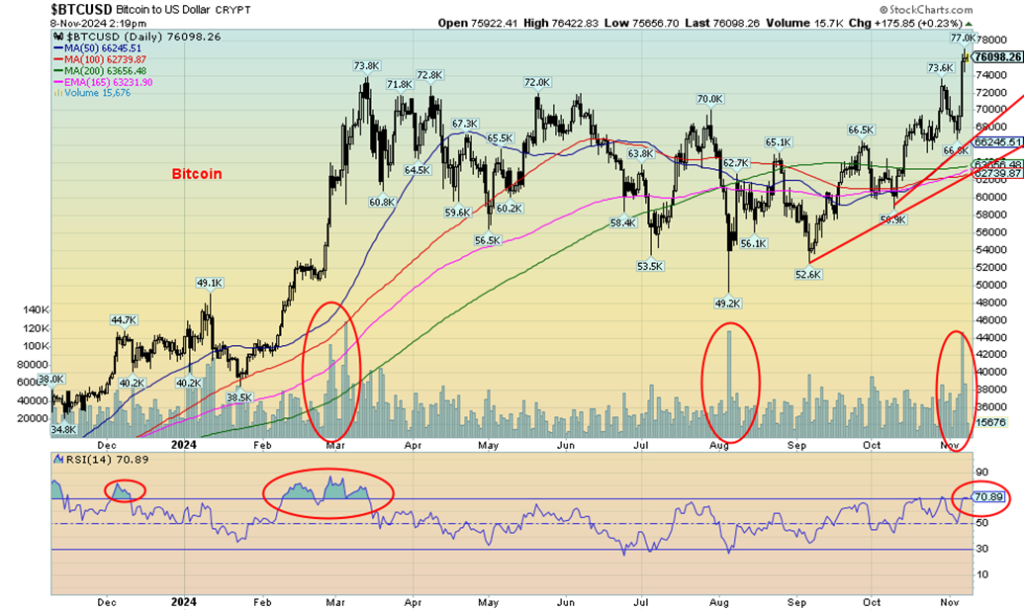
Bitcoin soared this week to a record all-time high following Trump’s election. Amongst Trump’s many promises, he indicated he wanted to make the U.S. the crypto capital of the world. The key for them is deregulation, whereby the head of the SEC is replaced by someone friendlier to crypto. The SEC was looking at ways to regulate crypto, which is still mostly a wild west. In other words, regulation vs. none or little regulation.
Our chart shows Bitcoin. It appears to have broken out on high volume in anticipation of the Trump presidency. How all of it will come to pass is open to speculation. However, Bitcoin has become quickly overbought as a result of this spike. The last high-volume event was in August when Bitcoin tumbled to $49,200. Its record high is at $76,000, spurring the forecasts of $100,000 and higher. Note: Bitcoin is now up to $80,000. While there are numerous negative divergences with the current price action, overbought is just a state, not a statement that we are about collapse back. The high into March 2024 saw the Bitcoin market remain overbought for weeks through February and March 2024. Notably, over $1 billion flowed into crypto ETFs this past week.
U.S. 10-year Treasury Note, Canada 10-year Bond CGB
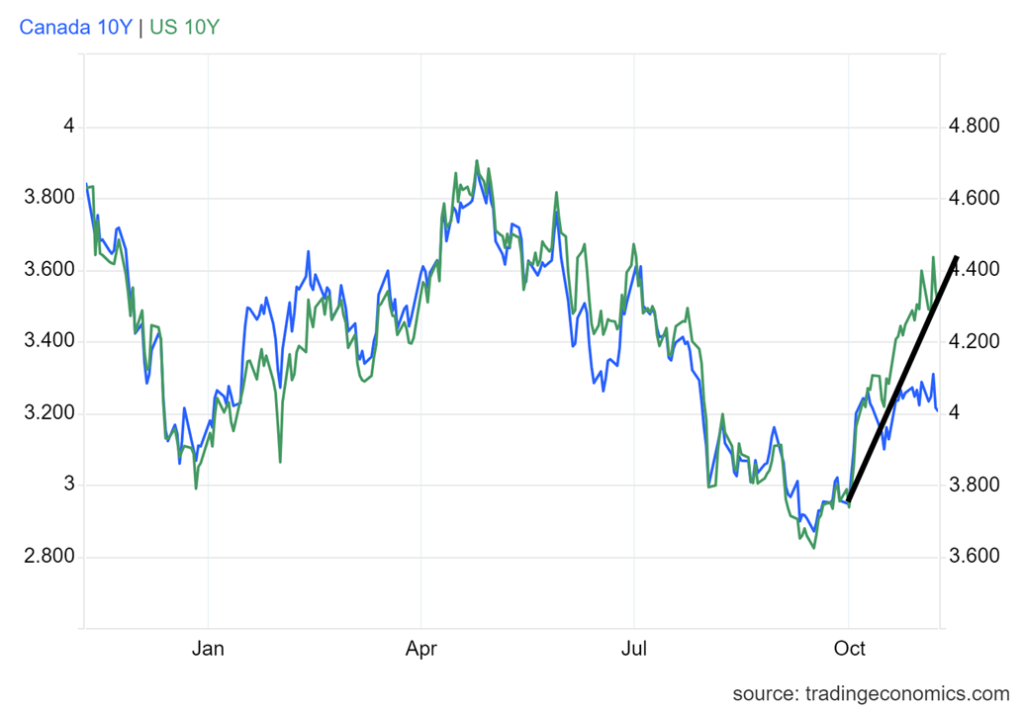
Interest rates fell this past week as traders focused on the Fed’s latest cut of 25 bp and the expectation of a further 25 bp cut in December. The ironic part is we don’t see the bond market rallying too much, despite the election of Trump. His proposed policies could be bad for inflation and that in turn could put downward pressure on the U.S. dollar and upward pressure on U.S. interest rates.
There weren’t a lot of other numbers this past week. Initial claims came in 221,000, just above last week’s 218,000, and were on forecast. Car sales, however, fell. The global PMI was on the money at 54.1 which still shows expansion. This week we have CPI. PPI, retail sales, and the NY Empire State Index. We also have industrial production which is expected to fall 0.4% month over month (m-o-m).
We are testing the uptrend line and if we break 4.25%, we are likely headed lower. Support is at 4.0%. New highs above 4.40% could send us even higher. Nonetheless, what we have to wait for is to see what
Trump might actually do. All his stated proposals are on the table but all have consequences. Trade wars, booting illegal immigrants, and raising the debt all have negative consequences for inflation, thus putting upward pressure on interest rates.
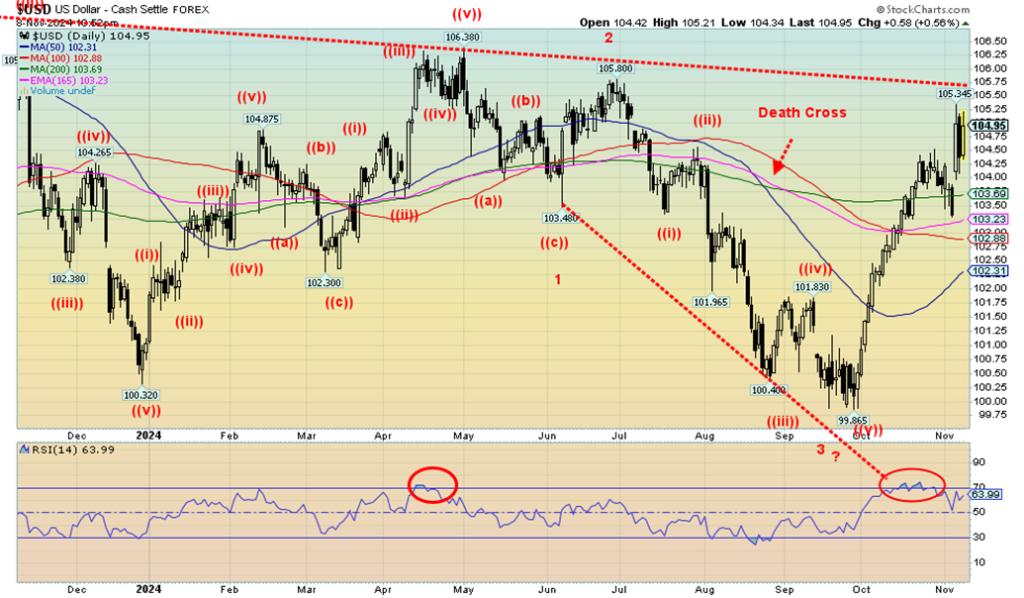
The US$ Index jumped higher this past week, celebrating Trump’s election. However, that rise could be short-lived. Mostly that’s because there remains a lot of uncertainty as to what he would do vis-à-vis tariffs, deregulation, immigration, and taxes. And Trump would have to stay away from an open brawl with Fed Chair Powell as that could have a negative impact on the dollar and the U.S. treasury market. Still, we continue to note that this rebound rally was too much too fast. It is possible we now have an ABC-type correction with that pullback last week, the B wave. We do have room to run to that downtrend line near 105.50. But a break now under 103.20 could suggest a top, to be followed by a further drop.
On the week, the US$ Index gained 0.6% while the euro fell 1.0%, taking the brunt of the dollar’s rise. The Swiss franc lost 0.5%, the pound sterling was flat, while the Japanese yen gained 0.4% despite widening spreads between Japan and the U.S. The Cdn$ also gained, up 0.4%. The dollar’s rise could have been more. There remains uncertainty ahead. For example, trade wars would not be positive for anybody. But right now, the U.S. economy remains strong. Consumer sentiment even improved as the Michigan Index rose to 73 from 70.5, with expectations of 71. It’s the highest level since April.
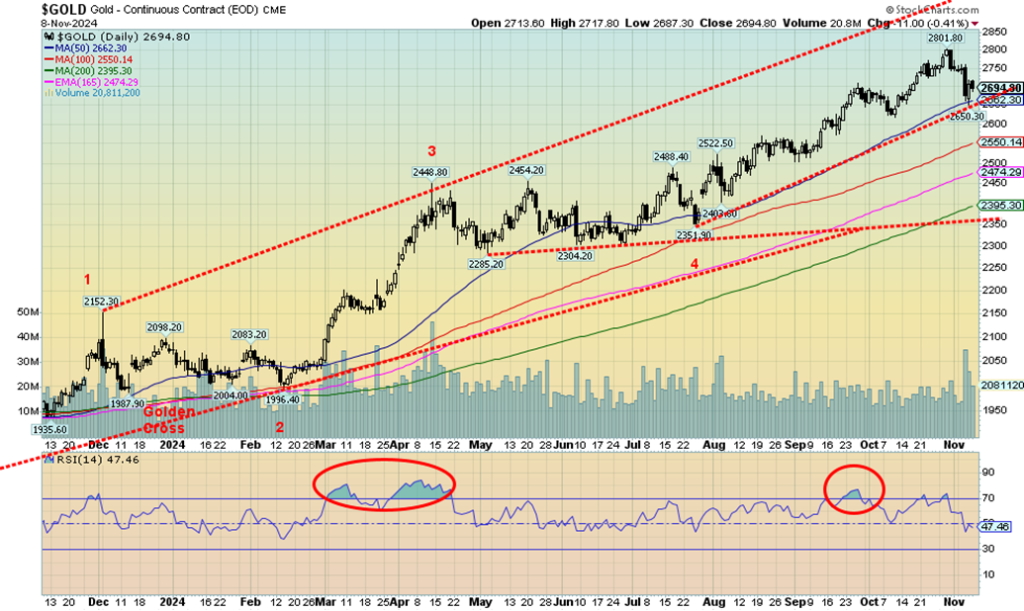
For the second week in a row gold fell, losing this time 2.0%. Silver was worse, down 3.8%. However, both remain up 30%+ on the year. The trend remains solidly to the upside. Platinum, whose performance is sluggish at best, fell 2.4% and is down 4.4% in 2024. Of the near precious metals, palladium lost 10.5% while copper was down 1.4%. The Gold Bugs Index (HUI) was off 1.7% while the TSX Gold Index (TGD) fell 1.9%. That generally the gold stocks held in on the week is one of the positives we gleaned from this week’s sell-off because normally the stocks get hit harder.
The culprit for the fall of gold? Continued strength in the U.S. economy and a soaring US$ Index, celebrating Trump’s victory. Trump’s promises on the surface are good for the U.S. dollar, but trade wars and more could end the celebration. Lower taxes and deregulation would also be bad for the U.S. dollar as the deficit is poised to rise, possibly substantially. All could unleash a new round of inflation, putting pressure on the Fed to hike rates even as Trump wants the Fed to them.
Fed Chair Jerome Powell’s declaration that he can’t be fired (he’s right) is small comfort to a president who would have no hesitation in opening a brawl with him. BTW, Trump appointed Powell. But it’s based on recommendations and a vote from the Fed Board of Governors who wield the power. A massive increase in debt would be music to gold’s ears. Even in Trump’s first term, gold gained over 60% but then so did the SPX. Gold also responds positively to geopolitical risks. A reminder that, just because Trump was elected, that doesn’t end the culture wars and the huge political divide in the U.S. today.
We are a bit concerned that, because gold closed under $2,700 this past week, we could have more downside before we return to the upside. A break now of $2,650 the week’s low could trigger further selling to $2,600 or even down to $2,550 and the 100-day MA. It can’t be ruled out unless we regain back above $2,750 first. With move above $2,770 a new high is probable.
The strong U.S. dollar this week was bad news for gold as gold usually moves inversely to the U.S. dollar. But gold gains against other currencies that lose value to the U.S. dollar. Didn’t work this week, however, as gold in Cdn$ fell 2.3% while gold in euros was off 0.7%.
For the short term, we are a little negative towards gold, but long term we remain quite bullish. As we’ve noted many times, pullbacks like this are healthy in a bull market. You just don’t want it to break under key points. And right now, that point is $2,550 that could trigger a sharper decline to $2,400. Under $2,350, the decline could get worse.
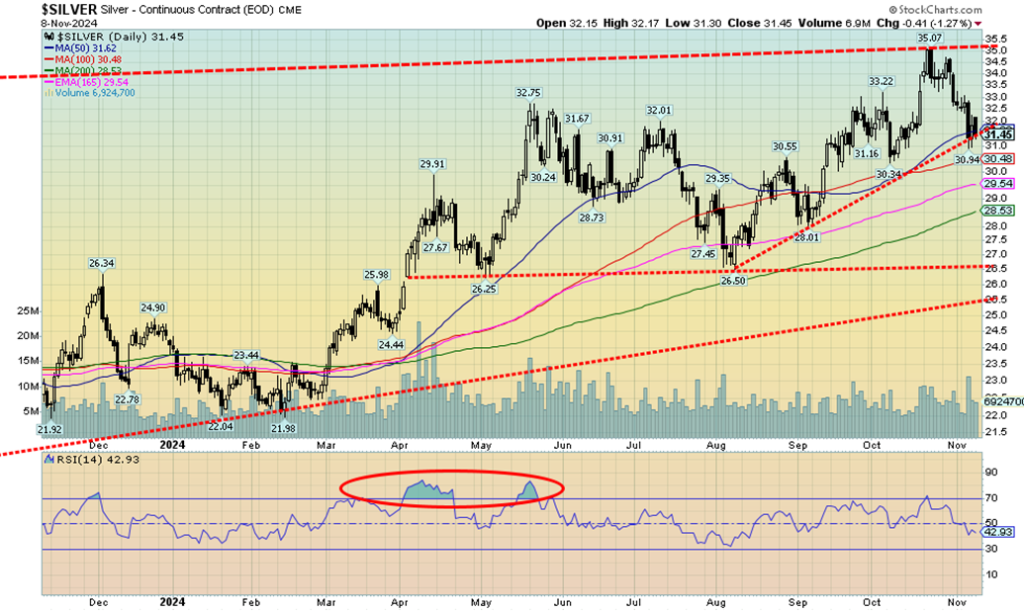
Silver as usual followed gold lower this past week, but the drop was worse. Silver fell 3.8%, far outpacing gold’s decline of 2.0%. Silver remains up 30% in 2024; however, we are down 10.3% from the recent high near $35. That is correction territory. We thought we were breaking out when we leaped to $35, but so far it hasn’t held and we did not like the fact we dropped back under $32. Still, we are only testing that uptrend line from the August 2024 low.
However, we wouldn’t want to see it break. Another break under $31 would not be good and then we could fall to $29.50/$30.00. We regain back above $33 and new highs could be in order above $34. We’ll see this week against the backdrop of the CPI and PPI.
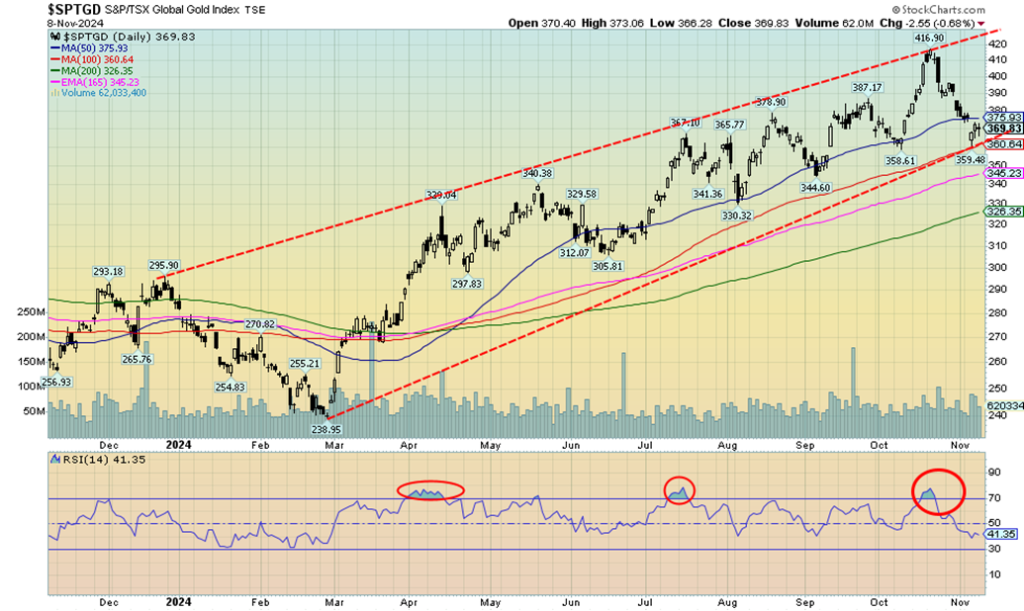
Like everything related to the metals this past week, gold stocks fell. The TSX Gold Index (TGD) was down 1.9% while the Gold Bugs Index (HUI) lost 1.7%. That’s the bad news. The good news is their fall relative to gold and silver was about the same as gold but better than silver. That they didn’t get hit harder is actually good news. We also finished the week on an uptrend line but below the 50-day MA and just above the 100-day MA at 360. Below that, the 165-day EMA lies at 345 and finally the 200-day MA is at 326. Those areas would also be support. In the volatile world of gold stocks, we are down about 11% from the recent high.
That is a fairly normal type of correction. On the run to the 455 all-time high in 2011, there were a few drops of about 15%. So not unusual—so far. The volatility comes from their thin nature as outstanding stock for the public is low. Many companies are held in funds, insiders, and more. That stock doesn’t usually come out with any regularity. We need to regain 400 to suggest we’ve made a bottom, and 405 to suggest we could take out the recent high at 417. Remember, we are still up almost 30% on the year, so it’s not all bad.
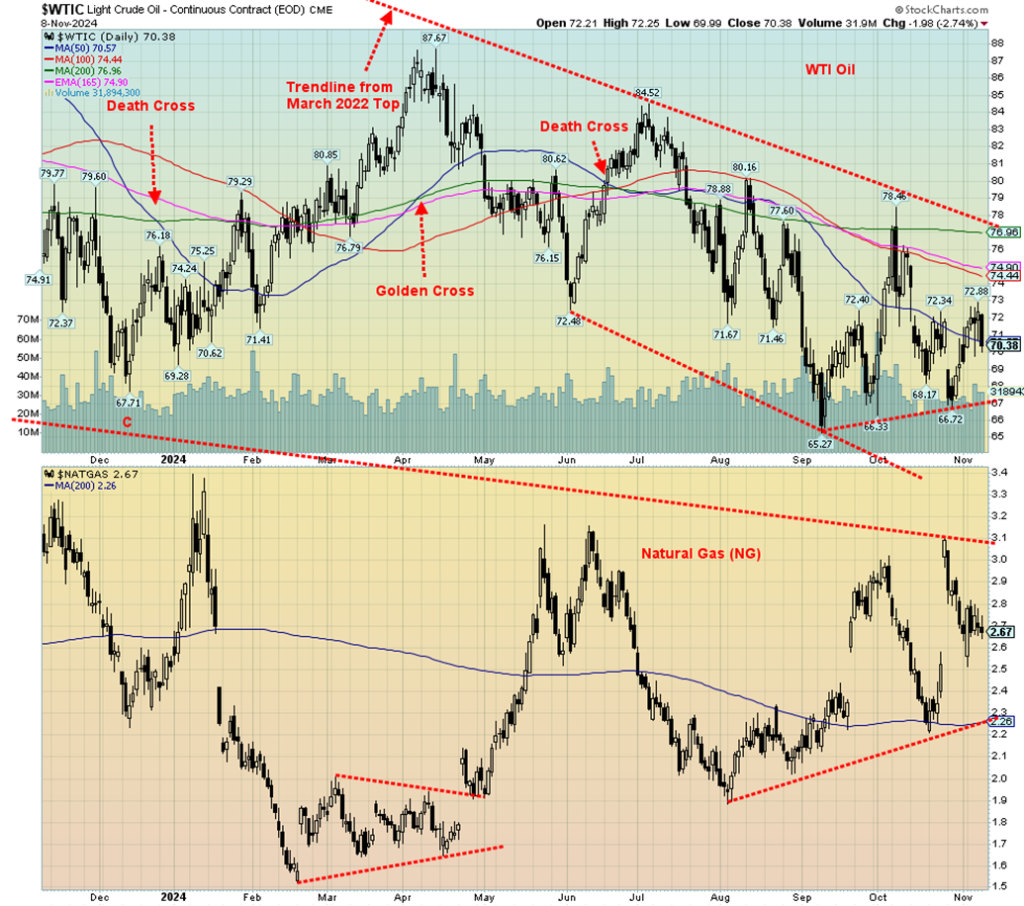
For the past few days at least, WTI oil prices have been rangebound between $70 and $72. We’re up from about $67, a higher low which could be signaling the start of a new uptrend. Or this rebound could be merely the right shoulder of an awkward-looking head and shoulders consolidation top pattern.
It breaks under $67 and projects to $54. We don’t believe that will happen, but it cannot be discounted until we break over of $78. Above $78 would also be a breakout over that downtrend line from a top two years ago at the outset of the Russia/Ukraine war. Two things might cause oil to break down: the end of the wars and massive increased production from the U.S., who is already the world’s largest producer.
On the week, WTI oil rose 1.3%, Brent crude was up 1.4%. Natural gas (NG) at the Henry hub rose 0.4% while at the EU Dutch hub NG was up 8.0%. At the Dutch hub, NG was up due to colder weather and oddly reduced wind power. The ARCA Oil & Gas Index (XOI) rose 4.4% while the TSX Energy Index (TEN) was up 2.7%.
For the moment at least, we are caught in between support at $67 and resistance up to $77. Ditto for NG where support is at $2.25 while resistance is up to $3.10. So, we are neutral here on both. First breakout for oil would be above $75. NG needs to regain at least $2.90.
__
(Featured image by Natilyn Photography via Unsplash)
DISCLAIMER: This article was written by a third party contributor and does not reflect the opinion of Born2Invest, its management, staff or its associates. Please review our disclaimer for more information.
This article may include forward-looking statements. These forward-looking statements generally are identified by the words “believe,” “project,” “estimate,” “become,” “plan,” “will,” and similar expressions, including with regards to potential earnings in the Empire Flippers affiliate program. These forward-looking statements involve known and unknown risks as well as uncertainties, including those discussed in the following cautionary statements and elsewhere in this article and on this site. Although the Company may believe that its expectations are based on reasonable assumptions, the actual results that the Company may achieve may differ materially from any forward-looking statements, which reflect the opinions of the management of the Company only as of the date hereof. Additionally, please make sure to read these important disclosures.
David Chapman is not a registered advisory service and is not an exempt market dealer (EMD) nor a licensed financial advisor. He does not and cannot give individualised market advice. David Chapman has worked in the financial industry for over 40 years including large financial corporations, banks, and investment dealers.
The information in this newsletter is intended only for informational and educational purposes. It should not be construed as an offer, a solicitation of an offer or sale of any security. Every effort is made to provide accurate and complete information. However, we cannot guarantee that there will be no errors. We make no claims, promises or guarantees about the accuracy, completeness, or adequacy of the contents of this commentary and expressly disclaim liability for errors and omissions in the contents of this commentary.
David Chapman will always use his best efforts to ensure the accuracy and timeliness of all information. The reader assumes all risk when trading in securities and David Chapman advises consulting a licensed professional financial advisor or portfolio manager such as Enriched Investing Incorporated before proceeding with any trade or idea presented in this newsletter.
David Chapman may own shares in companies mentioned in this newsletter. Before making an investment, prospective investors should review each security’s offering documents which summarize the objectives, fees, expenses and associated risks. David Chapman shares his ideas and opinions for informational and educational purposes only and expects the reader to perform due diligence before considering a position in any security. That includes consulting with your own licensed professional financial advisor such as Enriched Investing Incorporated. Performance is not guaranteed, values change frequently, and past performance may not be repeated.

-

 Fintech6 days ago
Impacta VC Backs Quipu to Expand AI-Driven Credit Access in Latin America
-

 Fintech2 weeks ago
Nubank Launches in Argentina With $474M Bet to Shake Up the Fintech Market
-

 Impact Investing3 days ago
Climate Losses Drive New Risk Training in Agriculture Led by Cineas and Asnacodi Italia
-
 Biotech1 week ago
Why Bioceres Shares Slide Into Penny Stock Territory


