Markets
Markets Tumble as New China Tariffs Spark $1.6 Trillion Selloff
Tariffs of 100% on China rattled markets Friday, causing the biggest drop since April and erasing $1.6 trillion. Indices hit new highs earlier but closed lower. Economic data delays from the shutdown may hinder the Fed. Bonds, oil, and gold slipped, though silver hit record highs. Canada surprised with strong job gains amid global weakness.

Has the bubble burst? Friday’s big drop triggered by 100% tariffs on China popped the illusion, for the moment at least. People have also been wondering, if things are so bad, why haven’t we seen signs of a recession yet? That could all be changing. For the economy, things are not as yet totally front and center. For the stock markets, was Friday a signal?
Now, two of the most important economic indicators that are reported each month won’t be coming out until the government shutdown ends. That’s jobs and inflation. Yes, both come from the Bureau of Labour Statistics (BLS). As a government agency, it is caught up in the shutdown and the firing of its head by President Donald Trump, which is creating chaos and uncertainty. The BLS isn’t the only one – the Bureau of Economic Analysis (BEA) and the Census Bureau are also impacted. Trouble is brewing, at least until they end this shutdown. In the meantime, we are all flying blind.
Consumer confidence is dragging down around where it was during the 1980–1982 recession, the 2007–2009 Great Recession, and the COVID pandemic. Manufacturing activity has been falling, with many manufacturing indices registering recession. The Fed is cutting interest rates. The housing market is tipping over with falling prices.
On the other hand, spending by both consumers and government in particular and to a lesser extent, corporations, has been good. Corporate profits have also been steadily rising. Note as well the Leading Economic Index has been falling for months. Yet we avoid a recession? The stock market has been priced for absolute perfection. Can it come unglued? Yes. Is it coming unglued? TBD.
U.S. Leading Economic Index, Government Spending 2015–2025
Source: www.tradingeconomics.com, www.conference-board.org, www.bea.gov
There are pockets of the U.S. that are doing poorly and others that are doing well. Wages are holding up as the labour market tightens, particularly in companies and industries that depended on alleged illegal workers. Illegal workers provide some $89 billion in taxes. There is an estimated 11 million to 15 million illegals in the U.S.
That’s a huge part of the labour force, not to ignore families as well. The rich and ultra-rich are doing well, thanks to a rising stock market. America has some 62% of Americans invested in the stock market, either directly or through mutual funds, pension funds, and ETF funds. Note as well that some 71% of GDP comes from the Blue States, some of which are under attack today from ICE and the U.S. National Guard. Not good for confidence.
As Hemingway said, how do you go bankrupt? Slowly, then suddenly. We are still at the slowly stage. Or are we at the beginning of the suddenly stage?
Consumer Spending, U.S. Corporate Profits 2015–2025
Source: www.tradingeconomics.com, www.bea.gov
U.S. Price House Price Index, Existing Home Sales 2015–2025
Source: www.tradingeconomics.com, www.fhfa.gov, www.nar.realtor
University of Michigan Consumer Confidence 1953–2025
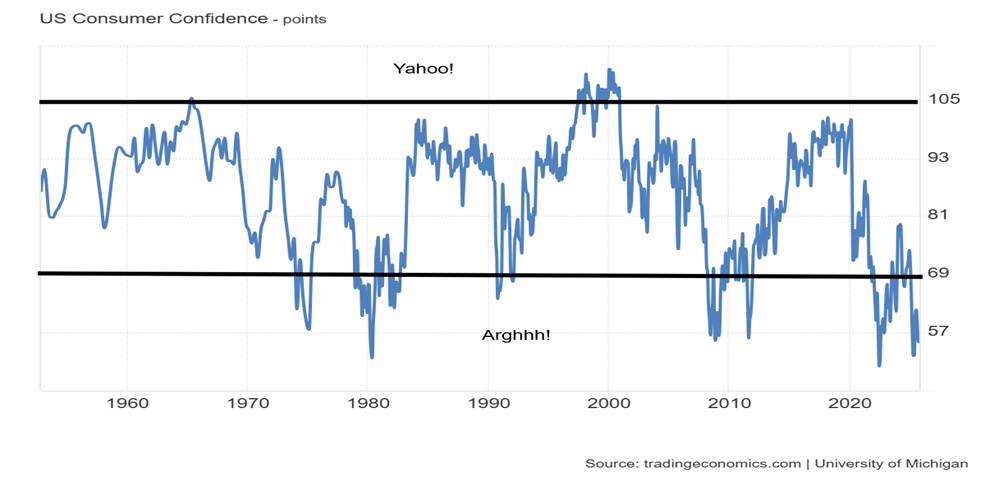
Source: www.tradingeconomics.com, www.umich.edu
Canada Job Numbers
Canada Employment Change, Unemployment Rate 2020–2025
Source: www.tradingeconomics.com, www.statcan.gc.ca
Canada blew expectations away with the latest job numbers. In September, 65,500 jobs were created, more than offsetting the 40,800 loss the month before. The market expected only 5,000 new jobs. Full-time jobs rose 106,100 while part-time jobs fell 45,600. Manufacturing created 28,000 jobs and Alberta led the way with 43,000 jobs.
Health care had 14,000 jobs while wholesale and retail trade fell by 21,000. The unemployment rate remained at 7.1%. The R8 unemployment rate (plus discouraged searchers, waiting group, portion of involuntary part-timers), Canada’s most comprehensive calculation of unemployment, actually fell to 8.6% from 10.2%. All of it a pleasant surprise.
Youth unemployment remained sticky at 14.7%. Youth aged 15–24 represent roughly 14% of the labour force in Canada. Overall, both economists and the government must be pleased.
Markets & Trends
| % Gains (Losses) Trends | ||||||||
| Close Dec 31/24 | Close Oct 10/25 | Week | YTD | Daily (Short Term) | Weekly (Intermediate) | Monthly (Long Term) | ||
| S&P 500 | 5,881.63 | 6,552.51 (new highs) * | (2.4)% | 11.4% | up (weak) | up | up | |
| Dow Jones Industrials | 42,544.22 | 45,479.60 (new highs) * | (2.7)% | 6.9% | neutral | up | up | |
| Dow Jones Transport | 16,030.66 | 15,067.87 | (4.9)% | (5.2)% | down | neutral | up | |
| NASDAQ | 19,310.79 | 22,204.43 (new highs) * | (2.5)% | 15.0% | up | up | up | |
| S&P/TSX Composite | 24,796.40 | 29,850.29 (new highs) * | (2.0)% | 20.7% | up | up | up | |
| S&P/TSX Venture (CDNX) | 597.87 | 980.77 new highs) | 1.7% | 64.5% | up | up | up | |
| S&P 600 (small) | 1,408.17 | 1,392.72 | (4.9)% | (1.1)% | down | up | up | |
| MSCI World | 2,304.50 | 2,834.50 | (0.9)% | 23.0% | up | up | up | |
| Bitcoin | 93,467.13 | 110,678.20 (new highs) * | (9.5)% | 18.4% | down | up | up | |
| Gold Mining Stock Indices | ||||||||
| Gold Bugs Index (HUI) | 275.58 | 613.23 (new highs) * | (1.1)% | 122.5% | up | up | up | |
| TSX Gold Index (TGD) | 336.87 | 728.19 (new highs) * | (1.9)% | 116.2% | up | up | up | |
| % | ||||||||
| U.S. 10-Year Treasury Bond yield | 4.58% | 4.04% | (1.9)% | (11.8)% | ||||
| Cdn. 10-Year Bond CGB yield | 3.25% | 3.17% | (0.6)% | (2.5)% | ||||
| Recession Watch Spreads | ||||||||
| U.S. 2-year 10-year Treasury spread | 0.33% | 0.53% | (1.9)% | 60.6% | ||||
| Cdn 2-year 10-year CGB spread | 0.30% | 0.70% | (5.4)% | 133.3% | ||||
| Currencies | ||||||||
| US$ Index | 108.44 | 98.85 | 1.2% | (8.8)% | up | down | down | |
| Canadian $ | 69.49 | 0.7136 | (0.5)% | 2.7% | down | neutral | neutral | |
| Euro | 103.54 | 116.18 | (1.1)% | 12.2% | down | up | up | |
| Swiss Franc | 110.16 | 125.13 | (0.5) | 13.6% | down (weak) | up | up | |
| British Pound | 125.11 | 133.56 | (1.0)% | 6.8% | down | up | up | |
| Japanese Yen | 63.57 | 66.14 | (2.5)% | 4.0% | down | down l | down | |
| Precious Metals | ||||||||
| Gold | 2,641.00 | 4,015.59 (new highs) * | 3.4% | 52.1% | up | up | up | |
| Silver | 29.24 | 50.10 (new highs) * | 4.3% | 71.0% | up | up | up | |
| Platinum | 910.50 | 1,598.50 (new highs) | (1.3)% | 75.6% | up | up | up | |
| Base Metals | ||||||||
| Palladium | 909.80 | 1,429.00 | 13.3 | 57.1% | up | up | up (weak) | |
| Copper | 4.03 | 4.80 | (4.8)% | 19.1% | up | up | up | |
| Energy | ||||||||
| WTI Oil | 71.72 | 58.24 | (4.2)% | (18.8)% | down | down | down | |
| Nat Gas | 3.63 | 3.13 | (6.0)% | (13.8)% | up (weak) | down (weak) | neutral | |
Source: www.stockcharts.com
S&P 500
Source: www.stockcharts.com
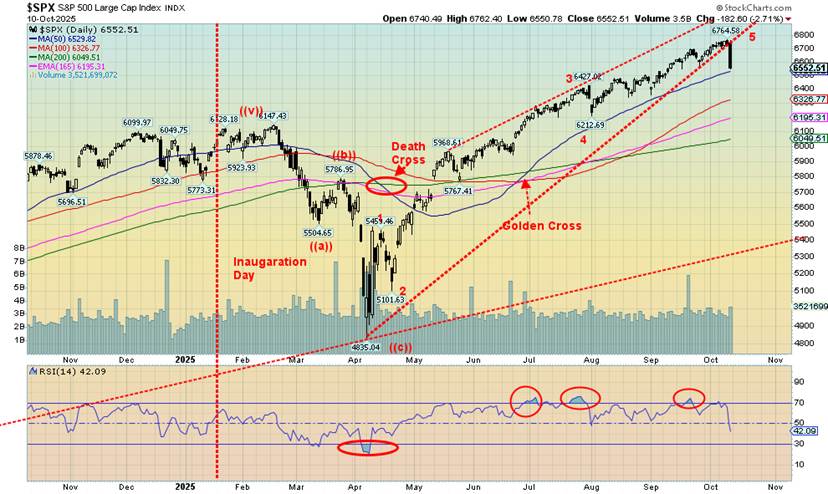
Is the party over? Friday’s wipeout that took $1.6 trillion off the market was the worst since April 2025. The reason? The 100% tariffs on China on top of other tariffs because China is preventing the export of critical rare earths that the U.S. badly needs to run its high-tech economy. A correction was, of course, overdue. But the pickup in volatility is not a surprise, given the move since that April 2025 low. Up 37%. Is that a rising wedge triangle? If that’s correct, then a drop back to the April low at 4935 cannot be ruled out. That’s a 27% drop. Partying is great, but then comes the hangover.
As for the tariffs on China, this is just a continuation of the economic war that the U.S. started in April 2025. As a reminder, economic war usually leads to real war. You could say the economic warfare got underway with sanctions against numerous countries. The U.S. has comprehensive sanctions on five countries (Russia, Iran, North Korea, Cuba and Syria) but targeted sanctions and arms embargoes on another eighteen. Historically, sanctions don’t work. And this time is shown to be no different. They always find a workaround, an avoidance strategy.
Red ink was mostly all around. The S&P 500 (SPX) fell 2.4%, the Dow Jones Industrials (DJI) was down 2.7%, the Dow Jones Transportations (DJT) was down 4.9%, and the NASDAQ was down 2.5%. Both the SPX and NASDAQ
made all-time highs this past week, as did the DJI the previous week. The NY FANG Index also made new all-time highs then reversed and closed down 2.7%. Notably the S&P 500 Equal Weight Index did not join the S&P 500 in making all-time highs. The S&P 400 (Mid) fell 3.9% while the S&P 600 (Small) dropped 4.9%. In a dramatic reversal, Bitcoin fell 9.5% after registering all-time highs again.
Bitcoin
Source: www.stockcharts.com
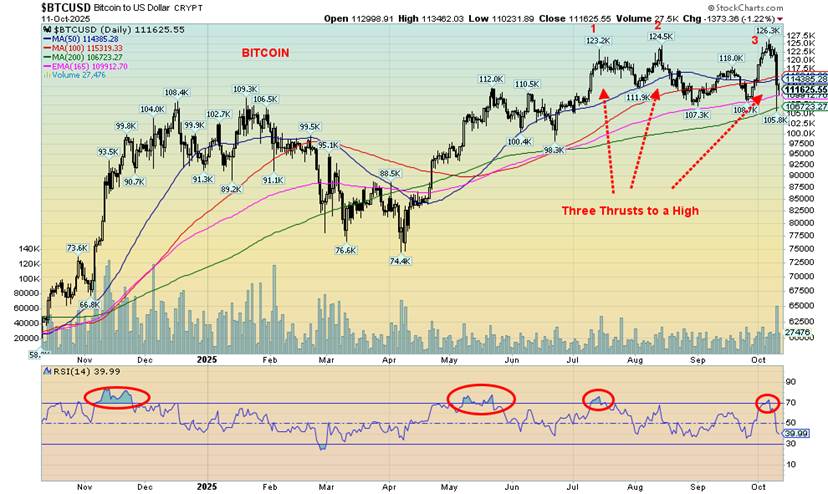
Bitcoin appears to making a pattern that we have seen before. We call it three thrusts to a high. And this chart shows that. It’s also a potential triple top. Potential targets could be down to $91,000 following a firm break under $107,000. Key support is $98,000. This chart does not look good for Bitcoin. Bitcoin has been popular with males, in particular those in the Gen Z and Millennial age groups.
They may be about to learn a nasty lesson that what goes up also goes down. Bitcoin has been through these shakeouts before, notably in 2017–2019, down 84%, and in 2021–2022, down 77%. This would be the third collapse. Average the two and we could collapse to $25,000, an 80% decline. That we took out both the August and September lows this week is a bad sign. Nonetheless, note its potential, but it is not a good look. Bitcoin is backed by nothing. Gold has no liability and is real.
In Canada, the TSX Composite made all-time highs and fell 2.0% while the TSX Venture Exchange (CDNX) held on, up 1.7% to new 52-week highs. Notable all-time highs for the TSX included Income Trusts (TCM), Golds (TGD), Metals (TGM), Materials (TMT), Financials (TFS), Consumer Discretionary (TCD), and Utilities (TUT). All but Utilities finished down on the week. Are utilities a place to hide in a bear market?
In the EU, the London FTSE made all-time highs and fell 0.7%, while the EuroNext also made all-time highs and fell 2.3%. The Paris CAC 40 fell 2.0% while the German DAX made all-time highs and fell 0.6%. In Asia, China’s Shanghai Index (SSEC) rose 0.4% to 52-week highs, the Tokyo Nikkei Dow (TKN) made all-time highs, up 5.9%, and while Hong Kong’s Hang Seng (HSI) made all-time highs it fell 3.1%. All-time highs, lower closes, and a reversal is not good sign. The feeling prevails almost everywhere. So, is the party over?
Performance Since January 20, 2025
Source: www.stockcharts.com
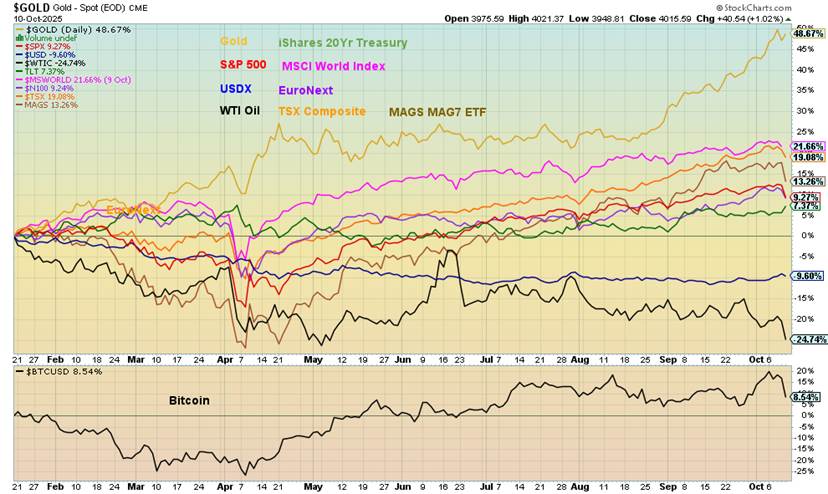
We haven’t shown the performance of the market since Inauguration Day, January 20, for a while so here it is. Gold is still well in the lead, up 48.7%, with the MSCI World Index second best, up 21.7%. WTI oil is still the biggest loser, down 24.7%. The US$ Index is down 9.6%.
U.S. Bonds
Source: www.stockcharts.com
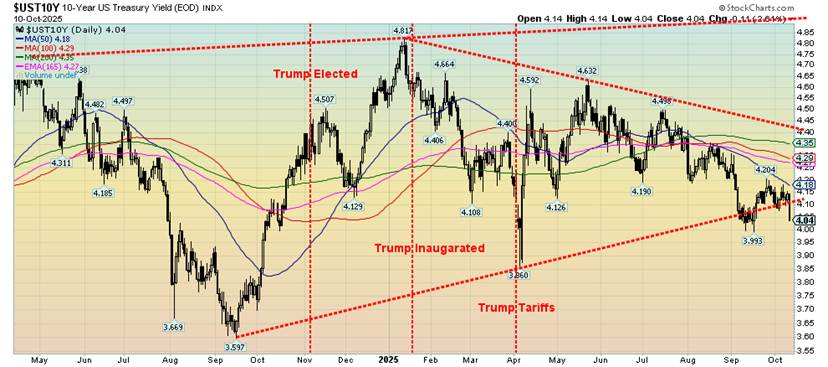
Bond yields fell this past week on recession fears. The yield on the 10-year U.S. Treasury fell to 4.04%, down from 4.12%. The Canadian Government 10-year bond (CGB) followed, down to 3.17% from 3.19%. However, we don’t expect a big drop as inflation remains sticky – well, as long as we can calculate something showing that inflation is still high, but we are travelling blind with this shutdown.
The shutdown is going to create more problems as mass firings put potentially thousands of government workers out of work with no severance. What’s worse, President Trump has declared that its Democrat workers are being fired. The increasingly dangerous authoritarian takeover of the U.S. continues. It won’t be long before no paycheque kicks in, spending slows, and many run into problems paying their bills, mortgages, rent, etc.
Below 4.00% we could fall to the April low at 3.86%. Below that, the next support is around 3.60%. Nonetheless, we suspect that inflation and the uncertainty surrounding just about everything in the U.S. these days will help keep bond yields elevated, even if the Fed cuts further. However, as we note, the Fed also is flying blind.
Gold and Silver
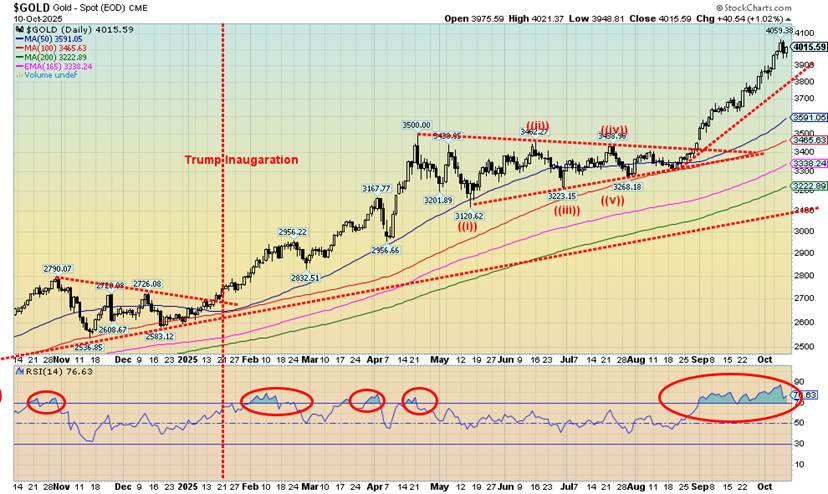
Source: www.stockcharts.com
What’s going to stop the gold and silver market? A few things. First, that extremely overbought condition that has persisted since August. We’ve never seen one that has lasted as long as this one. Second, that stock markets took a tumble on Friday after 100% tariffs were imposed on China, on top of the current tariffs. During the meltdowns in 2008 and 2020, gold and gold stocks followed the markets down. But holding up the best was gold itself, not so much the stocks. Third, that we’ve going almost straight up since August, so a pause is healthy for the long-term viability.
We clipped this from Morningstar (morningstar.com) with data provided by Dow Jones (www.dowjones.com). It’s revealing.
Front Month Comex Gold for October delivery gained $95.10 per troy ounce, or 2.45% to $3975.90 this week. Note the following:
- up for eight consecutive weeks
- longest winning streak since the week ending February 21, 2025, when the market rose for eight straight weeks
- up 10 of the past 11 weeks
- today it is up $29.60 or 0.75%
- third highest close in history
- up 13 of the past 16 sessions
- today’s settlement value is the third highest this year
- off 1.67% from its 52-week high of $4043.30 hit on Wednesday, October 8, 2025
- up 54.96% from its 52-week low of $2565.70 hit on Friday, November 15, 2024
- rose 49.60% from 52 weeks ago
- off 1.67% from its 2025 settlement high of $4043.30 hit on Wednesday, October 8, 2025
- up 50.69% from its 2025 settlement low of $2638.40 hit on Monday, January 6, 2025
- off 1.67% from its record high of $4043.30 hit Wednesday on October 8, 2025
- month-to-date it is up 3.52%
- year-to-date it is up $1346.70 or 51.22%
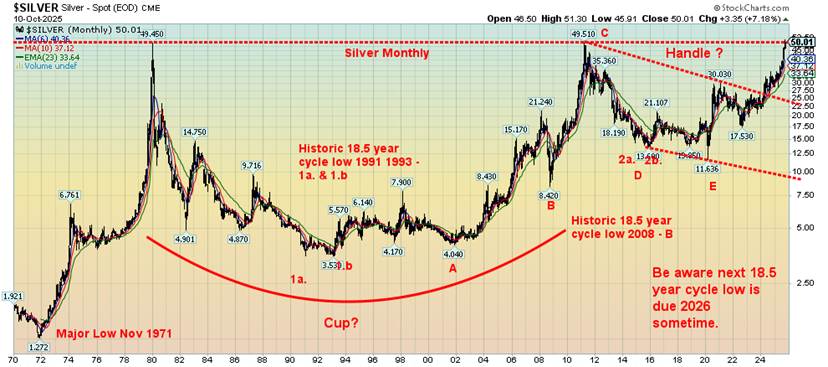
Gold gained 3.4% this past week. But the real star of the week was silver that, after 45 years, has finally made an all-time high. Silver was up 4.3% – yes, to new all-time highs with the high at $51.30. Interestingly, silver has moved into backwardation, meaning the spot price is now higher than the first futures price. Why? Shortages of silver have put pressure on the spot price. Silver breaking above $50 after 45 years is momentous and signals to us that a more explosive move for silver could be coming.
Not to be outdone after 14 years, the Gold Bugs Index (HUI) took out its 2011 high, losing 1.1% on the week. The TSX Gold Index (TGD) also faltered, following another all-time high down 1.9%. Not a good sign, even as gold and silver made all-time highs. But the gold stocks tend to follow the market more and the stock markets fell sharply on Friday, so gold stocks followed. Remember the old adage that you can’t go broke taking a profit.
Other metals were mixed. Platinum made new 52-week highs but closed down 1.3%. Palladium had a good week, up 13.3%, and made a 52-week high. Copper, spooked by the market fall on Friday and anticipating a possible recession, fell 4.8%, following an encouraging move over $5. Copper stocks followed copper down.
Currencies were pretty benign on the week as the US$ Index gained 1.2% but dropped 0.7% on Friday along with the stock market. All the other currencies were down with the Japanese yen hit, down 2.5%.
Oil prices fell again, thanks to the truce agreement with Israel and Gaza. Tensions in the Middle East fell. WTI oil fell 4.2% below $60 and Brent crude was down 3.7%. Natural gas (NG) didn’t fare any better, down 6.0%, but NG at the EU Dutch Hub was up 0.9% on ongoing conflicts with Russia/Ukraine. Energy stocks fell with the market, with the ARCA Oil & Gas Index (XOI) off 4.3% while the TSX Energy Index (TEN) fell 1.7%. The energy sector woes continue, but the stocks have outperformed, suggesting to us that oil prices could rise again in the near future.
Gold is overdue for a correction. If that’s correct, then it should be just a correction, nothing more. November/December has in the past seen important lows. The 31-month cycle suggests a potential low for November/December. The last significant low was October 2022 so in fact we are overdue. Some have suggested a 20% correction, so be aware.
Silver, after hitting over $50 for the first time ever, is also due for a pullback. The stocks typically suffer the most in a pullback. Support for gold is at $3,800, $3,600, and $3,400. Below $3,400 is serious danger as it could signal that the gold bull is over. Below $3,300 it confirms it’s over. We are not expecting the latter, but even a 10% correction takes us to around $3,600. For silver, support is seen at $46 and $44. Silver is some 44% above its 200-day MA while gold is about 25% above its 200-day MA. Both are a bit of a stretch, begging for the correction. For the gold stock indices, the HUI has support at 580 and 540. The TGD at 700 and 650. Falling that far would be modest corrections. More spooking is the 200-day MA support at 495 for the TGD and 410 for the HUI.
We may be starting an overdue correction for gold, silver, and gold stocks. It’s healthy and a new leg up would most likely get underway in December/January. But taking profits now is not unwise. The junior development miners could also suffer, due to their volatility at the best of times.
Silver 1970–2025 (monthly)
Source: www.stockcharts.com
Copyright David Chapman 2025
__
(Featured image by Markus Winkler via Unsplash)
DISCLAIMER: This article was written by a third party contributor and does not reflect the opinion of Born2Invest, its management, staff or its associates. Please review our disclaimer for more information.
This article may include forward-looking statements. These forward-looking statements generally are identified by the words “believe,” “project,” “estimate,” “become,” “plan,” “will,” and similar expressions, including with regards to potential earnings in the Empire Flippers affiliate program. These forward-looking statements involve known and unknown risks as well as uncertainties, including those discussed in the following cautionary statements and elsewhere in this article and on this site. Although the Company may believe that its expectations are based on reasonable assumptions, the actual results that the Company may achieve may differ materially from any forward-looking statements, which reflect the opinions of the management of the Company only as of the date hereof. Additionally, please make sure to read these important disclosures.
David Chapman is not a registered advisory service and is not an exempt market dealer (EMD) nor a licensed financial advisor. He does not and cannot give individualised market advice. David Chapman has worked in the financial industry for over 40 years including large financial corporations, banks, and investment dealers. The information in this newsletter is intended only for informational and educational purposes. It should not be construed as an offer, a solicitation of an offer or sale of any security. Every effort is made to provide accurate and complete information.
However, we cannot guarantee that there will be no errors. We make no claims, promises or guarantees about the accuracy, completeness, or adequacy of the contents of this commentary and expressly disclaim liability for errors and omissions in the contents of this commentary. David Chapman will always use his best efforts to ensure the accuracy and timeliness of all information. The reader assumes all risk when trading in securities and David Chapman advises consulting a licensed professional financial advisor or portfolio manager such as Enriched Investing Incorporated before proceeding with any trade or idea presented in this newsletter.
David Chapman may own shares in companies mentioned in this newsletter. Before making an investment, prospective investors should review each security’s offering documents which summarize the objectives, fees, expenses and associated risks. David Chapman shares his ideas and opinions for informational and educational purposes only and expects the reader to perform due diligence before considering a position in any security. That includes consulting with your own licensed professional financial advisor such as Enriched Investing Incorporated. Performance is not guaranteed, values change frequently, and past performance may not be repeated.


TopRanked.io Weekly Affiliate Digest: What’s Hot in Affiliate Marketing [1xBet Affiliate Program]
If you thought nobody liked cricket, then this week, we're proving you wrong. And by the time we're done, you'll...


Tether Seeks Big Four Audit to Boost USDT Transparency
Tether, issuer of USDT, plans a full audit by a Big Four firm to address transparency concerns over its $184...


H&M Advances Sustainability and Cuts Emissions by 2025
H&M Group reported that by 2025, 91% of materials were recycled or sustainably sourced, with recycled content reaching 32%. Emissions...


NHS Funds Breakthrough CAR-T Therapy Breyanzi for Lymphoma Treatment in Spain
Bristol Myers Squibb announced NHS funding for CAR-T therapy Breyanzi, enabling its use from April 1st in Spain for lymphoma...


Crypto Markets Volatile as Bitcoin Hovers, Solana Eyes AI Integration
Crypto markets remain volatile amid the Iran war, with Bitcoin near $70,000 and ETF inflows improving outlook. Ethereum faces declines...
 |
|
 |  |
 |
|
-

 Crowdfunding1 week ago
Peru’s Crowdfunding Sector Shrinks Amid License Revocation
-

 Crowdfunding4 days ago
Cyberpunk Trading Card Game Surges Past Goals on Kickstarter
-

 Markets2 weeks ago
Global Sugar Market Steady Amid Oil Price Surge and Iran Conflict
-

 Africa1 week ago
Fes-Meknes Drives Investment Growth with Diversified Sectors and Industrial Expansion