Markets
Markets Now Under Pressure as Rising Bond Yields and Economic Uncertainty Weigh on Sentiment
A credit downgrade, Trump tariffs, and a deficit-heavy bill pressured markets, raising bond yields and boosting gold. Stocks fell, but Great West Lifeco may benefit from higher rates. Junior miners remain sluggish despite commodity gains, though the CDNX shows promise. Economic data this week may highlight further weakness. Memorial Day marks summer’s start, but travel lags.

So says President Trump. The bill passed the House of Representatives, barely 215/214, thanks to a couple of rogue Republicans. The Senate is next. Temporary tax cuts? The 2017 tax cuts now permanent. New tax cuts? Estimated at up to $1.5 trillion. They mainly benefit the wealthy, but will add more to the deficit. A sleight of hand says they will expire in 2028. Don’t bet on it. There is an increase in deductions of state and local taxes and temporary relief for tips and overtime pay. There was also an increase in standard deductions. The bill also included a $4 trillion hike in the debt ceiling that would hopefully avoid any showdown in August/September 2025.
However, the rub was that the bill also included cuts to food stamps and Medicaid which could negatively impact millions. Clean energy tax credits were also cut. There were increases for border security, mainly benefitting the state of Texas. And, lest we forget, there were tax increases for universities but budget increases for defense and Homeland Security. Overall, according to the Congressional Budget Office (CBO), the cuts hurt the lowest 10% while benefitting the highest 10%. They also ensure that the yearly budget deficit will remain in the 6–7% of GDP range, meaning between at least $2 to $3 trillion annually. That is by far the highest in the G7. Canada is only estimated with a budget deficit of 2.3% of GDP.
It is now estimated that by 2029 the U.S. federal debt will balloon from the current $36.9 trillion to $46.6 trillion, up 26%. Debt to GDP will soar from 123% of GDP to 140% of GDP. Is that sustainable? Probably not. If Correct, then the play is to sell U.S. treasuries and sell the U.S. dollar. That is a downward spiral for the U.S.
How will they pay for all of that? Of course, more debt. No wonder Moody’s Investment Services finally joined all the other rating agencies in lowering the U.S. debt from Aaa to Aa1. S&P went from AAA to AA+ way back in 2011. Predictably, U.S. bond yields went up with the 30-year U.S. Treasury bond jumping over 5% and the 10- year U.S. Treasury note rising to 4.52%. Today, the U.S now pays over $1 trillion annually in interest payments.
With the increase in debt, interest payments on the debt could easily rise to $1.5 trillion annually. Grant you, a huge amount of the debt issued is Treasury bills, but nonetheless they also will continue to issue notes and bonds. A recent 20-year auction did not exactly go as well as expected. Surprise! They need buyers. Will foreign buyers dry up? Will U.S. banks and insurance companies be able to absorb more U.S. debt? Or will the Fed wind up having to buy an increasing amount. Ultimately that’s inflationary.
So maybe it shouldn’t have been much of a surprise as to how markets responded to all of this. Stocks fell, gold rose, the US$ Index fell, and bond prices fell (yields that are inverse to price rose). The market spoke and it wasn’t pleased. Or, to paraphrase an old saying, “the markets are not amused” (with apologies to Queen Victoria).
30-Year U.S. Treasury Bond (yield)
This is the first time that the 30-year Treasury bond yield is over 5% since 2007. We all know what happened in 2008. Be warned. “One Big, Beautiful Bill”? More like a ticking time bomb. Everyone follows the stock market. But it is the bond market that rules.
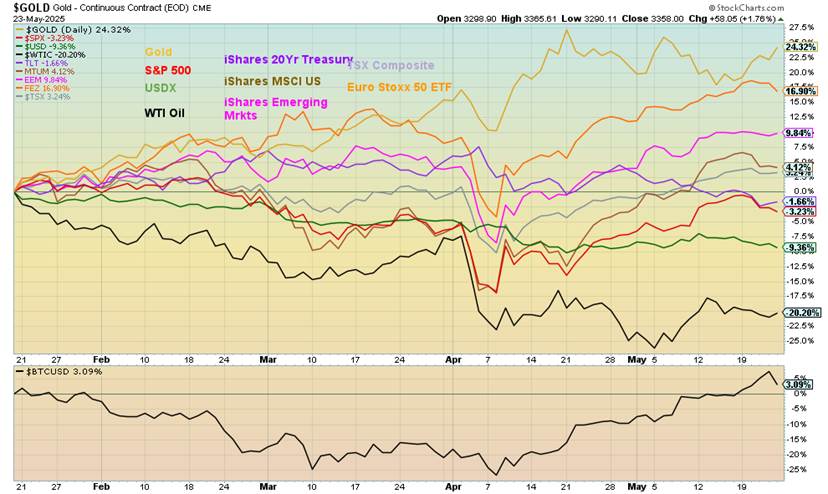
S&P 500, Gold, US$ Index, 20-year bonds (price) 2025
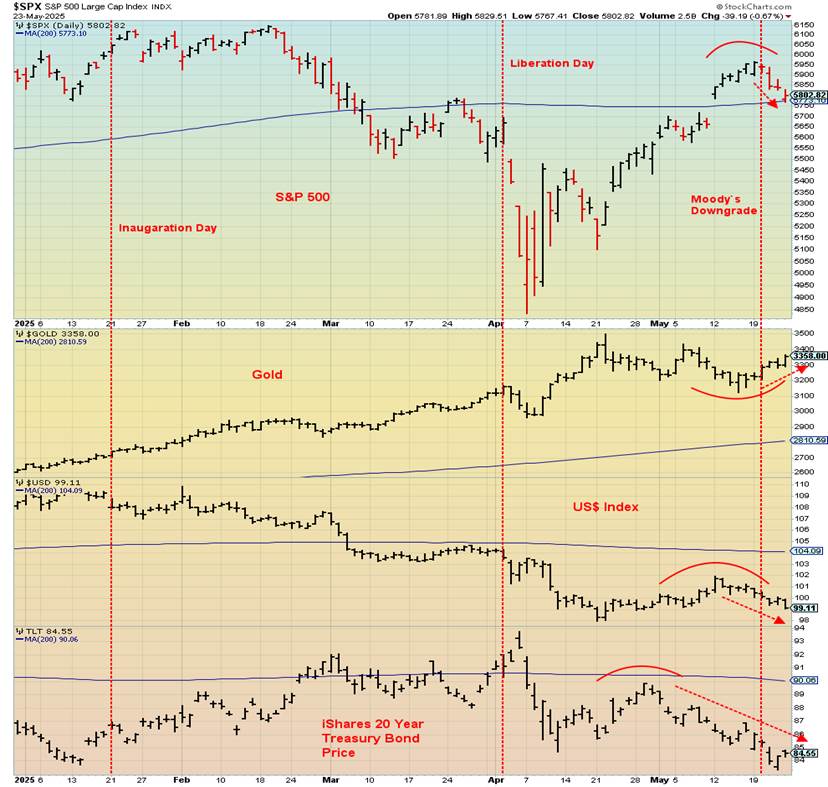
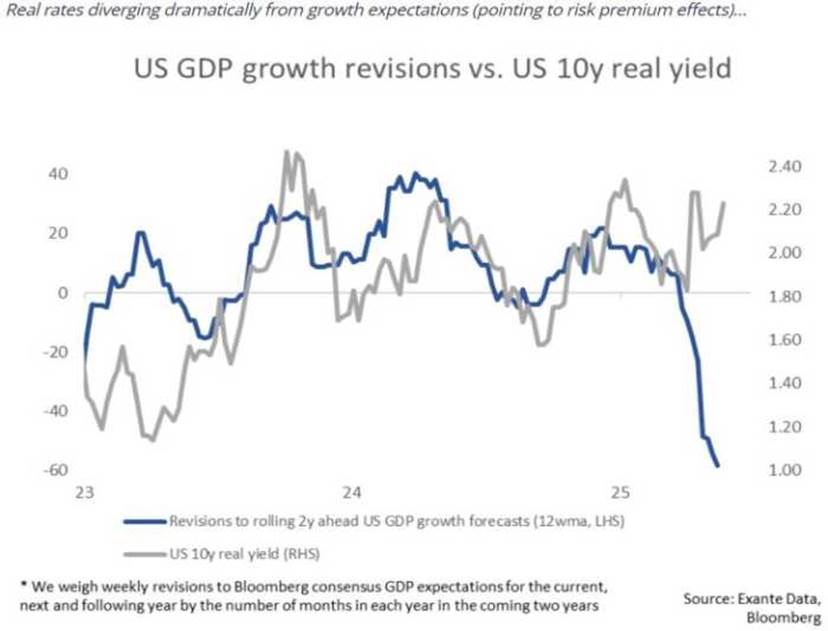
Bond yields are rising, even as economic data is beginning to show that the economy is slowing. The US$ Index is falling even as bond yields are rising. We’ve never seen that before. Normally, when the economy slows interest rates go down, not up. Rising bond/note yields are usually positive for the US$ Index. Right now, they are not. The following chart suggests real interest rates are diverging sharply from growth expectations.
This tends to make bonds riskier and we run the risk of a credit crunch. Note that consumer sentiment is falling, dragging down around where it was at the time of the 2020 pandemic. Despite the despair, retail sales and home sales are hanging tough, surprisingly. But manufacturing is declining. Unemployment has not as yet responded but is slowly rising. Nonetheless, the rising bond yields are a concern. This is also impacting other sovereign debt as well as those who price off of U.S. treasuries.
All this has raised the spectre that the U.S. could be headed down the same path as Japan. Even worse, some say that the U.S. is headed down the same road as Argentina. That might be a bit of a stretch, but Argentina tried to hide behind tariff walls and increased their debt sharply, spiking inflation and sparking a sell-off in the
Argentinian peso. Argentina was also very polarized society, not dissimilar to the U.S. today. Argentina had huge inequality. Today, the GINI coefficient stands at 41.3% for the U.S. and 40.7% for Argentina, both considered mid-high. For the record, Canada is 31.7% (source: World Bank www.worldbank.org, World Population Review www.worldpopulationreview.com). A polarized society does not make for a healthy one. Nor does huge inequality. The bond market is speaking and its words are not soothing. The US$ Index is falling. If the stock market also is falling the word seems to be, sell the U.S. Buy gold.
Chart of the Week
TSX Venture Exchange (CDNX) 2000–2025
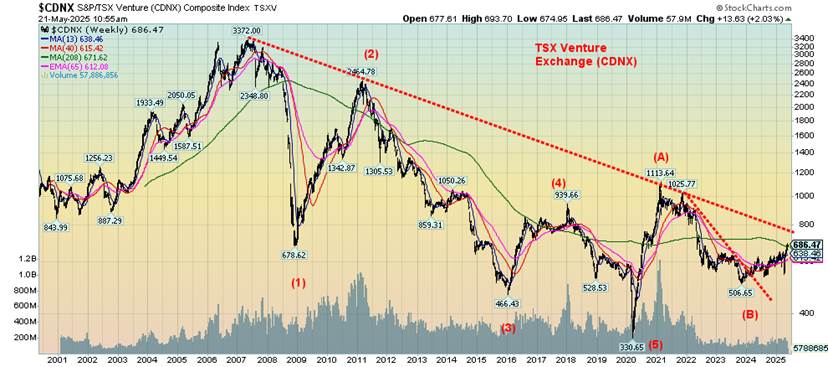
Yes, maybe this is repetitive, but once again it needs to be pointed out that the gold, metals, and mining stocks that trade on the TSX Venture Exchange (CDNX) remain undervalued and as we would say “cheap, cheap, cheap.” It’s difficult to determine the percentage of gold, metals, and mining stocks that makes up the CDNX, but it’s believed to be in excess of 50%. It is known that 40% of the world’s listings of mining stocks are on the TSX and the CDNX. Canada is a powerhouse when it comes to mining. Yet, oddly, the sector remains unnoticed when the focus all seems to be on technology, particularly AI. Even crypto seems to garner more attention than do mining stocks.
Yet Canada is well known for its reserves and production of many metals, including gold and silver, plus critical minerals such as nickel, potash, and uranium, along with a host of rare earths such as lithium and graphite. Canada is a producer of gold, aluminum, diamonds, and uranium. The mining industry is a major contributor to Canada’s economic performance in revenue and employment. Many minerals are exported. Mining is carried out in every province and territory, except for Prince Edward Island (PEI).
However, as our chart of the CDNX shows, it has been in a long descent since that peak in 2007. Those were happy days in the junior mining sector. Since then, it has been a five-wave descent from that peak. Altogether, the CDNX fell just over 90%. Today, it remains down 80%, despite the rebound since that 2020 low. And that is in nominal terms, not inflation-adjusted terms.
Optimistically, that low in 2020 was the bottom. Since then, we have had what we are labeling an A wave up and, more recently, have been creating what we believe is a B wave. While we are up roughly 35% from that bottom in 2024, we need to break out over 800 to suggest to us that we are on our way to what could be a powerful C wave up.
The CDNX does have a sub-index of the metals and mining stocks. StockCharts does not provide the index. The following index is from data we obtained from S&P Global. There are 91 constituents in the index, representing roughly 6%. The index is up roughly 128% from the 2020 low and 36% from the 2024 low. It has a lot of work to do. The sector provides a unique opportunity for those who are more speculative, given its current undervaluation. A list of top constituents and data is provided at https://www.spglobal.com/spdji/en/indices/equity/sp-tsx-venture-metals-mining-industry-index/#overview.
S&P/TSX Venture Metals & Mining (Industry) Index 2015–2025
Markets & Trends
| % Gains (Losses) Trends | ||||||||
| Close Dec 31/24 | Close May 23/25 | Week | YTD | Daily (Short Term) | Weekly (Intermediate) | Monthly (Long Term) | ||
| ne | ||||||||
| S&P 500 | 5,881.63 | 5,802.52 | (2.6)% | (1.3)% | up | up (weak) | up | |
| Dow Jones Industrials | 42,544.22 | 41,603.47 | (2.5)% | (2.2)% | up | neutral | up | |
| Dow Jones Transport | 16,030.66 | 14,535.48 | (4.1)% | (8.6)% | up | down | down | |
| NASDAQ | 19,310.79 | 18,737.21 | (2.5)% | (3.0)% | up | up (weak) | up (weak) | |
| S&P/TSX Composite | 24,796.40 | 25,879.25 (new highs) * | (0.4)% | 4.7% | up | up | up | |
| S&P/TSX Venture (CDNX) | 597.87 | 686.66 (new highs) | 2.1% | 14.9% | up | up | up | |
| S&P 600 (small) | 1,408.17 | 1,267.13 | (4.2)% | (10.0)% | up (weak) | down | neutral | |
| MSCI World | 2,304.50 | 2,587.57 (new highs) * | 0.1% | 12.3% | up | up | up | |
| Bitcoin | 93,467.13 | 108,695.44 (new highs) * | 4.9% | 16.3% | up | up | up | |
| Gold Mining Stock Indices | ||||||||
| Gold Bugs Index (HUI) | 275.58 | 397.76 | 8.7% | 44.3% | up | up | up | |
| TSX Gold Index (TGD) | 336.87 | 480.58 | 6.7% | 42.7% | up | up | up | |
| % | ||||||||
| U.S. 10-Year Treasury Bond yield | 4.58% | 452% | 0.9% | (1.3)% | ||||
| Cdn. 10-Year Bond CGB yield | 3.25% | 3.35% | 4.7% | 3.1% | ||||
| Recession Watch Spreads | ||||||||
| U.S. 2-year 10-year Treasury spread | 0.33% | 0.55% | 17.0% | 66.7% | ||||
| Cdn 2-year 10-year CGB spread | 0.30% | 0.65% | flat | 116.7% | ||||
| Currencies | ||||||||
| US$ Index | 108.44 | 99.12 | (2.0)% | (8.6)% | down | down | down | |
| Canadian $ | 69.49 | 0.7283 | 1.7% | 4.8% | up | up | down | |
| Euro | 103.54 | 113.61 | 1.9% | 9.7% | up | up | up | |
| Swiss Franc | 110.16 | 121.82 | 2.2% | 10.6% | up | up | up | |
| British Pound | 125.11 | 135.35 | 1.9% | 8.2% | up | up | up | |
| Japanese Yen | 63.57 | 70.16 | 2.4% | 10.4% | up | up | neutral | |
| Precious Metals | ||||||||
| Gold | 2,641.00 | 3,361.08 | 5.1% | 27.3% | up | up | up | |
| Silver | 29.24 | 33.50 | 3.9% | 14.6% | up | up | up | |
| Platinum | 910.50 | 1,085.00 (new highs) | 10.2% | 19.2% | up | up | up | |
| Base Metals | ||||||||
| Palladium | 909.80 | 995.00 | 3.5% | 9.4% | up | up (weak) | down | |
| Copper | 4.03 | 4.83 | 6.2% | 19.9% | up (weak) | up | up | |
| Energy | ||||||||
| WTI Oil | 71.72 | 61.69 | (1.1)% | (14.0)% | down (weak) | down | down | |
| Nat Gas | 3.63 | 3.31 | (0.3)% | (8.8)% | down (weak) | neutral | neutral | |
A downgrade for the U.S., threats of tariffs against the EU and Apple, and a “Big Beautiful Bill” that will bring endless deficits all conspired to halt the “let’s lower tariffs on China and work something out” rally. As we have noted, straight-up moves are usually not sustainable. Nor for that matter are straight-down moves. But, of course, investors prefer the former. Euphoria returns. Fear turns to greed. Happy days are here again.
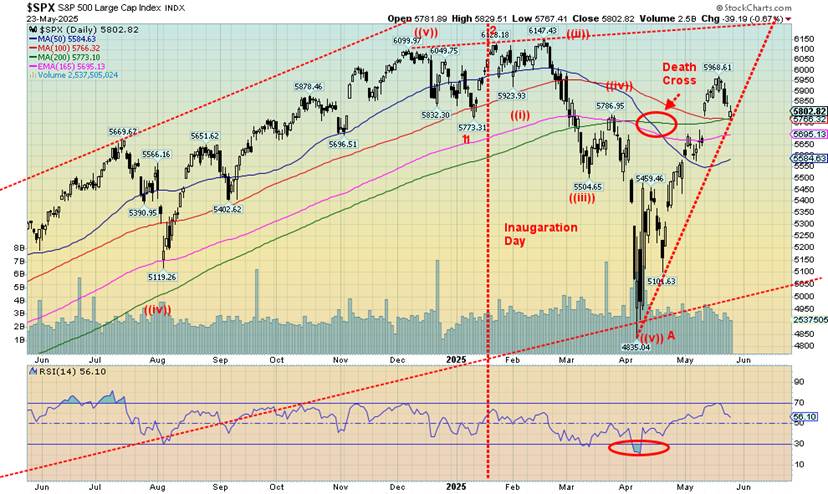
This past week the S&P 500 fell 2.6%, possibly ending the swift rally. We appear to be on the cusp of breaking that uptrend line. The Dow Jones Industrials (DJI) fell 2.5%, the Dow Jones Transportations (DJT) was down 4.1%, and the NASDAQ fell 2.5%. The S&P 400 (Mid) was off 3.6% and the S&P 600 (Small) dropped 4.2%. The S&P 500 Equal Weight Index fell 3.2% while the NY FANG Index was down 1.4%. A better performance from the FAANGs helped prevent a bigger drop for the S&P 500 and NASDAQ. Will it last?
The TSX Composite was off only 0.4%, thanks to Golds and Materials. The junior TSX Venture Exchange (CDNX) actually made 52-week highs, up 2.1%. In the EU, the London FTSE was up 0.4%, the EuroNext fell 1.7%, the Paris CAC 40 was down 1.9%, while the German DAX fell 0.6% after making new all-time highs.
The EU was caught out by the threat of more Trump tariffs if the EU doesn’t do what Trump wants them to do. In Asia, China’s Shanghai Index (SSEC) was off 0.6%, the Tokyo Nikkei Dow (TKN) fell 1.6%, but Hong Kong’s Hang Seng (HSI) rose 1.1%. The MSCI World Index continues to surprise, rising a mere 0.05%, but it rose to new all-time highs. Bitcoin hit new all-time highs, up 4.9%—more to follow on that.
Trump continues to bring new shocks to the market. As we noted in our opener, the real threat is rising interest rates in the bond market with Trump’s “Big, Beautiful Bill” that brings endless deficits and, with it, rising bond yields. The only hope is for the Republican-controlled Senate to block the bill. Don’t count on it. The drop in the credit rating wasn’t an accident. More tariffs continues Trump’s chaotic moves.
The danger points for the S&P 500 are a drop under 5,500, and by the time it’s under 5,400 it’s all over but the crying. Under 5,100, new lows are highly probable assuming the current high of 5,969 holds. Note the death cross is still in play. The huge rebound has done little to turn it back up again. This type of action is not unusual in a bear market. And we entered one after “Liberation Day,” despite the huge rally that followed once the announcement came for the U.S. and China to negotiate. Don’t count on it. With the rise in the market, fear turned to greed, but it could easily turn back to fear once again.
As a side note, Trump promised that only the countries seeing tariffs will pay. However, Trump is already in an open fight with Walmart because they announced they will have to hike prices because of the tariffs. Walmart isn’t the only one. Others announcing price increases are Nike, Subaru, Birkenstock, Mattel, Microsoft, Ford, and Temu. There are others. Inflation, here we come. The Fed cutting interest rates? Not at the moment. The Fed is between a rock and hard place.
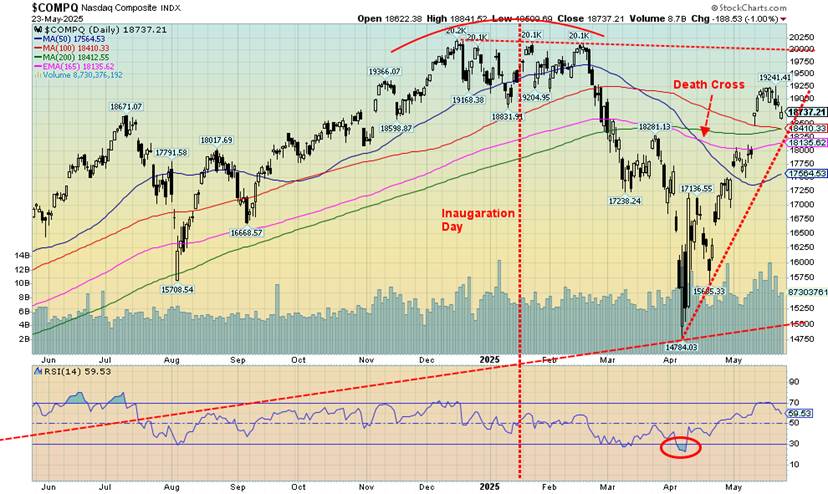
Has the NASDAQ topped? That remains to be seen, but we did drop 2.5% this past week and remain down in 2025 by 3.0%. We are approaching that steep uptrend line from the April low that’s currently near 18,500. A firm break of 18,100 should confirm a top. The danger is a decline under 17,500. Then the bear market is back. The MAG7 and FAANGs actually held in well this past week.
The NY FANG Index was down only 1.4% less than the NASDAQ while MAGS, the MAG7 proxy ETF, fell 2.5%. We saw new all-time highs this past week from Netflix, Microsoft, and Snowflake. Then Netflix and Microsoft finished down on the week. But Snowflake was a big winner, up 9.3%. Apple was clobbered, down 7.6%, thanks to Trump’s threats to put tariffs of 25% on iPhones made outside the U.S. Not surprisingly we note that Samsung also fell (Samsung trades on the South Korea Seoul Stock Exchange).
Tesla lost 3.0%. However, Google gained 1.3%, the only MAG7 stock to post a gain. The up move from the Liberation Day sell-off is too steep. It is not sustainable. The question now is, will it end badly and fall as swiftly as it went up? Or will it form some sort of top first before breaking down? A return under 18,400 would be negative.
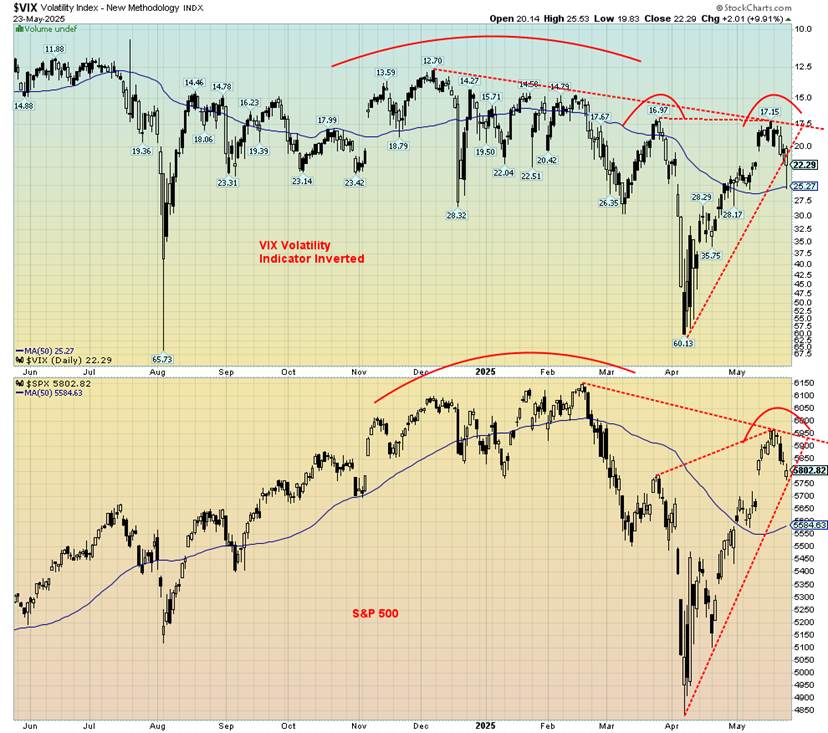
As the stock market rolled over this past week, the VIX Volatility Indicator (Inverted) also rolled over. While the S&P 500 is still testing its uptrend line, the VIX appears to have broken it. Is the VIX leading? So far, the 50-day MA is holding things up while the S&P 500 still has to fall to 5,584 to reach its 50-day MA. Nonetheless, we are intrigued by what appears to be forming wedge triangles. If that’s correct, that is not a good sign.
Source: www.stockcharts.com
The race continues and gold is still leading up 24.3% since Inauguration Day. Virtually all others turned down this past week as the U.S. was downgraded and Trump is threatening to escalate his tariff wars. As has been said, gold is money and everything else is credit. But what is Bitcoin? It’s not money. It’s speculation.
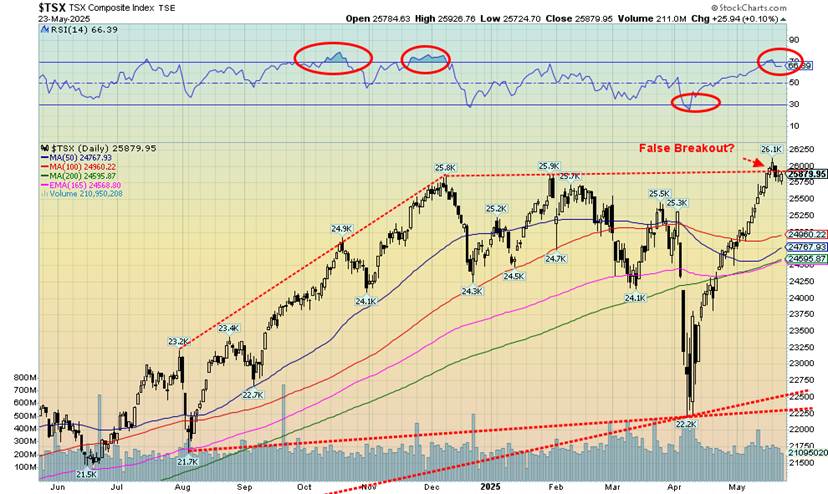
Happy days are here again! Well, maybe. The TSX Composite leaped to new all-time highs this past week—barely. Then it turned down and closed the week down 0.4%. A reversal but not a key one. The TSX Venture Exchange (CDNX) also made new 52-week highs (its all-time high is a distant memory), but it held as the CDNX was up 2.1% this past week, one of the few with gains. Five of the 14 sub-indices were up on the week. The usual suspects were the gainers as Golds TGD jumped 6.7%, Materials TMT was up 5.3%, and Metals & Mining TGM gained 3.3%. Not to be left behind, groceries gained as the TSX Consumer Staples TCS was up 1.4%.
TSX Utilities TUT was the only other gainer, a small 0.1%. Leading the way down was Health Care THC, off 4.8%. THC can’t get a break as it remains the worst-performing sector, down 27.1% in 2025 while the TGD leads the way up with a gain of 42.7% in 2025. The falls came despite new all-time highs for a few. Consumer Discretionary TCD was one, but it closed down 1.7%. Financials TFS also made new highs but closed down 0.5%. Industrials TIN joined the party, then fell 1.8%. The reversals were not a good sign.
It is possible the breakout to new highs for the TSX is a false breakout. The rise has been so steep it’s hard to tell where we would confirm a top. But under 25,000 is not good. Under 24,400 things are definitely not looking up. Note the increase in volume when the TSX was falling after Liberation Day. Now volume has fallen off.
Canada Inflation Rate vs. Core Inflation Rate 2020–2025
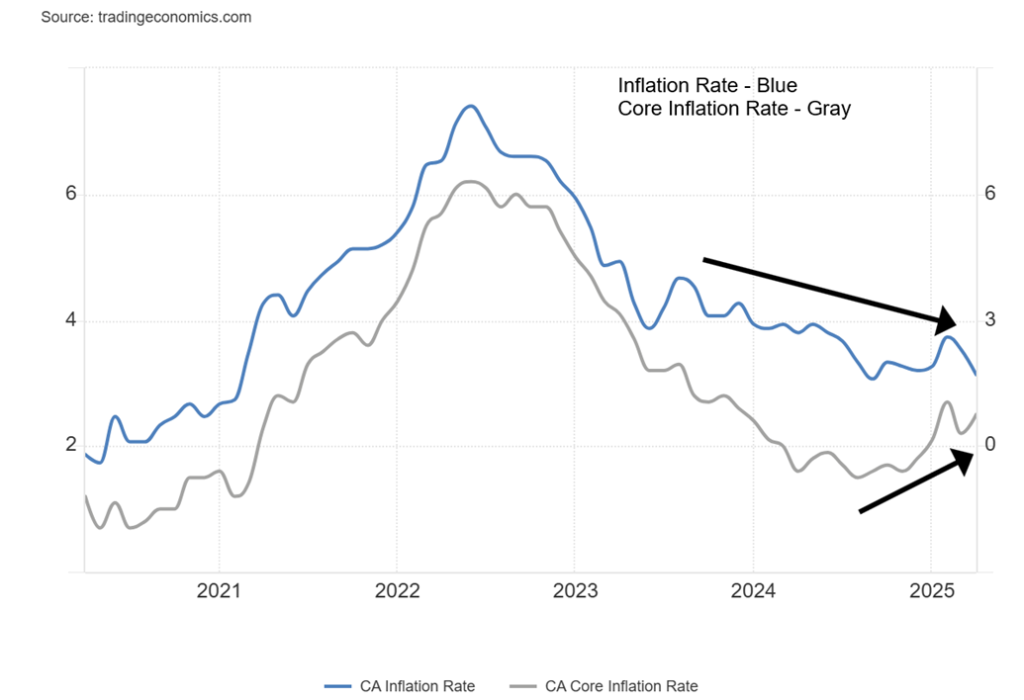
Is it an oopsy? A mistake? Probably not. Canada’s inflation rate fell this past month to 1.7% year over year (y-o-y), thanks to the carbon tax being eliminated and gas prices falling. Leading the downward move was, yes, oil and natural gas. Even grocery prices fell a bit. But hold on. The core inflation rate rose.
The core excludes food and energy; i.e. oil, natural gas, and groceries. So, thanks to a fall in food and energy, the inflation rate fell. But for everything else it went up. The tariff effect? The inflation rate has been in a downward trend now for months since it peaked in 2022. But the core? It has been rising since bottoming in 2024. The oh-oh is what happens when food and energy start rising again?
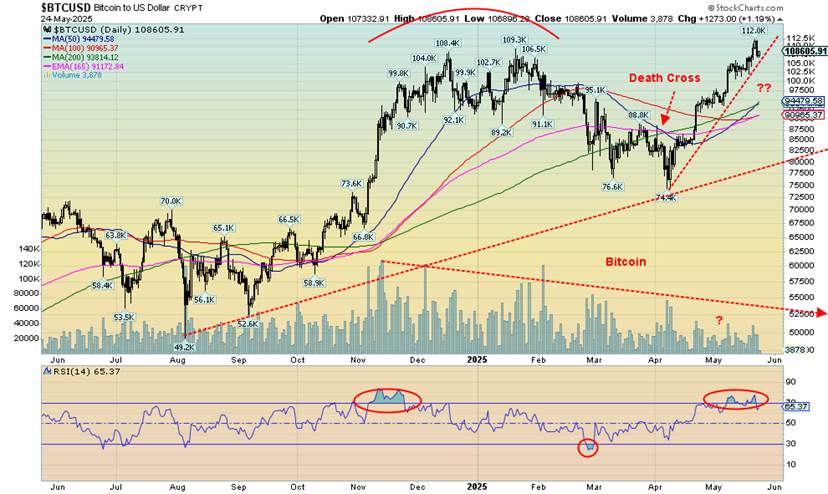
Bitcoin hit a new all-time high this past week on a wave of euphoria over the launch of Trump-backed crypto funds, his easing of the China tariffs, and even the U.S. downgrade as investors sought a so-called safe haven. Bitcoin as safe haven? For something intangible that still engenders scams, money laundering, and fraud? We’re not even sure Trump’s dinner celebrating the Trump meme coin can really save those who have invested in this.
With a market cap of $2.2 trillion, Bitcoin represents 65% of all the cryptocurrency market. We couldn’t help but notice the sharp decline in volume as Bitcoin roared to new all-time highs. It’s certainly not what was seen last November and is not a good sign. Will Bitcoin continue to make new all-time highs? We wouldn’t bet on it. Falling volume as you make those new highs is not a good sign.
Trump Meme Coin 2025
Yes, that’s quite some ride. Trump issues a meme coin. Millions (billions?) were spent buying it and the price soared from $24.60 to a high of $75.95 overnight. Wow! Up 300%. Halleluiah! Investors instantly enriched. Trump’s family collects millions in fees. Then, oops. Maybe not such a good idea after all. Last priced at $12.92, that’s a drop of 83% from that frothy high. The coin was issued three days before Inauguration Day.
There were a billion coins, of which 800 million were taken up by Trump family-controlled entities. It apparently netted some $350 million through sales and fees for the Trump family. Trump even pumped his own coin. Melania also issued a meme coin, which hasn’t done as well. It’s down 96% from its high. But someone got rich quick. Trump held a dinner for the large holders of his coin. Wonder how many bought at or near the top. But even at the initial issuance we’re down 50%. The top 25 investors got a personal meeting with Trump. However, we heard the food at the dinner was lousy. Kind of like the Trump meme coin. Except for those who got rich off it, of course.
U.S. 10-year Treasury Note, Canada 10-year Bond CGB
There is little point in belabouring the rise in interest rates. The U.S. 10-year Treasury note went from 4.48% to 4.52% this past week. On December 31, 2024, the rate was 4.58%, but early moves by Trump taken as positive saw the rate fall to 3.99% around Liberation Day. After that, the threat of tariffs hiked the risk factor and bond yields rose. We expect new highs above 4.82% (the high just before Inaugaration Day) to be exceeded soon. Threats of more tariffs. Threats of budget deficits forever, thanks to the “Big, Beautiful Bill,” waning desire to hold U.S. treasuries, and an auction of 20 years that was a flop all conspired to raise interest rates.
The Fed controls the short end of the market. The bond market controls the long end of the market and they are not amused. Signs of economic weakness are there but they are not as yet a storm. Unemployment is not rising substantially and the weekly claims, while rising, are still low. Existing home sales fell, but new home sales rose. The S&P global manufacturing indices are still above 50, suggesting growth, not recession.
Will this week tell? It’s the last week of May and out this week are house prices, the Conference Board’s Consumer Confidence Index (expected down), PCE prices (expected up), personal spending and income (expected down), the Chicago PMI (expected to be up slightly but still recessionary), and the Michigan Consumer Sentiment Index (expected down).
In Canada, the 10-year Government of Canada bond (CGB) leaped to 3.35% from 3.20%. Higher core inflation did the trick. The 2–10 U.S. spread rose to 55 bp from 47 bp, suggesting we are getting closer to a recession. In Canada, the 2–10 spread was unchanged at 65 bp. Bond rates have broken out, while prices on bonds (that move inversely to yields) are falling. Not a good sign. Could we see a 5% 10-year? The 30-year U.S. Treasury bond is already over 5% in the danger zone.
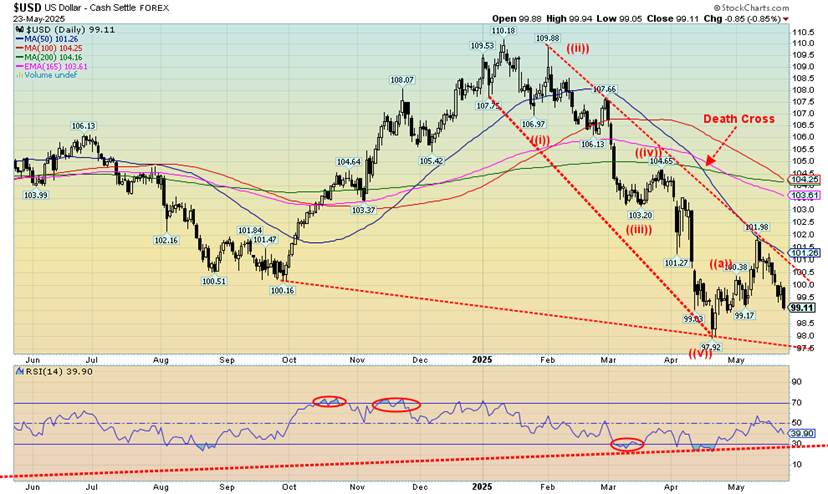
The US$ Index appears to be resuming its downtrend. It failed at that 50-day MA, currently near 101.25. The high was 101.98. We’ve taken out that low at 99.17. All that remains is the low at 97.92, although a breakdown under 97.50 would be more concerning. As we have already pointed out, tariffs, deficits, political uncertainty, and deep polarization all conspire to discourage owning U.S. dollars. Tourism, a source of U.S dollar demand, is falling like rock.
A move back over 101 might encourage a possible run-up to 103 resistance. But it would still be temporary, a bear market rally. The US$ Index fell almost 2% this past week. The Canadian dollar was up 1.7%. As well, the euro gained 1.9%, the Swiss franc was up 2.2%, pound sterling was up 1.9%, and the Japanese yen gained 2.4%. The vote on the U.S. and Trump since Inauguration Day? The US$ Index has fallen 9.4%. Kind of like the fall in Trump’s approval ratings.
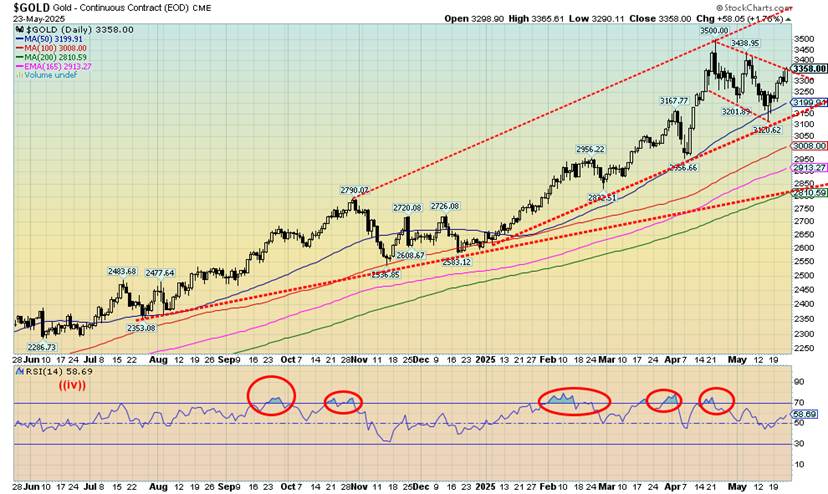
Nothing like a debt downgrade and threats of more tariffs to get gold to leap again. Add in the “Big, Beautiful Bill” and its threats of deficits to the outer edges of space (maybe it’s going to where no man has gone before). We have once again added a good reason to own gold. Repeat the mantra. Gold has no liability. It is a safe haven in times of geopolitical tensions, economic uncertainty and political uncertainty, and loss of faith in government.
No wonder gold is up 27.3% in 2025, including a gain of 5.1% this past week. The previous week’s decline for gold was just a breather. If that potential bull flag formation is accurate, then a breakout over $3,375 could propel us to new highs with targets up to $3,740. The fly in the ointment is a breakdown under $3,150 instead. We are not expecting that. However, given we are in a period of seasonal weakness, we might not fully break out until around mid-June. Ideally, it is a higher low above $3,120.
Silver gained 3.9% this past week and its lagging gold continues to be a source of frustration and a warning sign. Platinum came alive, jumping to fresh 52-week highs, up 10.2%. Apparently, above-ground supplies are very low. Of the near precious metals, palladium gained 3.5% and copper was up 6.2%. We like copper leading. The gold stocks jumped with the Gold Bugs Index (HUI) up 8.7% and the TSX Gold Index (TGD) up 6.7%. But gold is the center of attention.
Even fund managers indicate it might be wise to hold a bit of gold in portfolios. The latest recommendation is at least 5%. In general, gold trades inversely to stocks.
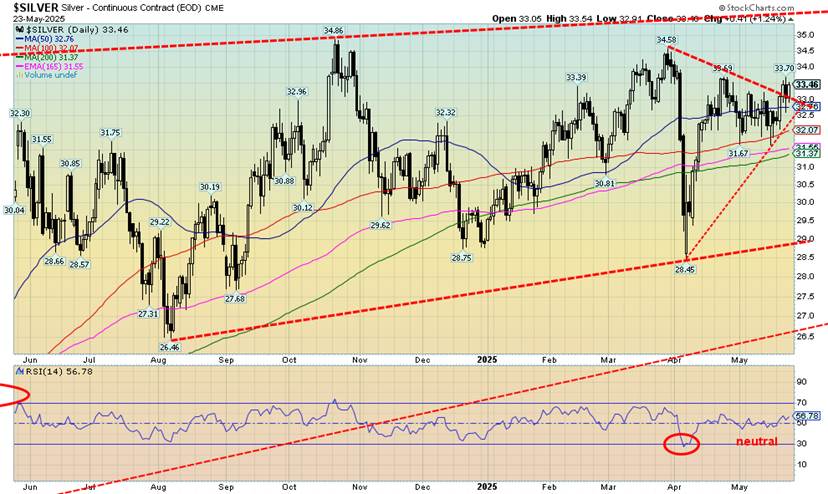
Silver’s performance continues to be frustrating. We want silver to lead, not to follow reluctantly. Okay, we know that there is a lot of demand for silver, particularly for solar panels. So, we’ve speculated that the price may be being held back so as to not allow the costs to get out of hand. Others have noted that the gold/silver ratio is way out of whack (last at 100.37). If the ratio over 70 suggests silver is cheap and gold expensive, then over 100 is rare, suggesting gold is expensive and silver super cheap. Anytime the ratio went over 100 it didn’t remain there for long.
And it’s only happened three times since 1970: first in 1991, second in 2020 during the pandemic panic, and now. None have lasted for very long. The odds of this one lasting are slim to none. Central banks have been on a gold-buying spree. However, that sustained demand is not expected to last. Where gold goes, silver usually follows. But then silver is often the leader in both up and down markets. In the 2008–2011 gold rush, gold gained 280% but silver was up 587%. The gold/silver ratio fell from 92 to 31. A gold/silver ratio over 100 won’t last.
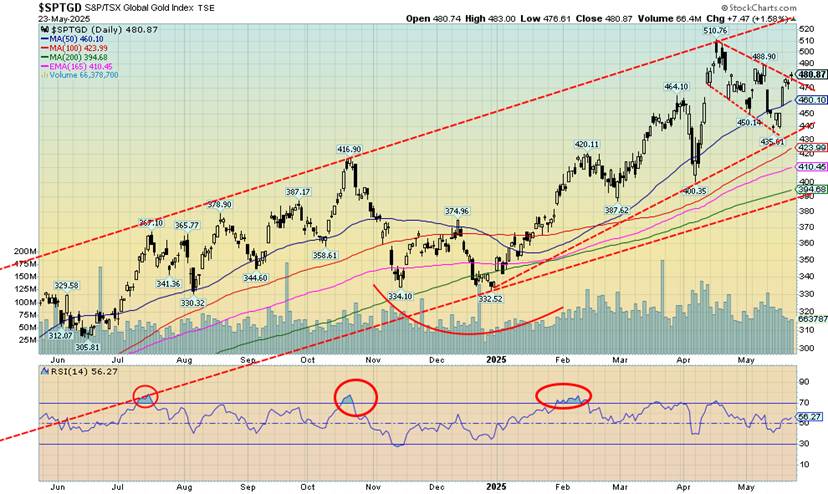
Thanks to safe haven gold-buying, the gold stocks rebounded from the previous week’s sharp pullback. The TSX Gold Index (TGD) was up 6.7% this past week while the Gold Bugs Index (HUI) jumped 8.7%. Both are now back over 40% for the year with the TGD up 42.7% and the HUI up 44.3%. If you are a gold bug, it’s been a happy year. Since 2000, gold is the best performer, up 1,068% (not counting any cryptos). The S&P 500, thanks to the dot.com and financial sub-prime crashes, is up only 295%. The gold stocks have not quite followed gold itself, but nonetheless the TGD is up 456% and the HUI up 434% since 2000.
Silver is a disappointing laggard but still up 519%. We had noted that the TGD may be forming a bull flag since that last top at 510 in April. After that the TGD fell about 15% but has now rallied back 10.5%. It appears to be breaking that flag formation, but obviously we can’t confirm that just yet. If it is correct, then targets could be up to at least 550. The caveat is that the last low at 435 holds. Major support is down at 395. The past week was positive. Now we need follow through to the upside. But, like gold, our expectations are still for a low in June.
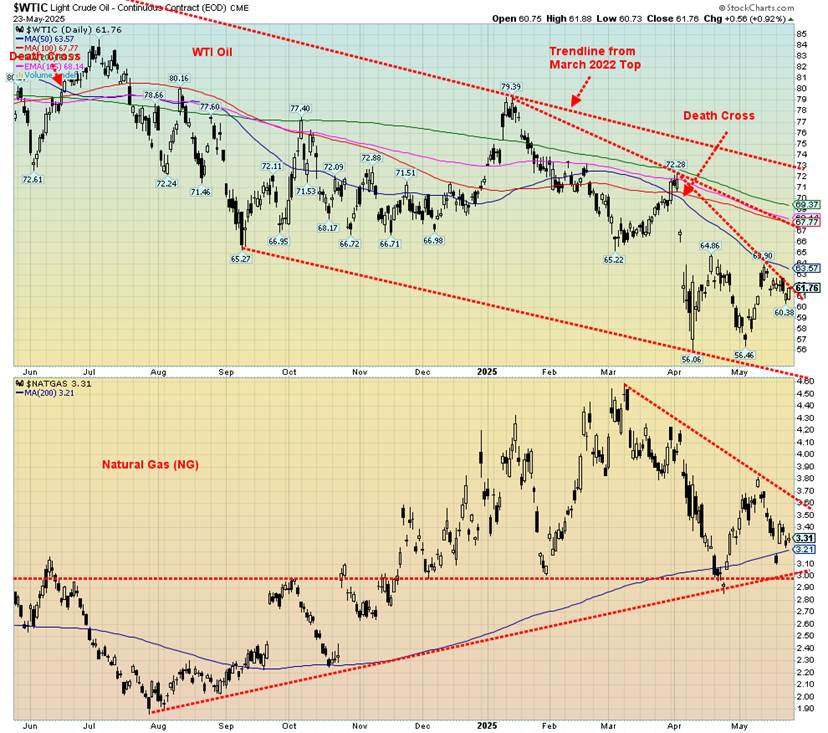
Trump just can’t stop issuing tariff threats. Now come threats against the EU of 50% tariffs and against Apple of 25% tariffs if they don’t move their manufacturing of iPhones to the U.S. (Note: you can’t do that overnight). Anyway, all are deemed to be negative to economic growth and lower economic growth means oil prices fall. So down we went, with WTI oil falling 1.1% this past week while Brent crude was off 0.5% as threats remain in the Middle East, particularly against Iran, a major oil and gas producer (but under heavy sanctions)
Natural gas (NG) also fell 0.3%, mostly because of anticipated demand declines. But no worries. Hurricane season is right around the corner. NG at the EU Dutch Hub rose 3.9%, because of outages due to maintenance at a large Norwegian field. However, some pressure looms as the Russia/Ukraine talks are going nowhere. The energy stocks fell with the ARCA Oil & Gas Index (XOI) down 4.1% while Canada’s TSX Energy Index (TEN) was off 0.8%.
Nothing has changed. WTI oil needs to break over $63.50 to suggest a low and over $68 to confirm a low. As well, it needs to break over $73 to suggest a new uptrend is underway. NG could be making a bottom here. But we’d need to break over $3.60 to suggest one is in.
Copyright David Chapman 2025
__
(Featured image by Jakub Żerdzicki via Unsplash)
DISCLAIMER: This article was written by a third party contributor and does not reflect the opinion of Born2Invest, its management, staff or its associates. Please review our disclaimer for more information.
This article may include forward-looking statements. These forward-looking statements generally are identified by the words “believe,” “project,” “estimate,” “become,” “plan,” “will,” and similar expressions. These forward-looking statements involve known and unknown risks as well as uncertainties, including those discussed in the following cautionary statements and elsewhere in this article and on this site. Although the Company may believe that its expectations are based on reasonable assumptions, the actual results that the Company may achieve may differ materially from any forward-looking statements, which reflect the opinions of the management of the Company only as of the date hereof. Additionally, please make sure to read these important disclosures.
David Chapman is not a registered advisory service and is not an exempt market dealer (EMD) nor a licensed financial advisor. He does not and cannot give individualised market advice. David Chapman has worked in the financial industry for over 40 years including large financial corporations, banks, and investment dealers. The information in this newsletter is intended only for informational and educational purposes. It should not be construed as an offer, a solicitation of an offer or sale of any security. Every effort is made to provide accurate and complete information.
However, we cannot guarantee that there will be no errors. We make no claims, promises or guarantees about the accuracy, completeness, or adequacy of the contents of this commentary and expressly disclaim liability for errors and omissions in the contents of this commentary. David Chapman will always use his best efforts to ensure the accuracy and timeliness of all information. The reader assumes all risk when trading in securities and David Chapman advises consulting a licensed professional financial advisor or portfolio manager such as Enriched Investing Incorporated before proceeding with any trade or idea presented in this newsletter.
David Chapman may own shares in companies mentioned in this newsletter. Before making an investment, prospective investors should review each security’s offering documents which summarize the objectives, fees, expenses and associated risks. David Chapman shares his ideas and opinions for informational and educational purposes only and expects the reader to perform due diligence before considering a position in any security. That includes consulting with your own licensed professional financial advisor such as Enriched Investing Incorporated. Performance is not guaranteed, values change frequently, and past performance may not be repeated.


TopRanked.io Weekly Affiliate Digest: What’s Hot in Affiliate Marketing [Bovada Affiliate Program]
This week, we're mashing up 80s tech with 2020s private messaging apps. Why? Because Big Tech just dropped a big...


Euro Stablecoins Struggle to Compete with Dollar Dominance in Crypto Markets
Euro stablecoins remain marginal despite the euro’s global importance, with minimal trading volume compared to dollar rivals like USDT and...


Gilead Sciences Advances Growth Strategy with Focus on HIV, Oncology, and Innovation
Gilead Sciences focuses on developing treatments for HIV, cancer, and inflammatory diseases, driven by blockbuster drugs like Biktarvy. Growth relies...

Casablanca Stock Exchange Profits Surge in 2025 as Growth Momentum Strengthens
In 2025, Casablanca Stock Exchange profits rose 40% to MAD 50.9 billion. Net income grew 22.3%, driven by strong industrial...


Credibur Scales Rapidly: €2 Billion in Structured Debt Facilities in Six Months
Infrastructure fintech Credibur has added over two billion euros in structured debt facilities within six months. Its platform connects lenders,...
 |
|
 |  |
 |
|
-

 Fintech1 week ago
DZ Bank Pioneers Blockchain Bond Issuance, Advancing Tokenized Finance
-

 Markets4 days ago
Cotton Prices Rise Amid War Tensions, Weather Risks, and Supply Concerns
-

 Biotech2 weeks ago
Italy’s Pharmaceutical Sector Drives Innovation, Sustainability, and European Leadership
-
 Biotech16 hours ago
Gilead Sciences Advances Growth Strategy with Focus on HIV, Oncology, and Innovation