Markets
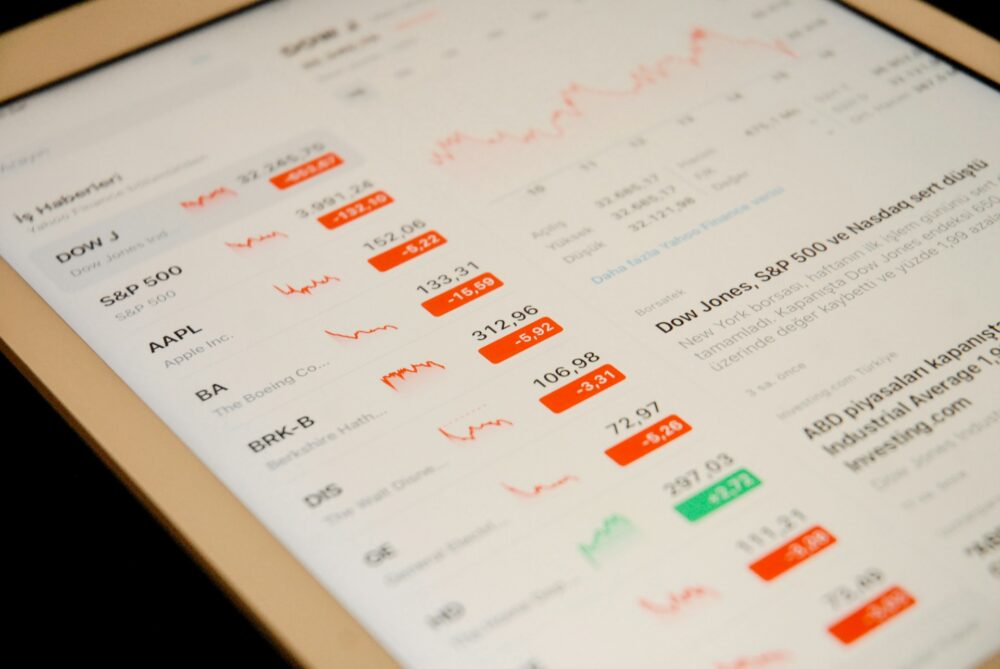
Markets Volatility Persists as Focus Shifts to Fed’s Upcoming Rate Cut Decision
Market volatility persists after a recent upswing, with focus shifting to the Fed’s rate cut decision—either 25 or 50 basis points. Recession concerns grow as the yield curve normalizes after a long inversion. Expectations of a soft landing dominate, but global tensions and a divided U.S. election leave uncertainty about potential outcomes.
With the U.S. debates now in the rear-view mirror, we can go back to focusing on the markets. The odds of another debate before the November 5 election appear to be slim to none. Pundits, for the most part, declared VP Kamala Harris the winner and polls appear to be firming up in her favour. However, a reminder that Democrats received the most votes in the 2000 and 2016 elections and lost. Votes in 2008, 2012, and 2020 were firmly in favour of the Democrats and they won. Winning the most votes does not guarantee a win as the electoral college is the final arbitrator, as they found out in 2000 and 2016.
Regardless of who wins the election, they face a slowing U.S. economy by a number of measurements. But a recession? Many believe it will be a soft landing or even a no landing. A few Cassandras are still predicting a hard landing. 1980 saw a soft-landing recession when the official recession lasted only six months with peak unemployment at 7.8%, even as GDP fell by 2.2%.
The 1980 recession was sparked when Fed Chair Paul Volcker hiked interest rates to unheard-of levels to bring down the inflation of the 1970s. After a short respite, the 1981–1982 recession turned hard as the price of oil soared due to the Iranian revolution. Interest rates, which had moderated somewhat, rose again. This time the recession lasted officially one year and four months as GDP retracted 2.7% and unemployment peaked at 10.8%.
Sharply rising oil prices were behind the hard-landing recessions of 1973–1975, the aforementioned 1981–1982 recession, the 1990–1991 recession, and even the 2007–2009 recession. Yes, a reminder that oil prices soared at the time to a peak of $147, even as the prime reason for the recession was the collapse of the sub-prime mortgage market. Despite scares in 1987, 1997and 1998, no recession followed as oil prices had not spiked.
Oil prices did rise before the 2001-2002 recession, but rising oil prices were not the cause of the recession. With oil prices currently suppressed and trading under $70, the odds of a recession right now appear slim. Add in that inflation is also coming down (recent CPI +2.5% vs. 2.9% year over year [y-o-y] and PPI +1.7% vs. +2.1%) and we have the expected 25 bp rate cut at next week’s FOMC.
Unemployment is rising (latest 4.2% vs. 4.3%, up from 3.7%) and weekly claims are also rising (latest 230K vs. 228K but within expectations). But neither unemployment nor weekly claims are at dire levels, yet. Wage growth has slowed but is still above pre-pandemic levels. Job openings and hiring plans have slowed but still remain relatively robust. GDP growth is still happening (latest Q2 2024 +3.1% y-o-y vs. 2.9% Q1 2024).
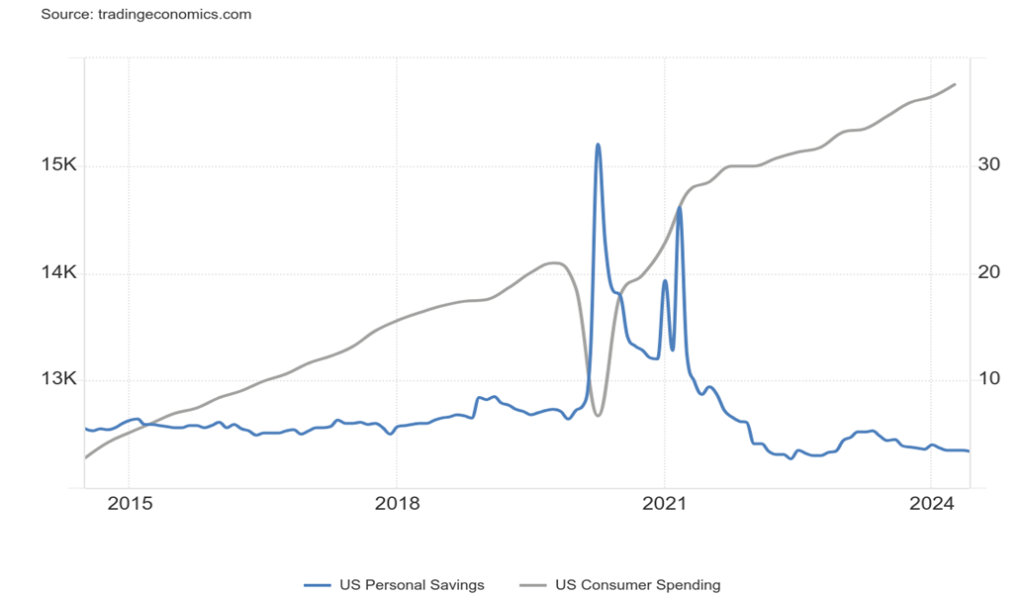
The U.S. remains the world leader in GDP growth for the advanced economies. Wage growth, last at 3.8%, remains above pre-pandemic growth. Consumer spending appears to be rising, not falling, and business bankruptcies are slowing to some extent, although they are still up sharply y-o-y. What’s concerning is the falling personal savings rate. Consumers appear to be digging into savings to spend.
Rising Consumer Spending vs. Falling Personal Savings Rate 2014–2024
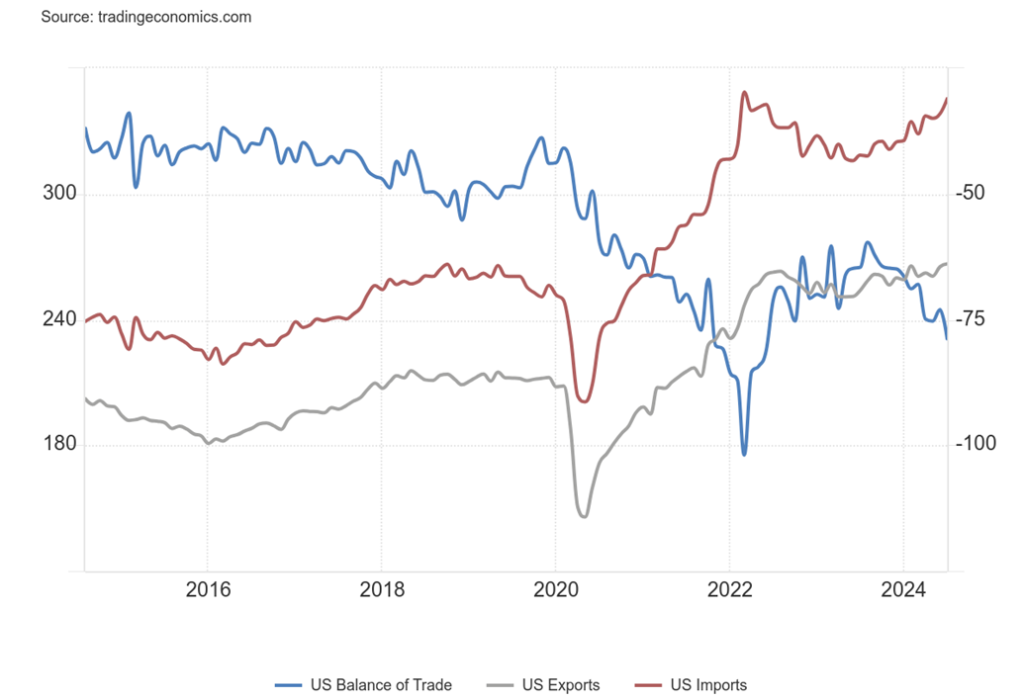
Despite a still high US$ Index, U.S. exports recently hit an all-time high. Imports are slowing somewhat but still remain robust. The trade balance, after falling, peaked in August 2023. Since then, the trade deficit has been rising again but remains above the lows of 2022. The US$ Index is now, however, in breakdown mode, suggesting that exports could improve while imports moderate. A falling US$ Index is quite positive for gold, which hit new all-time highs once again.
U.S. Balance of Trade, Exports, Imports 2014–2024
So far, there are few signs that we are about to fall into a recession. Sharply rising oil prices could change the scenario; e.g. escalated war, involving Iran. Consumer sentiment remains mutant and the debt levels are far too high. The risk of a debt accident that could change the picture remains. The yield curve is beginning to revert after years of inversion.
This has often been a precursor to a recession. The lengthy period of an inverted yield curve ultimately suggests a hard landing, not a soft one. But so far, we are not seeing any strong signs of an impending recession. Can that continue?
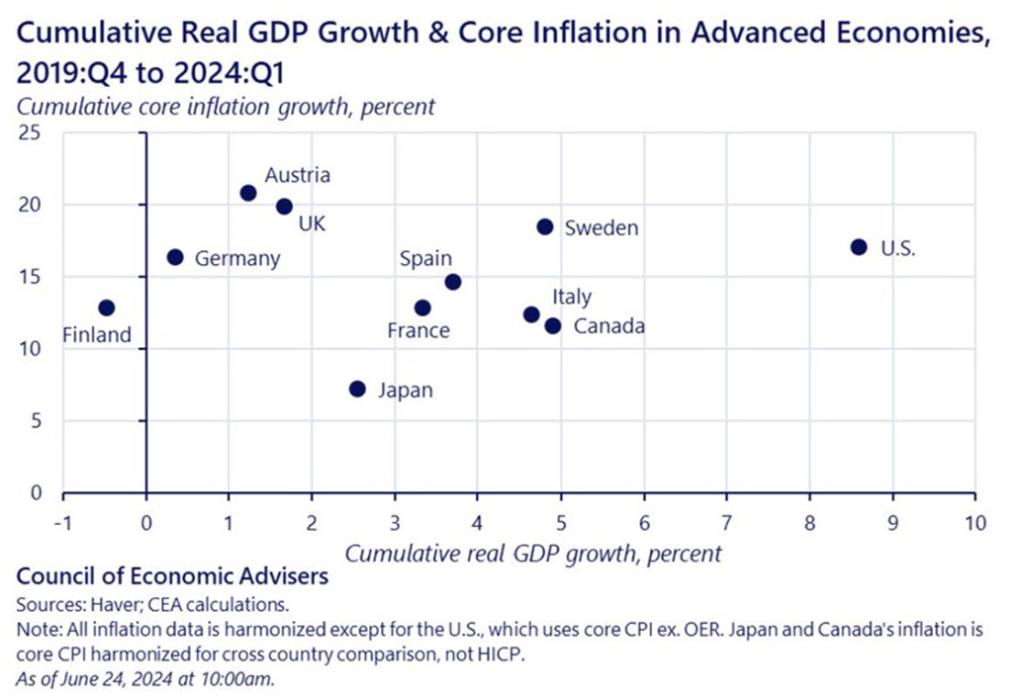
Yes, note how the U.S. is far outpacing other Western economies. Not even close. Recession, what recession?

University of Michigan Consumer Sentiment, U.S. Consumer Inflation Expectations 2014–2024
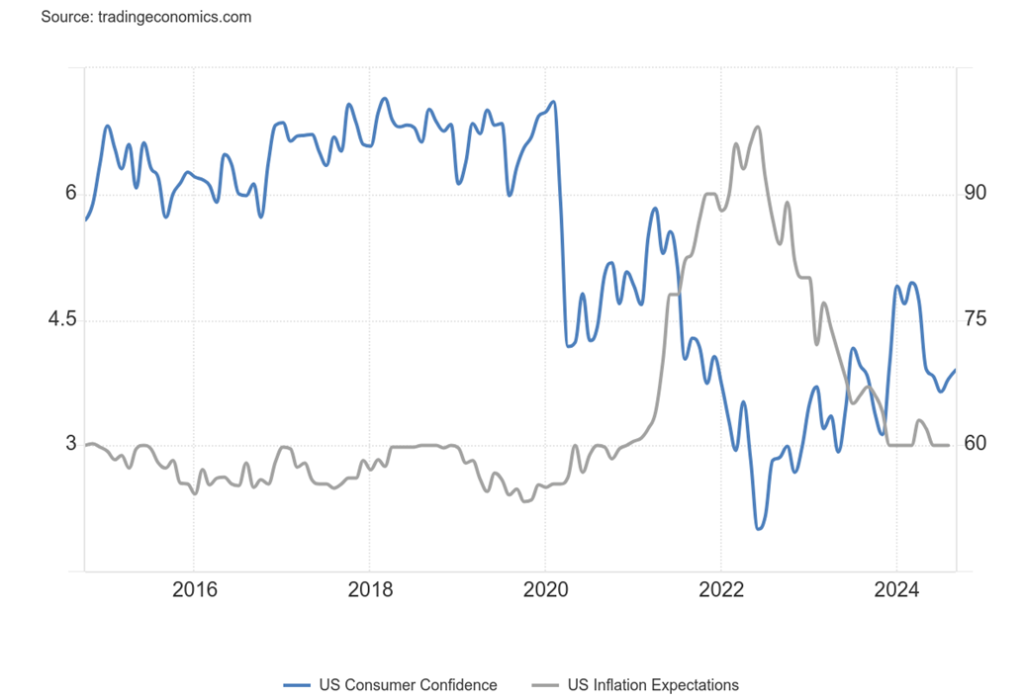
Yes, seems counter intuitive but consumer sentiment is improving while consumer inflation expectations. The goldilocks economy? Can it continue?
Chart of the week
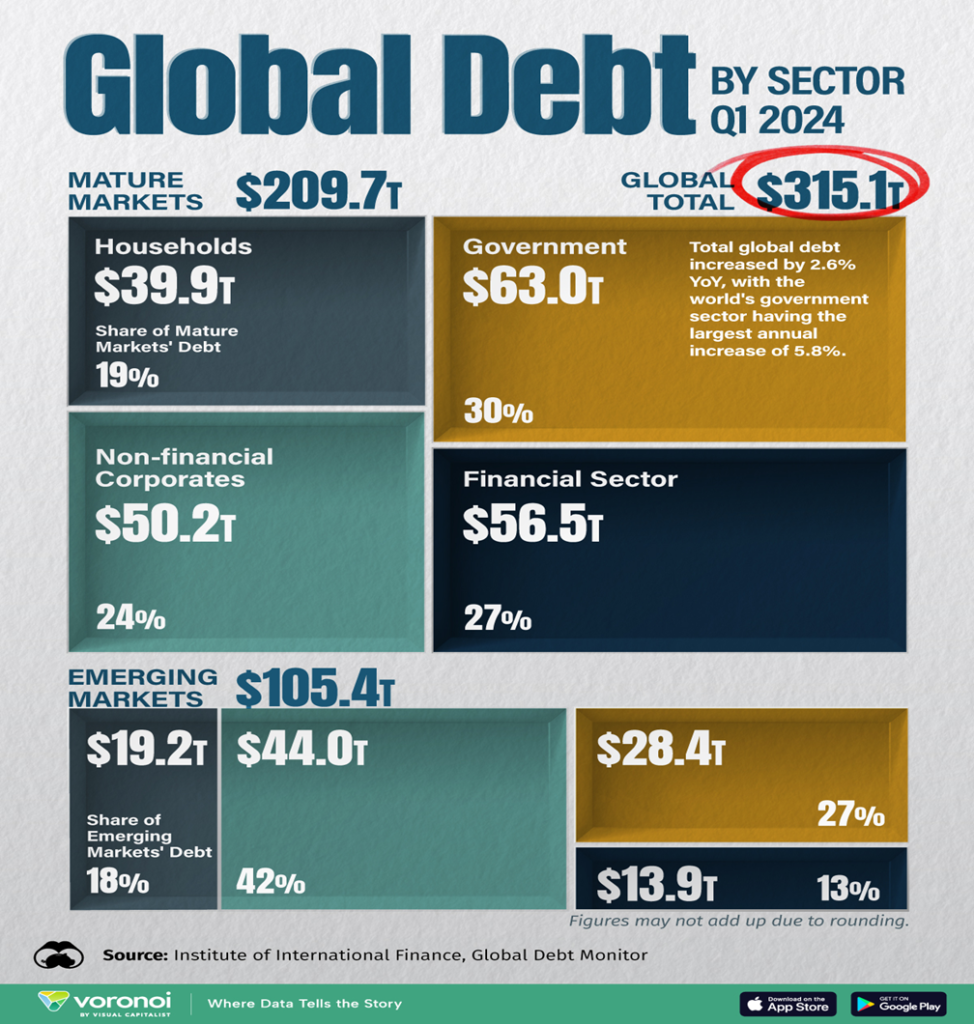
Yes, it’s another record for global debt. The U.S. is at $101.9 trillion ($39.1 trillion government, $25.6 trillion household, and $37.2 trillion corporate) or 32% of global debt. Despite mature markets holding the most debt, it’s the emerging market debt that remains the most vulnerable to defaults. The most vulnerable? The list includes Ukraine, Egypt, Jamaica, Sri Lanka, Tunisia, Argentina, Ghana, Kenya, Pakistan, Belarus, Ethiopia, Greece, Nigeria, Lebanon, Venezuela, El Salvador, and Ecuador. Technically, Russia is already in default but it is an artificial default triggered by sanctions on Russia by the U.S. and blocking them from the SWIFT international payments system.
In 2008 before the financial crisis broke, global debt was only around $140 trillion. It has more than doubled since. It’s a significant vulnerability that can’t be ignored. Another reason why gold is soaring.
Markets & Trends
| % Gains (Losses) Trends | ||||||||
| Close Dec 31/23 | Close Sep 13, 2024 | Week | YTD | Daily (Short Term) | Weekly (Intermediate) | Monthly (Long Term) | ||
| Stock Market Indices | ||||||||
| S&P 500 | 4,769.83 | 5,626.02 | 4.0% | 18.0% | up | up | up | |
| Dow Jones Industrials | 37,689.54 | 41,393.78 | 2.6% | 9.8% | up | up | up | |
| Dow Jones Transport | 15,898.85 | 15,729.61 | 2.0% | (1.1)% | up | up | up | |
| NASDAQ | 15,011.35 | 17,683.98 | 6.0% | 17.8% | up | up | up | |
| S&P/TSX Composite | 20,958.54 | 23,568.65 (new highs)* | 3.5% | 12.5% | up | up | up | |
| S&P/TSX Venture (CDNX) | 552.90 | 580.43 | 6.5% | 5.0% | up | neutral | down | |
| S&P 600 (small) | 1,318.26 | 1,384.04 | 3.4% | 5.0% | up | up | up | |
| MSCI World | 2,260.96 | 2,415.44 | flat | 6.8% | up | up | up | |
| Bitcoin | 41,987.29 | 59.676.5 | 10.7% | 42.1% | neutral | neutral | up | |
| Gold Mining Stock Indices | ||||||||
| Gold Bugs Index (HUI) | 243.31 | 328.60 (new highs) | 12.0% | 35.1% | up | up | up | |
| TSX Gold Index (TGD) | 284.56 | 377.82 (new highs) | 9.6% | 32.8% | up | up | up | |
| % | ||||||||
| U.S. 10-Year Treasury Bond yield | 3.87% | 3.66% | (1.4)% | (5.4)% | ||||
| Cdn. 10-Year Bond CGB yield | 3.11% | 2.92% | (1.7)% | (6.1)% | ||||
| Recession Watch Spreads | ||||||||
| U.S. 2-year 10-year Treasury spread | (0.38)% | .07% | 16.7% | 118.4% | ||||
| Cdn 2-year 10-year CGB spread | (0.78)% | (0.05)% | 37.5% | 93.6% | ||||
| Currencies | ||||||||
| US$ Index | 101.03 | 101.11 | flat | 0.1% | down | down | neutral | |
| Canadian $ | 75.60 | 73.59 | (0.1)% | (2.7)% | neutral | neutral | down | |
| Euro | 110.36 | 110.75 | 0.3% | 0.3% | up | up | up (weak) | |
| Swiss Franc | 118.84 | 117.80 | (0.7)% | (0.9)% | up | up | up | |
| British Pound | 127.31 | 131.23 | flat | 3.1% | up | up | up (weak) | |
| Japanese Yen | 70.91 | 70.97 | 1.0% | 0.1% | up | up | down (weak) | |
| Precious Metals | ||||||||
| Gold | 2,071.80 | 2,610.70 (new highs)* | 3.4% | 26.0% | up | up | up | |
| Silver | 24.09 | 31.07 | 10.3% | 29.0% | up | up | up | |
| Platinum | 1,023.20 | 1,006.80 | 9.6% | (1.6)% | up (weak) | up (weak) | neutral | |
| Base Metals | ||||||||
| Palladium | 1,140.20 | 1,071.00 | 19.2% | (6.1)% | up | up (weak) | down | |
| Copper | 3.89 | 4.24 | 4.1% | 8.9% | up | neutral | neutral | |
| Energy | ||||||||
| WTI Oil | 71.70 | 68.65 | 1.5% | (4.4)% | down | down | down | |
| Nat Gas | 2.56 | 2.31 | 1.8% | (9.8)% | up | neutral | down | |
New highs/lows refer to new 52-week highs/lows and, in some cases, all-time highs.
- * New All-Time Highs
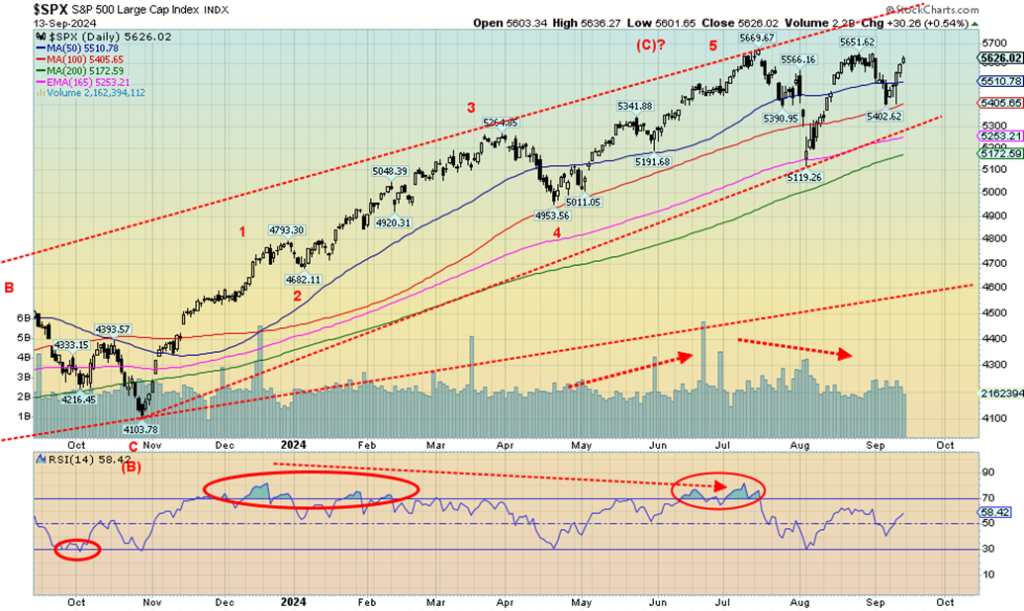
Is volatility in markets becoming the new fact of life? Since peaking in mid-July, U.S. stock markets began a swift three-week decline followed by a reversal to the upside for the next three weeks. After failing to exceed the July high, the S&P 500 fell 4.2% two weeks ago, then reversed again and this past week gaining 4%. What will this coming week bring, given that the Fed is poised to lower interest rates? The big question is whether they will cut 25 bp as many expect or go all out and cut 50 bp as some are now expecting. The sudden interest in a 50 bp cut sparked gold higher and helped the stock markets go higher. But so far, for almost two months, we have seen no new highs, save the commodities-dominated TSX Composite.
Worse, the NASDAQ and Mag 7 have been anything but stellar for the past couple of months. The NASDAQ’s selloff from the July high was sharper than it was for the rest of the market. The rebound was feebler and, if the high of this past week holds, the NASDAQ could be making another lower high. A downtrend is underway. On the surface, however, the past week seemed to challenge the thought that we have peaked. Nonetheless, we didn’t, despite a 4.0% gain for the S&P 500 (SPX).
The Dow Jones Industrials (DJI) wasn’t quite as robust, rising 2.6%. The Dow Jones Transportations (DJT) was up about 2% but remains down 1.1% on the year, the only major index in the red. The NASDAQ had a healthy 6.0% gain, led as usual by the Mag 7 and the FAANGs. Leading the way was Broadcom, up 22.4%, followed by Nvidia, up 15.8%. Still, Nvidia is down 15.4% from a top seen in April 2024. At its low in early August Nvidia was down almost 36%, a bear market. Stars rise, then they fall.
The smaller cap stocks did rise. The S&P 400 (Mid) was up 3.2% while the S&P 600 (Small) rose 3.4%. Both indices remain down from their highs. The NY FANG Index rose 7.9%, thanks to Nvidia and Broadcom. Advanced Micro (AMD) also had a good week, up 13.4%. Nonetheless, they saw no new highs. Despite a 2.7% gain on the week, the S&P 500 Equal Weight Index also remains below its all-time high.
Will they all recover and go once again to all-time highs? That’s not likely as we had already received a number of sell signals from the indicators and numerous negative divergences between different indices. More likely is that the indices could fall this coming week. Gold may love a 50 bp cut, but the stock market not so much. The inverted yield curve has now turned positive, not a good sign after two years of an inverted yield curve.
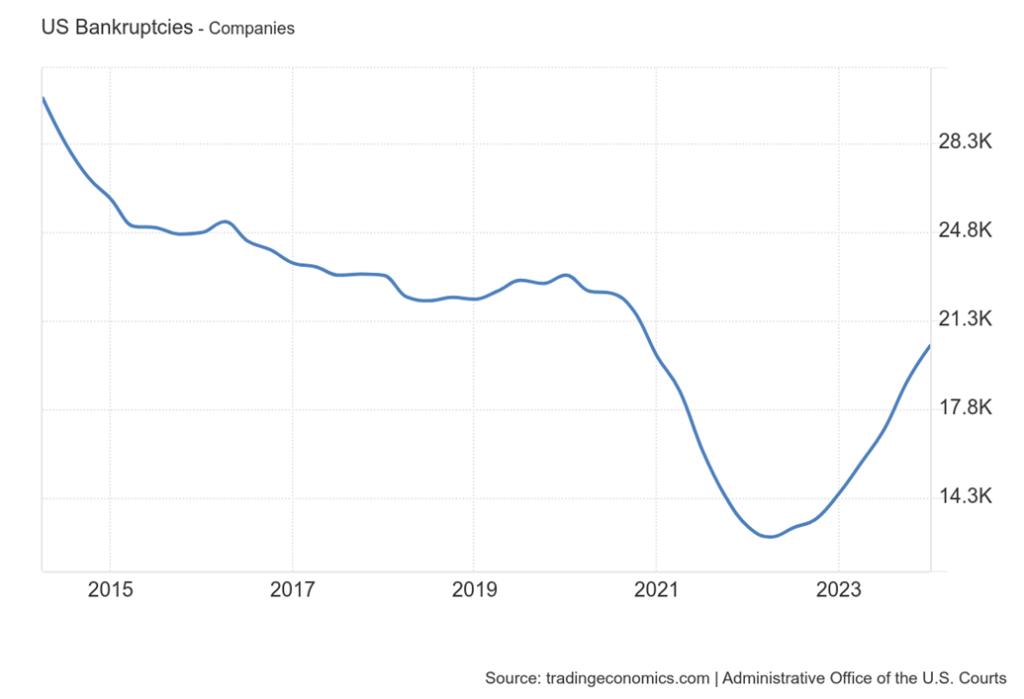
But that is only for the 2–10 spread. The 3-month–10-year spread remains quite inverted at 123 bp. A 50 bp cut would drop that spread considerably. That would also signal that the recession is near. But, as we mentioned in our opener, will it be a no landing, soft landing, or hard landing? We continue to suspect the latter, but realize it is also a minority view. Debt is a serious problem that seems to be ignored by many. Ok, except from those in bankruptcy. Bankruptcies have been rising but the pace has slowed.
Rising Business Bankruptcies 2014-2024 (thousands)
In Canada, the TSX Composite rose 3.5% to new all-time highs while the TSX Venture Exchange (CDNX) gained a solid 6.5% as we are finally seeing a sliver of life in the junior mining market. In the EU, the London FTSE rose 1.1%, the EuroNext 100 was up 2.2%, the Paris CAC 40 rose 1.5%, while the German DAX was up 2.2%.
The European exchanges generally followed the US indices up. Not so much in Asia as China’s Shanghai Index (SSEC) fell 2.2%. The SSEC is down 9.1% in 2024 and down almost 15% from its May peak. China’s economic woes are noted and they in turn could turn the world down. Hong Kong’s Hang Seng (HSI) fell 0.7% while the Tokyo Nikkei Dow (TKN) rose 0.5%. The MSCI World Index was flat on the week.
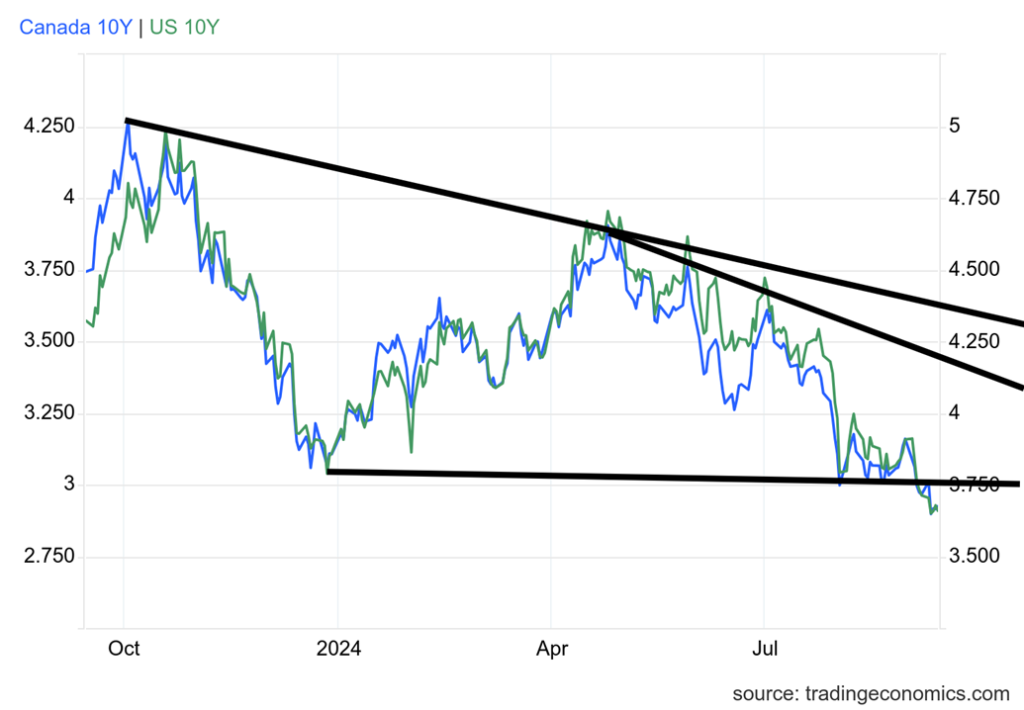
For those who follow crypto, Bitcoin rose 10.7% but it is continually volatile and generally follows the major indices. Bond yields fell and now appear to have firmly broken a previous strong support zone near 3.75% for the U.S. 10-year treasury note. The 10-year fell 5 bp or 1.4% this past week to 3.66. In Canada, the 10-year Government of Canada Bond (CGB) was down 1.7% and 5 bp. But the drama was on the 2–10 spread that rose to a positive 7 bp, up marginally from 6 bp. In Canada, it was the same as the 2–10 rose 3 bp from negative 8 bp to negative 5 bp. Canada is also signalling that a recession is near.
Signs are there that a recession may be near. But for many it looks like a no landing. Shock to the global financial system would be the catalyst. Debt has reached unsustainable levels globally. Interestingly, Jamie Dimon, the CEO of JP Morgan is forecasting a steep recession and stagflation.
Unless we once again make new all-time highs for SPX, this week odds favour a down week. Under 5,400 spells trouble; under 5,100 suggests a bigger drop is on its way.
All eyes and ears will be on the Fed meeting this week.
U.S. 10-year Treasury Note, Canada 10-year Bond CGB
A quick note on the TSX. The index was up 3.5% to new all-time highs. Other sub-indices also saw new all-time highs. Income Trusts (TCM) was up +6.6%, Consumer Staples (TCS) +1.3%, Financials (TFS) +3.5%, and Real Estate (TRE) +5.3%. Making new highs only was Golds (TGD) up 9.6%, and Utilities (TUT) +4.6%. Other good gainers were Metals & Mining (TGM) +8% and Materials (TMT) +9.2%. Is the commodity super-cycle under way? The only loser this past week was Energy (TEN), down 1.8%.
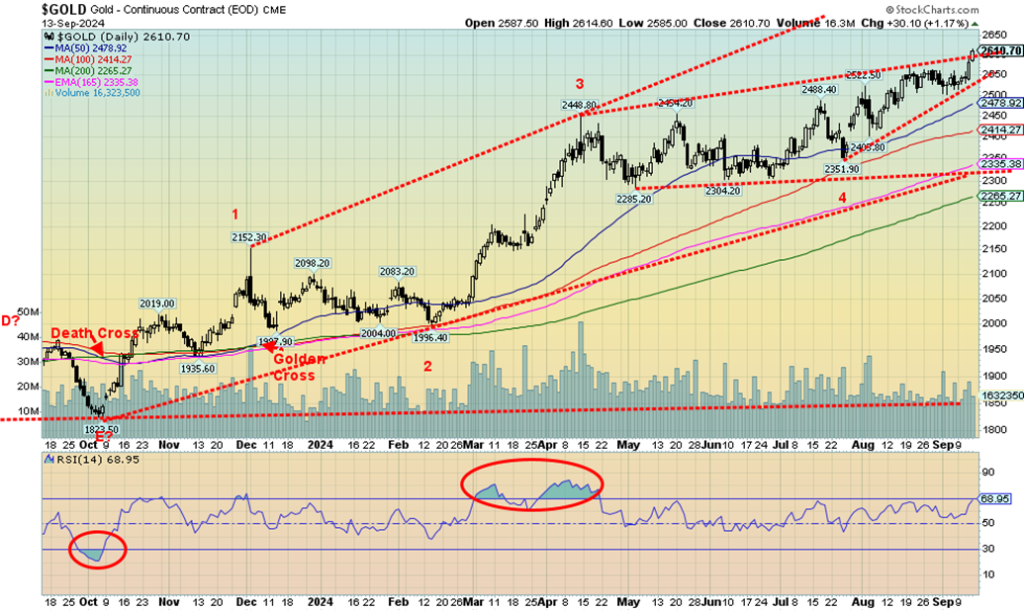
If there was a star this past week it was gold and commodities. Just the prospect of a 50 bp cut this coming week sent gold once again to new all-time highs. Gold was up 3.4% and closed over $2,600. For Canadians, that’s $3,500. It’s been a big bright spot. Gold is now up 26% on the year. No, silver still is nowhere near its all-time high, but at least it put in a stellar performance this past week, up 10.3% and up 29% on the year.
We are inching towards a breakout level at $31.50, suggesting new yearly highs for silver are close. Silver is also leading, which it should in a bull market. The stellar performance of gold ignited the stocks as the Gold Bugs Index (HUI) rose 12% and the TSX Gold Index (TGD) was up 9.6%. On the year, the HUI is up 35.1% and the TGD 32.8%. It’s been a banner year for the gold stocks. Nonetheless, both indices remain well below their former highs seen back in 2011.
Gold is a hedge against economic woes, falling interest rates, and falling currencies. (The US$ Index was flat this week, but after rising it reversed and closed unchanged. The only currency showing life was the Japanese yen, up a sharp 1.0%. Gold is also a safe haven in times of geopolitical uncertainty, such as the divisive U.S. election and conflicts involving Russia/Ukraine, Israel/Hamas, Hezbollah, Iran, Syria, and Houthis.
With gold having a stellar week, others joined the party. Platinum gained 9.6% and palladium was up 19.2%. Copper was up 4.1% and the CRB Index gained 2.6%. It could have gained more, but the big drag is energy as WTI oil gained only 1.5% but is under $70 down 4.4% in 2024. Brent crude was down 0.1%, Natural Gas (NG) gained 1.8%, but NG at the EU Dutch hub was down 1.8%.
The energy stocks were negative with the ARCA Oil & Gas Index (XOI) down 0.9% and the TSX Energy Index (TEN) off 1.9%. With excitement in the commodity sector, it’s no surprise we were hearing rumblings of the commodity super-cycle getting under way again. The big struggle now is energy as economic stress is sparking pessimism there, but it’s offset by supply disruptions due to hurricanes in the Gulf and ongoing conflicts in Libya.
We remain optimistic that gold is going higher. Maybe we’ll see some resistance here at $2,600 but ultimately, we should be next headed for $2,700. Also, beware of a spike. RSIs are still under overbought at 70, which suggests to us that we could move higher still. Gold under $2,500 is troublesome, but gold under $2,300 could suggest the rally is over. We remain committed to higher prices for gold, silver, and the gold stocks. We are well aware of potential tops in this period, but as we go into 2025, we should be rising sharply again.
__
(Featured image by Veli Yunus Ünal via Unsplash)
DISCLAIMER: This article was written by a third party contributor and does not reflect the opinion of Born2Invest, its management, staff or its associates. Please review our disclaimer for more information.
This article may include forward-looking statements. These forward-looking statements generally are identified by the words “believe,” “project,” “estimate,” “become,” “plan,” “will,” and similar expressions, including with regards to potential earnings in the Empire Flippers affiliate program. These forward-looking statements involve known and unknown risks as well as uncertainties, including those discussed in the following cautionary statements and elsewhere in this article and on this site. Although the Company may believe that its expectations are based on reasonable assumptions, the actual results that the Company may achieve may differ materially from any forward-looking statements, which reflect the opinions of the management of the Company only as of the date hereof. Additionally, please make sure to read these important disclosures.
Copyright David Chapman 2024
David Chapman is not a registered advisory service and is not an exempt market dealer (EMD) nor a licensed financial advisor. He does not and cannot give individualised market advice. David Chapman has worked in the financial industry for over 40 years including large financial corporations, banks, and investment dealers. The information in this newsletter is intended only for informational and educational purposes. It should not be construed as an offer, a solicitation of an offer or sale of any security. Every effort is made to provide accurate and complete information.
However, we cannot guarantee that there will be no errors. We make no claims, promises or guarantees about the accuracy, completeness, or adequacy of the contents of this commentary and expressly disclaim liability for errors and omissions in the contents of this commentary. David Chapman will always use his best efforts to ensure the accuracy and timeliness of all information. The reader assumes all risk when trading in securities and David Chapman advises consulting a licensed professional financial advisor or portfolio manager such as Enriched Investing Incorporated before proceeding with any trade or idea presented in this newsletter.
David Chapman may own shares in companies mentioned in this newsletter. Before making an investment, prospective investors should review each security’s offering documents which summarize the objectives, fees, expenses and associated risks. David Chapman shares his ideas and opinions for informational and educational purposes only and expects the reader to perform due diligence before considering a position in any security. That includes consulting with your own licensed professional financial advisor such as Enriched Investing Incorporated. Performance is not guaranteed, values change frequently, and past performance may not be repeated.


Why 2026 Could Mark a Turning Point for Sustainability
Amid geopolitical crises and climate pressures, companies must seek alternative strategies, as sustainability becomes a key driver of value. By...


Dow Jones Rebounds as Markets Shrug Off Iran Conflict
A shortened trading week saw the Dow Jones rebound from a 10 percent correction, closing between key BEV levels. Outlook...


Iran War Drives Oil Surge and Rising Financial Risks
The war continues pushing oil prices higher, with Brent above 140 while futures lag. Energy stocks weakened despite highs. Headline...


TopRanked.io Weekly Affiliate Digest: What’s Hot in Affiliate Marketing [Bovada Affiliate Program]
This week, we're mashing up 80s tech with 2020s private messaging apps. Why? Because Big Tech just dropped a big...


Euro Stablecoins Struggle to Compete with Dollar Dominance in Crypto Markets
Euro stablecoins remain marginal despite the euro’s global importance, with minimal trading volume compared to dollar rivals like USDT and...
 |
|
 |  |
 |
|
-
 Business2 weeks ago
TopRanked.io Weekly Affiliate Digest: What’s Hot in Affiliate Marketing [1xBet Affiliate Program]
-

 Crypto6 days ago
Crypto Markets Edge Up as Caution Persists and April Fools’ Scams Loom
-

 Cannabis2 weeks ago
Aurora Shifts Strategy Toward Global Medical Cannabis Markets
-

 Markets1 week ago
Dow Jones Tests Correction Zone Amid Bullish Momentum and Bubble Concerns