Business
Markets Volatility, Geopolitics, and Signals of a Potential Trend Shift
Markets swung amid shifting statements from Trump and geopolitical tensions with Iran. Initial threats moved stocks, gold, oil, and yields then reversed, raising insider trading concerns. Major indices broke below 200-day averages, signaling weakness. FAANG stocks are declining. Oil remains central with rising prices and war risks, while gold and silver showed a bullish reversal.
Don’t you just love the volatility? Trump had issued a warning to Iran that unless they opened the Straits of Hormuz within 48 hours the U.S. would obliterate their power plants. Markets plunge, oil soars.
Then 24 hours later, Trump announces that, due to productive talks with Iran, he will delay the obliteration of power plants for at least five days. Markets soar, oil plunges. Iran denies talks. Markets fall, oil rallies. U.S. announces a 15-point peace plan. Markets rally, oil drops. Iran says no. Markets plunge, oil rallies.
Iran war continues
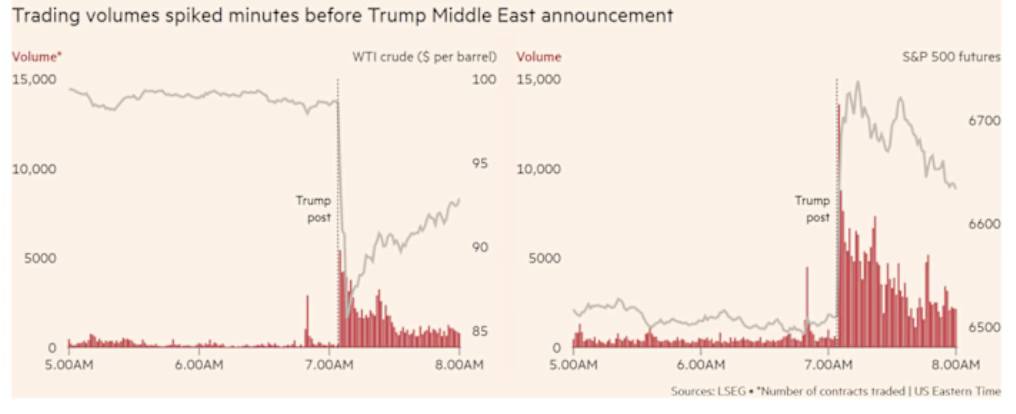
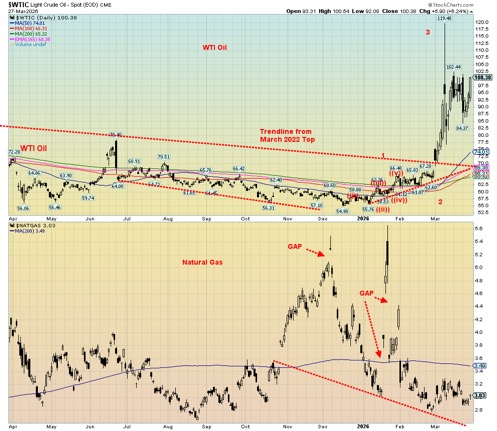
Roughly 15 minutes before Trump announced his change of heart to delay the obliteration of power plants on March 23, 2026, some people bet $500–$600 billion dollars that the price of oil would fall and stocks would rise. Predictably, Brent fell 15%, while WTI also fell about 15%. They also bought S&P 500 futures, and then the stock market rallied. The exchange had no comment, nor did The White House.
An investigation was called. No response. The question begged: who was operating on insider trading? The preceding chart shows the huge spike in volume followed by oil plunging and stocks rallying. Is this manipulation? Is the fix in?
No point in going into detail about this as it has been covered by numerous others, including Bloomberg, Reuters, and Yahoo Finance. It does, however, raise more questions than answers. And it highlights how volatile and dangerous this market has become; likewise, how volatile and dangerous the situation is in the Middle East. Despite both sides supposedly talking (which is denied by Iran), there has been a considerable troop build-up by U.S. forces.
To what purpose, no one is saying. There has been talk of the U.S. seizing Kharg Island in the upper part of the Persian Gulf that contains Iran’s oil export facilities. Iran has already begun fortifying the island, making a land assault a potentially dangerous mission.
What we do know is that even if the Straits of Hormuz were to open tomorrow, it would take weeks to clean up the mess. How many mines, for example, have been laid in the Straits? Oil and gas facilities and even desalination plants have been bombed in Bahrain, Qatar, Saudi Arabia, Dubai, and Iraq. U.S. bases have been bombed. Israel has been bombed. Iran has been bombed, including desalination plants. Much of their military infrastructure has already been bombed.
But the missiles keep coming. What we also know is that the U.S./Israel have unleashed economic chaos with shortages of oil, gas, and a host of products, including fertilizers and helium needed in the manufacture of computer chips.
Consider what goes through the Straits of Hormuz: 20% of global LNG trade, 33% of global helium supply, 20% of world oil consumption, 11% of global trade, 27% of global seaborn oil trade, 67% of global urea trade, 20% of global aluminum supply, 33% of global seaborn fertilizer trade, 30% of global ammonia exports, 85% of Mid-East polyethylene exports, and 44% of global sulphur production. Everything is covered. Chips, plastics, fertilizer, aluminum, gas, food. And that doesn’t even cover the damage being done to desalination plants (water) and the global financial center of Dubai.
That raises the spectre of the unknown unknowns. Surely someone anticipated that if they attacked Iran, they might risk the Straits of Hormuz being closed. Or maybe they didn’t believe that Iran had the capability to do that. But they did. What we don’t know is – who else is going become involved in this war? We already know that Russia is helping Iran by sending missiles and providing intelligence on targets.
And it’s suspected that China too is sending arms to Iran. The Houthis of Yemen are now in the war potentially threatening commerce in the Red Sea. Could NATO become involved? So far, they have turned Trump down. But when their economies are at stake will their tune change? An unknown unknown.
The EU has considerable economic need to get the Straits open. Other Gulf countries such as Saudi Arabia are also being drawn into the war. The risk is that regional wars turn into a global war: World War III. That possibility can no longer be dismissed, particularly given there are now wars on at least three continents: Europe Russia/Ukraine, the Middle East, U.S./Israel/Iran, and the ongoing Israel/Palestine/Lebanon wars. Add
in the conflict between Pakistan and Afghanistan, and, lest we forget, the ongoing wars in Africa in the Sudan and Sahel, plus insurgencies elsewhere in a number of countries in Asia and Africa. There are also the drug wars in Mexico/Colombia. China/Taiwan could also be considered another hot spot, given China’s ongoing military excursions around Taiwan. All the wars have an economic effect, impacting not just local economies but also spreading into the wider world.
We’ve also learned of a potential threat that is not being mentioned. Another unknown unknown? Apparently, there are dozens of cables that run through the Straits of Hormuz and Red Sea connecting Asia, Europe, and Africa.
These cables carry the traffic of banking systems, cloud services, data centers in the Persian Gulf, and the online connections of billions of users around the world – i.e., the internet. Is there a risk of cable damage? If so, this raises a risk that no one is talking about. A company, Alcatel Submarine Networks, has already declared force majeure and stopped the laying of cables for the Meta/Africa 2Pearls in the Persian Gulf. Damage to cables even in normal times can take five to six months to repair. What about during war time?
The world has gone through a series of oil crises since the Arab Oil Embargo in 1973 during the Yom Kippur War. That was followed by peaks in 1980 (Iranian crisis), 1990 (Iraq invasion of Kuwait), 2003 (U.S. invasion of Iraq), 2008 (a huge surge in global demand from Asia, led by China), and 2022 (Russia/Ukraine war).
We’ve noted there is no discernable pattern to these peaks. More predictable are lows where, according to Ray Merriman of Merriman Cycles (www.mmacycles.com), we can observe a 12-year cycle low (range 11–13 years). Important cycle lows occurred in 1973, 1986 (13 years), 1998 (12 years), 2009 (13 years), and 2020 (11 years). Important half-cycle lows (6 years) were also observed. The next low is not due until at least 2031–2033. The question is, how high will we go this time? As we have noted, the inflation-adjusted 2008 high is $220, a not-impossible target given the current war.
At the time of the Arab Oil Embargo in 1973 and the 1979 Iranian crisis, oil made up a larger share of the global economy, estimated at 45–50%. Energy efficiency was not yet in vogue, so transportation, heating, and industry were heavily dependent on oil. The supply cuts triggered instant shortages, lineups at the pump, economic dislocation, and inflation. OPEC represented a huge proportion of oil supply. Oil today still makes up about 30% of the global economy.
Cutting its use is more energy-efficient, allowing for greater reliance on renewable energy such as solar, wind, and nuclear power. Natural gas also plays a larger role. Oil is still key in transportation and industry. There has been diversification away from the Middle East, particularly in North America (Canada, U.S.) and other countries such as Brazil and Norway.
Oil is still important today, driving inflation cycles and remaining at the center of wars and global geopolitics. Oil spiked in 2022 during the Russia/Ukraine war and it did unleash inflationary pressures, but the global economy didn’t fall into a recession as it did in 1973–1975 after the 1973 Arab Oil Embargo or in 1980–1982 after the 1979 Iranian crisis.
Inflationary pressures from the current war are already being felt with a sharp rise in diesel fuel, jet fuel, and gas at the pump. In turn, we will feel upward price pressure on food and industry, particularly the high-tech economies of Asia such as South Korea and Taiwan. A recession this time around is not out of the question. The Iran war continues as it enters its second month.
WTI Oil Inflation-Adjusted 1946–2026
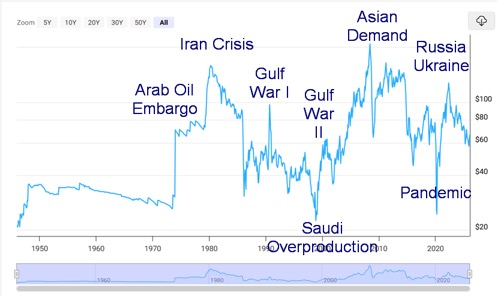
Chart of the Week
Are the MAG7 losing their appeal? The preceding chart shows the S&P 500/MAGS ETF ratio. Since October 2025, the S&P 500 has been outperforming MAGS. Almost exclusively since the creation of the MAGS ETF in 2023, the MAG7 have been vastly outperforming the S&P 400. At their peak the MAG7 made up some 35% of the S&P 500. Back in 2016 the MAG7 made up only about 16% of the S&P 500.
That’s still high, but since the onset of the MAGS ETF the market has mostly favoured the MAG7. No longer. There was an interruption in 2025 during the period of the “Liberation Day” tariffs. That peaked in April 2025 and after that the MAG7 continued their leadership and dominance.
So, what is MAGS? MAGS is an ETF created to represent the MAG7: Apple, Amazon, Alphabet (Google), Meta, Microsoft, Nvidia, and Tesla. MAGS is rebalanced quarterly on an equal basis. While the current make-up varies from the 12.4% weighting of Microsoft to the 15.0% weighting of Nvidia, they are mostly equal. About 9% of MAGS is held as ultra-short duration with no dividend target. All that is a method for tax efficiency and short-term cash management.
It provides a return similar to treasury bills without generating dividends. Returns are therefore reflected in price gains rather than payout of dividends.
Whether this ratio holds or not is not yet determined. The ratio needs to break above 120 to potentially confirm a bottom in the ratio. Nonetheless, it reflects a shift from the high risk of the MAG7 to a more balanced approach. Option strategies are also applied to MAGS to help boost returns. However, this rebound in the ratio is worth noting as it could signal the end of the MAG7’s dominance.
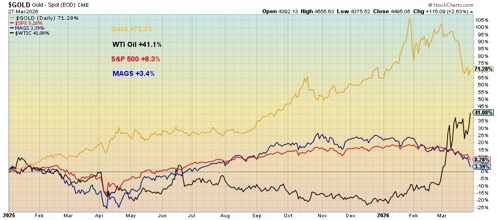
Price Performance Gold, SPX, MAGS, WTI Oil 2025-Present
Stocks
It’s all about Iran. War has an impact on stock markets. In 1939 when Germany invaded Poland, the Dow Jones Industrials (DJI) drifted lower. When everyone realized this war wasn’t going to be over soon, the DJI plunged 38%. The DJI continued lower and lower through 1941, eventually dropping over 40% from the 1939 high. When World War I broke out, the stock market shut down for almost six months. After the 9/11 attacks, the stock market closed down for just under a week, eventually falling 30% from a high in May 2001.
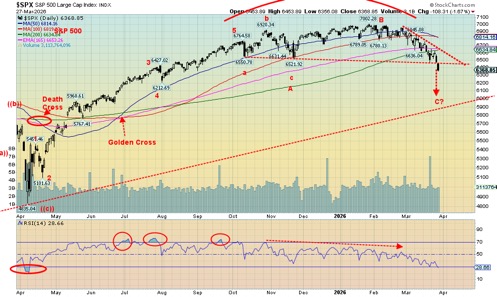
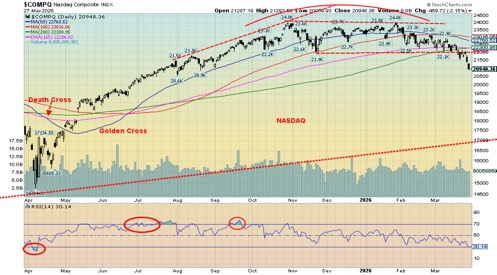
War has an impact on the stock market and today’s situation does not appear to be an exception. The month of March has not been kind to the stock market. The DJI is down just over 10% from its February high – official correction territory. The NASDAQ is down 12% from its high. The sell-off may just be getting underway.
All indices – S&P 500, DJI, and NASDAQ and yes the large cap Russell indices 1000, 3000 – busted support this past week and are now under the 200-day MA. The exception has been the Dow Jones Transportations Index (DJT), which remains up on the year. Also hanging are the Mid and Small cap indices. The major indices are now in negative territory for 2026.
The daily short-term trend is pointed down and the weekly, Intermediate trend has now turned down as well. That’s officially a sell signal. The monthly trend long-term remains up but weakening. That suggests that buying and being in stocks now is risky.
On the week, the S&P 500 fell 2.1% and is now down 7.0% on the year. The DJI fell 0.9%, the DJT gained 1.8% while the NASDAQ was down 3.2%. Surprisingly, the mid-cap and small-cap stocks were somewhat buoyant. The S&P 400 (Mid) was up 0.4% while the S&P 600 (Small) gained 1.1%. Both indices are up slightly up on the year. The S&P 500 Equal Weight Index fell 0.6% and is now down 1.6% in 2026 while the high-tech/AI stocks are being hit with the NY FANG Index down 5.4% and down 15.0% in 2026.
Big losers this past week include Meta, down 11.4%, Google, off 8.4%, and Microsoft, down 6.6%. Netflix and Apple held tough with gains of 1.8% and 0.3%. However, Apple is down 8.5% in 2026 and Netflix is down 0.3%. The MAGS MAG7 ETF fell 5.0% on the week and Donald Trump’s Trump Media (DJT) made all-time lows once again.
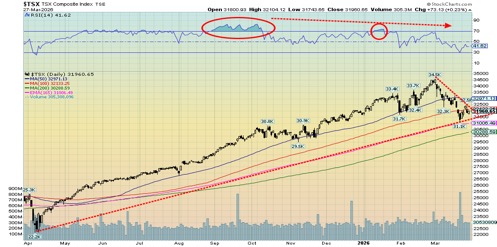
In Canada, the TSX Composite led by Golds, Metals, Materials, and Energy gained 2.1%. The TSX Venture Exchange (CDNX) regained, up 0.4%. Only four out of the 14 TSX sub-indices were down this past week. In the EU it was mixed as the London FTSE was up 0.5%, the Paris CAC 40 gained 0.5% as did the EuroNext, while the German DAX fell 0.4%. Given the negative impact of the war on the EU with energy, the gains were a surprise.
In Asia, China’s Shanghai Index (SSEC) fell 1.1%, the Tokyo Nikkei Dow (TKN) was flat, Hong Kong’s Hang Seng (HSI) fell 1.3% as did India’s Nifty Fifty. The MSCI World Index (ex U.S.) was flat on the week.
The big losers on the week were the U.S. indices, particularly the high-tech/AI stocks, which led the market up. The party, as they say, is most likely over.
The S&P 500 has broken the 200-day MA support and the neckline of that rounding top pattern. Projections are down to at least 6,000. Below that level the next target would be 5,700. The TSX is hanging in as long as Golds, Metals, Materials, and Energy hold up. Those are the key areas.
U.S. Michigan Consumer Sentiment Index 1952-2026
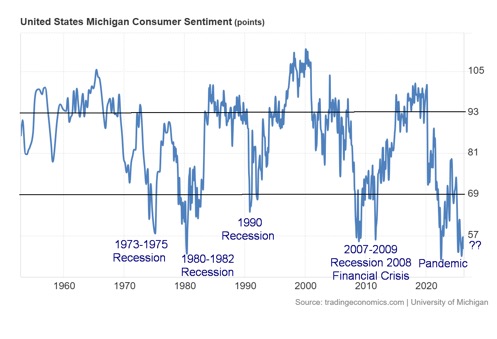
The University of Michigan Consumer Sentiment Index is at its lowest level since the pandemic. It’s at levels comparable to the 1973-1975 recession, the 1980-1982 recession, and the 2007-2009 Financial crisis recession. Yet we are not yet in a recession.
Bonds
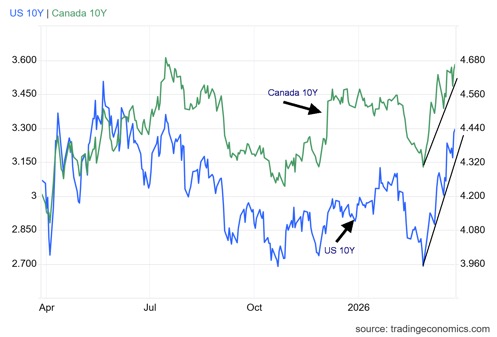
Bond yields are rising and there is little that President Trump can do about it. He may be able to whip the stock market around with his pronouncements, but the bond market doesn’t respond. Okay, maybe yields fall a bit but not much. The U.S. 10-year Treasury note responded to higher oil prices by rising 4 bp to 4.43%. The recent low was 3.96%. The Canadian 10-year Government of Canada bond (CGB) also was up 3 bp on the week. The recession watch spread 10-years minus 2-years saw the U.S. spread rise to 52 bp and Canada to 63 bp. Both are predicting an oncoming recession.
Danger lurks for the bond market. The recent treasury auctions went poorly, the worst in three years. With inflation rising and bond prices falling, why buy bonds? The U.S. needs to roll $10 trillion of its nearing $40 trillion this year, a monumental task. Add in the growing jitters over private credit and private equity where funds are restricting or completely closing the ability to get out and you have a problem. To raise cash, they have to instead sell something else. Stocks and bonds are the first line of defense. Gold initially as well, as we’ve seen.
Gold rebounded this past week, even as stocks fell, bond yields rose, and the US$ Index rose. We remember well in 2007 when Bear Stearns closed off two hedge funds. That was the start of what became the 2008 financial crisis. Now private equity and credit funds are closing off redemptions. Can history repeat itself?
Gold and Silver
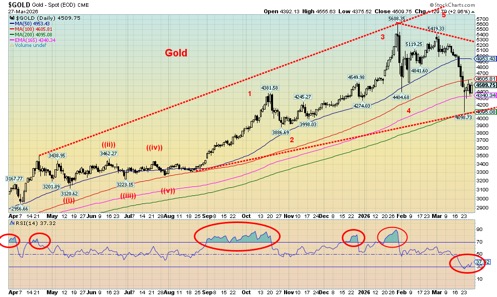
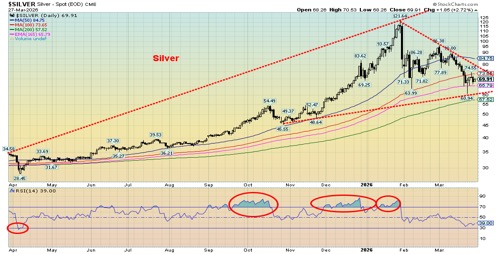
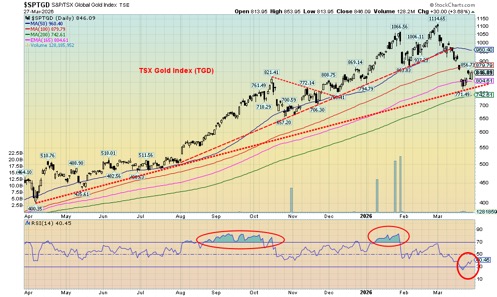
Whither gold? The indestructible metal, a centuries-old safe haven. It has taken a hit. At the recent low gold had fallen 27%, officially a bear market. Silver had fallen 50%, while the TSX Gold Index (TGD) was down only 30%, a surprise, really. Normally the TGD would be down at least 70% as it was in previous collapses in 2008 and 2020. View that as a win. That this correction was overdue given the sharp rise during 2025 and early 2026 should not have been a surprise. That it has gone deeper and lasted longer than many expected is probably a bit of a surprise.
That’s the bad news. The good news is that despite the sharp drop, gold, silver, and the gold stocks remain in bull markets. We’ve seen this picture before, particularly during the 2008–2011 bull market where a few sharp corrections (20%+) were not unusual. We’ll base this one off the monthly lows during a year as a signal that the bull is officially over. A drop under $4,000 would be a bearish signal. But the real drop doesn’t come until under $2,600.
We don’t see that in the forecast. As a result, we are gathering support for gold around $4,200, and silver $63. The TGD has key support in the 770 area while the HUI’s support lies at 665. All these points are where we saw recent lows. From our perspective, we’d prefer to see these levels hold.
We did see something positive with this week’s action. When oil prices leaped once again and the stock market fell, with bond yields and the US$ Index ticking higher, gold, silver and the gold stocks were up, rather than following stocks down as they did before. A divergence? Gold gained a meagre 0.2%, but that was after falling earlier, silver was up 2.8%, the Gold Bugs Index (HUI) gained 7.1%, and the TGD was up 8.2% on the week. A positive development. The US$ Index was up 0.6% this past week, while the euro fell 0.4%.
Not as lucky was platinum, which fell 3.4%, and palladium, down 2.1%. Copper rose 3.4%. Gold and gold stock indices (HUI, TGD) are up marginally on the year while silver, platinum, palladium, and copper are all down on the year as of Friday, March 27. It was the first weekly gain for gold since the war began. Gold would respond well to stagflation where the economy is slowing and turning into a recession even as inflation rises.
Against that backdrop, the Fed is reluctant to raise interest rates. However, can the Fed lower rates? Or as we say, they are caught between a rock and hard place, with a president pushing for lower interest rates.
One week does not mean the sell-off is over. We need to see gold take out $5,000 and silver over $90 to suggest and confirm that a low is in. We’d like to see the TGD regain above 1,000. We note that the juniors saw some bids this past week as well. With the Middle East in chaos and the war potentially expanding, gold retains its safe-haven status. It’s indestructible and has no liability, unlike everything else.
Oil and Gas
The oil market today is dominated by hope and delusion. Hope that when President Trump announces a five-day deadline, up from a 48-hour deadline, it means that they are trying to end this war. Delusion, because no matter how many delay announcements are made, the thought that this war will come to an end any time soon is – well, delusional. The U.S. announces a 15-point peace plan. Result: hope. Iran rejects it. Result: delusion.
This war is not going to come to an end anytime soon. We enter the fifth week. The focus is now on Kharg Island where Iran exports a good portion of its oil production. There is talk of the U.S. taking the island to shut off Iran’s export capability. In anticipation of such an event, Iran is fortifying the island against a ground invasion. Some have compared an invasion of Kharg Island to the U.S. taking the Pacific Islands during World War II. Casualties would be high. Iran might, if they thought all was lost, destroy the facilities themselves.
Applying technicals to the oil market is difficult because this rise is completely dominated by the war, which does not appear likely to stop anytime soon. Even if it did, it would take weeks to get the Straits of Hormuz open again, just in the clearing of mines and other obstacles, for example. Considerable damage has already been done to infrastructure in Saudi Arabia, Bahrain, Qatar, and the UAE. Any attempt to attack Kharg Island could be met with more attacks on fields in the named countries. It will take months if not years to repair the damage, and at a cost of billions of dollars.
What all this promises are prolonged outages that grossly and negatively impact global oil and gas supplies, including diesel and jet fuel. And, lest we forget, also impacted are access to fertilizers, helium, and other products needed to run the world economy. Helium is needed for production of semi-conductors. Major semi-conductor manufacturers are Taiwan and South Korea, both of which also need the oil from the Middle East. Shortage of fertilizers will have a profound negative impact on agriculture, thus sending food prices up once again.
Shortages could develop leading to rationing. Europe is entering its summer stockpiling season already in deficit according to Maudlin Economics www.maudlineconomics.com. Dutch storage facilities are sitting at the lowest level for this time of year, roughly 6%. Germany, home to the continent’s largest storage sites, is at about 22%. Europe, as a whole, is about 28% full, the lowest since 2022. Apparently, Australia also has problems. It shouldn’t given its vast resources. But instead, they import some 80% to 90% of their fuel. They are low on diesel fuel and jet fuel all below its minimum stockholdings.
Considerable damage has already been done. Further damage, which is highly probable, will only help prices rise further, adding to inflation/stagflation. This past week WTI oil rose 2.7%, while Brent crude was up 0.7%. But these gains came after there had been a sell-off on hopes this war might end soon. No such chance. Natural gas (NG) for whatever reason fell on the notion this might be over soon. NG at the Henry Hub (North America) fell 2.3% while NG at the EU Dutch Hub fell 7.9%. These declines may not last long.
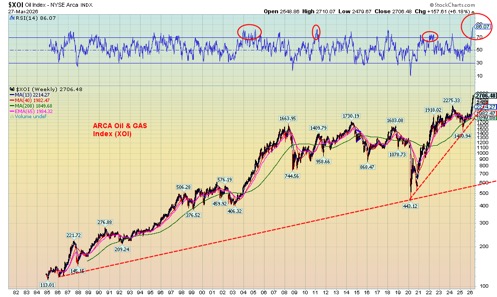
Meanwhile, energy stocks are benefitting considerably as the ARCA Oil & Gas Index (XOI) rose 6.2% and the TSX Energy Index (TEN) was up 3.9%. Both hit not just 52-week highs, but the XOI hit all-time highs while the TEN is just shy of all-time highs. If you’re long energy stocks, that will help pay for your gas at the pump and your heating oil.
Not only are the Straits of Hormuz disrupted, but it appears that once again the Red Sea could become a bottleneck. The Houthis of Yemen have fired on Israel, raising the spectre that they will disrupt shipping traffic in the Red Sea as it moves towards the Suez Canal. Winners in this war are Russia, the U.S., Canada, Brazil, and other oil and gas producers not impacted by the closing of the Straits. Losers include the EU, South Korea, Taiwan, China, India, and other South Asian countries dependent on oil imports. China can pivot to Russia.
Could the EU do that too? But it would be back to the U.S.-sanctioned Russia. The U.S. and Canada do not have the capacity or capability to step up and replace what is being lost, at least in the short to medium term. They can provide marginal relief only. Prices would remain sky-high.
This war is quickly becoming a threat to the world economy that could be greater than the 1973 Arab Oil Embargo and the 1979 Iranian crisis. Both crises sparked a sharp recession, along with inflation/stagflation. If somehow this war remains short(er), then prices may only spike to $150. That remains quite inflationary and could spark panics. But a prolonged war is a nightmare of probably recession (or worse), rationing, along with the massive costs of rebuilding that are already very high. The real fear, from what we are seeing and reading, is that this war continues to spread and threatens to engulf the world.
Brent Crude
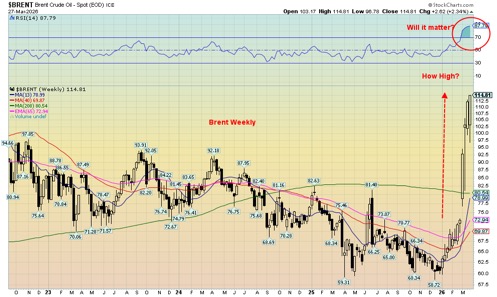
Brent is soaring. It made new 52-week highs this past week. The ARCA Oil & Gas Index (XOI) (chart on the next page) hit all-time highs this past week. The TEN is getting close. The divergence we noted earlier between the oil and gas stocks and oil and gas before when the energy stocks were rising, even as oil and gas were largely stagnant, has proven correct.
The real fear is that this war is not coming to an end anytime soon and the destruction will get worse, putting the entire global economy at risk. It also risks escalation as more and more players become involved. This raises the spectre of a global war, WW3. Margaret MacMillan, the renowned Canadian historian and author (The War that Ended Peace, Paris 1919), has noted some comparisons between the lead-up to World War I and the current situation. She notes that both were/are dominated by weak leaders and growing lawlessness as the world body, the United Nations, created out of the rubble of World War II, becomes increasingly ignored and irrelevant.
XOI Weekly 1985–2026
Markets and Trends
| % Gains (Losses) Trends | ||||||||
| Close Dec 31/25 | Close Mar 27/26 | Week | YTD | Daily (Short Term) | Weekly (Intermediate) | Monthly (Long Term) | ||
| S&P 500 | 6,845.50 | 6,368.85 | (2.1)% | (7.0)% | down | down | up | |
| Dow Jones Industrials | 48,063.29 | 45,166.64 | (0.9)% | (6.0)% | down | down (weak) | up | |
| Dow Jones Transport | 17,357.19 | 18,174.69 | 1.8% | 4.7% | down | up | up | |
| NASDAQ | 23,241.99 | 20,948.36 | (3.2)% | (9.9)% | down | down | up | |
| S&P/TSX Composite | 31,712.76 | 31,960.65 | 2.1% | 0.8% | down | up | up | |
| S&P/TSX Venture (CDNX) | 987.74 | 915.00 | 0.4% | (7.4)% | down | neutral | up | |
| S&P 600 (small) | 1,467.76 | 1,483.36 | 1.1% | 1.1% | down | up (weak) | up | |
| ACWX MSCI World x US | 67.18 | 66.35 | flat | (1.2)% | down | up (weak) | up | |
| Bitcoin | 87,576.98 | 65,968.56 | (5.7)% | (24.7)% | down | down | neutral | |
| Gold Mining Stock Indices | ||||||||
| Gold Bugs Index (HUI) | 701.49 | 731.91 | 7.1% | 4.3% | down | up (weak) | up | |
| TSX Gold Index (TGD) | 817.76 | 846.28 | 8.2% | 3.5% | down | up (weak) | up | |
| % | ||||||||
| U.S. 10-Year Treasury Bond yield | 4.17% | 4.43% | 0.9% | 6.2% | ||||
| 3.3Cdn. 10-Year Bond CGB yield | 3.44% | 3.58% | 0.9% | 4.1% | ||||
| Recession Watch Spreads | ||||||||
| U.S. 2-year 10-year Treasury spread | 0.69% | 0.52% | 8.3% | (24.6)% | ||||
| Cdn 2-year 10-year CGB spread | 0.85% | 0.63% | 31.3% | (25.9)% | ||||
| Currencies | ||||||||
| US$ Index | 98.26 | 100.13 | 0.6% | 1.9% | up | up | down | |
| Canadian $ | 72.87 | 71.98 | (1.2)% | (1.2)% | down | neutral | neutral | |
| Euro | 117.48 | 115.18 | (0.4)% | (2.0)% | down | down | up | |
| Swiss Franc | 126.21 | 125.2 | (1.3)% | (0.8)% | down | neutral | up | |
| British Pound | 134.78 | 132.73 | (0.5)% | (1.5)% | down | down | up | |
| Japanese Yen | 63.83 | 62.43 (new lows) | (0.5)% | (2.2)% | down | down | down | |
| Precious Metals | ||||||||
| Gold | 4,311.97 | 4,509.75 | 0.2% | 4.6% | down | up | up | |
| Silver | 71.16 | 69.91 | 2.8% | (1.8)% | down | up | up | |
| Platinum | 124.81 | 1,857.90 | (3.4)% | (9.2)% | down | neutral | up | |
| Base Metals | ||||||||
| Palladium | 1,619.50 | 1,388.50 | (2.1)% | (14.3)% | down | neutral | up | |
| Copper | 5.64 | 5.44 | 3.4% | (3.6)% | down | up (weak) | up | |
| Energy | ||||||||
| WTI Oil | 57.44 | 100.38 | 2.7% | 74.7% | up | up | up | |
| Nat Gas | 3.71 | 3.03 | (2.3)% | (18.3)% | down (weak) | down | neutral | |
__
(Featured image by Austin Hervias via Unsplash)
DISCLAIMER: This article was written by a third party contributor and does not reflect the opinion of Born2Invest, its management, staff or its associates. Please review our disclaimer for more information.
This article may include forward-looking statements. These forward-looking statements generally are identified by the words “believe,” “project,” “estimate,” “become,” “plan,” “will,” and similar expressions, including with regards to potential earnings in the Empire Flippers affiliate program. These forward-looking statements involve known and unknown risks as well as uncertainties, including those discussed in the following cautionary statements and elsewhere in this article and on this site. Although the Company may believe that its expectations are based on reasonable assumptions, the actual results that the Company may achieve may differ materially from any forward-looking statements, which reflect the opinions of the management of the Company only as of the date hereof. Additionally, please make sure to read these important disclosures.
Copyright David Chapman 2026
David Chapman is not a registered advisory service and is not an exempt market dealer (EMD) nor a licensed financial advisor. He does not and cannot give individualised market advice. David Chapman has worked in the financial industry for over 40 years including large financial corporations, banks, and investment dealers. The information in this newsletter is intended only for informational and educational purposes. It should not be construed as an offer, a solicitation of an offer or sale of any security. Every effort is made to provide accurate and complete information.
However, we cannot guarantee that there will be no errors. We make no claims, promises or guarantees about the accuracy, completeness, or adequacy of the contents of this commentary and expressly disclaim liability for errors and omissions in the contents of this commentary. David Chapman will always use his best efforts to ensure the accuracy and timeliness of all information. The reader assumes all risk when trading in securities and David Chapman advises consulting a licensed professional financial advisor or portfolio manager such as Enriched Investing Incorporated before proceeding with any trade or idea presented in this newsletter.
David Chapman may own shares in companies mentioned in this newsletter. Before making an investment, prospective investors should review each security’s offering documents which summarize the objectives, fees, expenses and associated risks. Although Artificial Intelligence (AI) may be deployed from time to time, AI output is monitored and adjusted, if necessary, for accuracy.
David Chapman shares his ideas and opinions for informational and educational purposes only and expects the reader to perform due diligence before considering a position in any security. That includes consulting with your own licensed professional financial advisor such as Enriched Investing Incorporated. Performance is not guaranteed, values change frequently, and past performance may not be repeated.


Poland Proposes Cannabis Decriminalization: 15 Grams and One Plant Without Penalties
Poland’s Centre parliamentary group proposed a bill to decriminalize cannabis, allowing possession of up to 15 grams and one homegrown...

Markets Volatility, Geopolitics, and Signals of a Potential Trend Shift
Markets swung amid shifting statements from Trump and geopolitical tensions with Iran. Initial threats moved stocks, gold, oil, and yields...


Dow Jones Tests Correction Zone Amid Bullish Momentum and Bubble Concerns
The Dow Jones has slipped just below its 10 percent correction threshold after a two month decline, raising questions about...


TopRanked.io Weekly Affiliate Digest: What’s Hot in Affiliate Marketing [1xBet Affiliate Program]
If you thought nobody liked cricket, then this week, we're proving you wrong. And by the time we're done, you'll...


Tether Seeks Big Four Audit to Boost USDT Transparency
Tether, issuer of USDT, plans a full audit by a Big Four firm to address transparency concerns over its $184...
 |
|
 |  |
 |
|
-
 Business1 week ago
The TopRanked.io Weekly Digest: What’s Hot in Affiliate Marketing [NiftyPM Affiliate Program Review]
-

 Impact Investing4 days ago
Ridemovi Secures Financing to Drive European Expansion and Sustainable Mobility Growth
-

 Impact Investing2 weeks ago
Antarctica Warming Reshapes Global Atmospheric Circulation
-
 Business1 week ago
Anemic Labor Market and the End of Passive Money Flows