Business
Markets Waver as Shutdown Deepens and Overvaluation Risks Loom
Markets were mixed: stocks wavered, gold was flat, bonds slightly higher, and oil dropped despite energy stocks rising. Canada’s job surge was mostly part-time. The U.S. government shutdown deepened, sparking flight chaos. Nvidia briefly hit $5 trillion, Musk neared $1 trillion, and Democrats won elections. Economic overvaluation and layoffs hint at looming instability.

The U.S. government shutdown is showing only faint signs of ending as it reaches its 41st day (November 10, 2025) – a record. The shutdown is beginning to bite. Flights are to be cut at major airports. Chaos follows. We continue to fly in the dark as to the jobs situation, given that the Bureau of Labour Statistics (BLS) is also a victim of the shutdown. This is against a backdrop of rising layoffs and rising bankruptcies, particularly in commercial real estate and subprime auto lending.
Since January 1st, 2025, some 4,286 companies have announced layoffs. That includes several high-tech/AI companies where some 600+ have announced layoffs. Trying to get a handle on how many is difficult, but according to Forbes (www.forbes.com) the estimate is over one million. Apparently, layoffs have exceeded one million only four other times: in 2001 (dot.com bubble burst), 2008 and 2009 (Great Recession, financial crisis), and 2020 (the COVID pandemic). And we’re not yet in a recession.
Reasons cited for the layoffs include the government shutdown, budget cuts, the rise of AI, falling consumer spending and rising costs (tariffs?). Yet they haven’t yet shown up in the job numbers. Yes, well we’re not getting them right now and support programs such as severance can keep things okay, at least for a while.
That said, thousands of federal government workers who were laid off are not being paid. Even essential workers haven’t been paid (although many book in sick) and food stamps are being suspended, impacting some 41 million recipients. Meanwhile, a bash was held at Trump’s Mar-a-Lago estate that was, apparently, worthy of The Great Gatsby. Inequality reigns on a massive scale. Despite all this, ADP employment (private sector only) announced job gains of 42,000 for October when they expected only 25,000. This followed two months of falling jobs.
So maybe it isn’t a surprise to see that the stock market may be finally responding. However, we’d rather not get ahead of ourselves. We need to see the S&P 500 under 6,500, the NASDAQ under 22,000, and the Dow Jones Industrials (DJI) under 45,400 to suggest to us that a top may be in. Confirmation comes at lower levels. We’ve had numerous false starts since the tariff “Liberation Day” in April 2025 that saw the S&P 500 drop a swift 21%, briefly into bear market territory.
Most indicators are, if not at record highs, close to it. Here’s a summary of indicators of the S&P 500:
| S&P 500 | Current | Record High | Long-Term Mean |
| PE Ratio | 30.69 | 123.73 (May 2009) | 16.18 |
| Shiller PE | 40.07 | 44.19 (Dec. 1999) | 17.31 |
| Price to Sales | 3.39 | 3.32 (Sept. 2025) | 1.80 |
| Price to Book | 5.51 | 5.40 (Sept. 2025) | 3.14 |
| Earnings Yield | 3.26% | 18.82% (Dec. 1917) | 7.21% |
| S&P EPS | 224.07 | 230.52 (Dec. 2021) | 45.80 |
| Buffett Indicator (Wilshire 5000/GDP) | 222.91 | 222.91 (Nov. 2025) | 88.5 |
Source: www.multpl.com, www.longtermtrends.net
Nine stocks have dominated the S&P 500: Apple, Amazon, Google, Meta, Microsoft, Nvidia, Tesla, Broadcom, and Berkshire Hathaway. Together they constitute some 37% of the S&P 500. How they go will show the way the market goes. From 1999 to 2018 the S&P 600 (Small) outperformed the S&P 500. Yes, there were hiccups along the way, most noticeably during the 2008 financial crisis and Great Recession. But since 2018, except for 2020–2021, the S&P 500 has outperformed. A healthy market suggests that small caps should outperform.
Shiller PE Ratio S&P 500 1870–2025

Source: www.multpl.com
The Buffett Indicator 1970–2025

Source: www.longtermtrends.net
Above the Shiller PE may not be at record highs seen in 1999/2000 but we’re getting close. The 1929 crash and the 2008 financial crisis crash saw the Shiller PE at lower levels. The indicator is flashing danger. As is the Buffett indicator that is at record highs. They are unsustainable.
In the following table, we look at the big nine in the S&P 500 that have dominated. It’s no surprise they are all trillion-dollar companies, led by Nvidia. Returns since 2020 illustrate their dominance, particularly for Nvidia, Tesla, and Broadcom, which are all up more than 1,000%. They have outperformed both the S&P 500 and gold but not Bitcoin, which is up some 1,800%+ since 2020.
The Big Ten plus SPX, Gold, BTC
| MAG7 + Top 10 SPX, Gold, Bitcoin | Price 11/5/25 $ | Market Cap $trillions | Gain/Loss Since 2020 % | P/E Ratio | EPS |
| Amazon (AMZN) | $250.20 | $2.7 | 177% | 35.34 | 7.08 |
| Apple (AAPL) | $270.14 | $4.0 | 342% | 36.26 | 7.43 |
| Alphabet (Google) (GOOG, GOOGL) | $284.75 | $3.4 | 412% | 28.14 | 9.99 |
| Meta (META) | $635.95 | $1.6 | 328% | 28.16 | 29.07 |
| Microsoft (MSFT) | $507.16 | $4.0 | 263% | 36.12 | 14.06 |
| Nvidia (NVDA) | $195.21 | $4.8 | 3,507% | 55.46 | 3.51 |
| Tesla (TSLA) | $462.07 | $1.5 | 1,511% | 314.33 | 1.50 |
| Broadcom (AVGO) | $358.98 | $1.7 | 1,987% | 91.63 | 3.88 |
| Berkshire Hathaway (BRK.A) | $736,750 | $1.1 | 163% | 15.70 | 46,909 |
| S&P 500 | 6,796 | Est $59.3 | 169% | 31.8 | 58.96 |
| Gold | $3,970 | Est $27.8 | 158% | ||
| Bitcoin | $103,893 | $2.1 | 1,846% |
Source: www.stockcharts.com, www.m.onlinebrokerage.cibc.com, www.ca.finance.yahoo.com
Since 2020, the NASDAQ is up roughly 155%. However, it is beginning to look tired. Yes, strangely, volume has picked up over the past few months, but momentum is slowing and diverging with lower highs, even as the NASDAQ makes higher highs. We also may have five waves up from that low in 2022, suggesting that at minimum a correction could be coming.
No, we can’t confirm a top, but a breakdown under 22,400 might signal the start of a steeper correction. We learned that hedge funds have a rather interesting play on. They are long the big cap AI stocks but have shorted stock indices ETFs against it. But what happens when the AI stocks outperform to the downside the stock indices ETFs? The hedge trade could then be flipped.
This market is long in the tooth, and numerous indicators suggest we should be careful going forward. A sudden change in direction could come out of the blue, triggered by any number of things.
NASDAQ Weekly 2020–2025
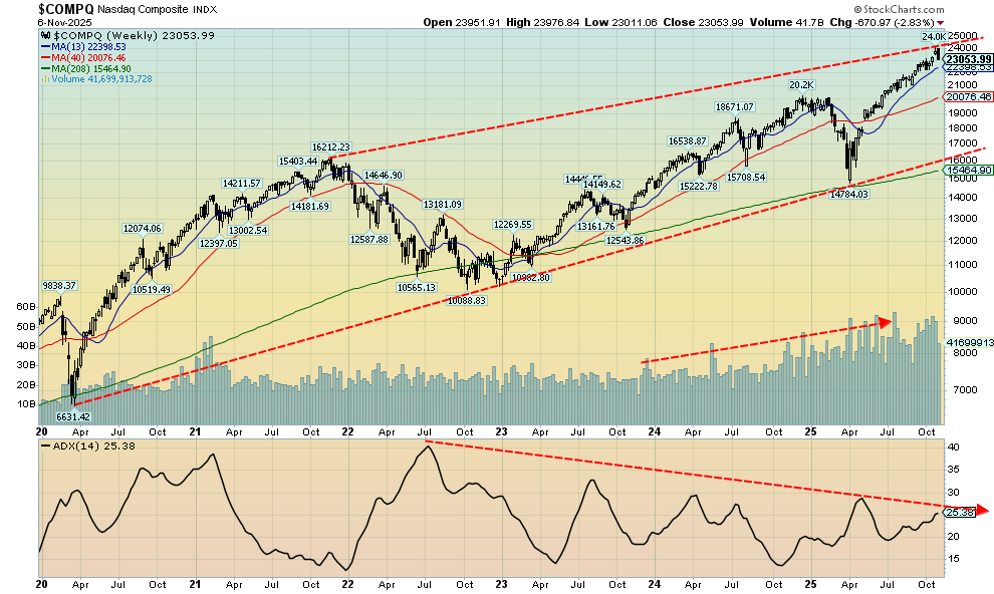
Source: www.stockcharts.com
The Trillion-Dollar Man
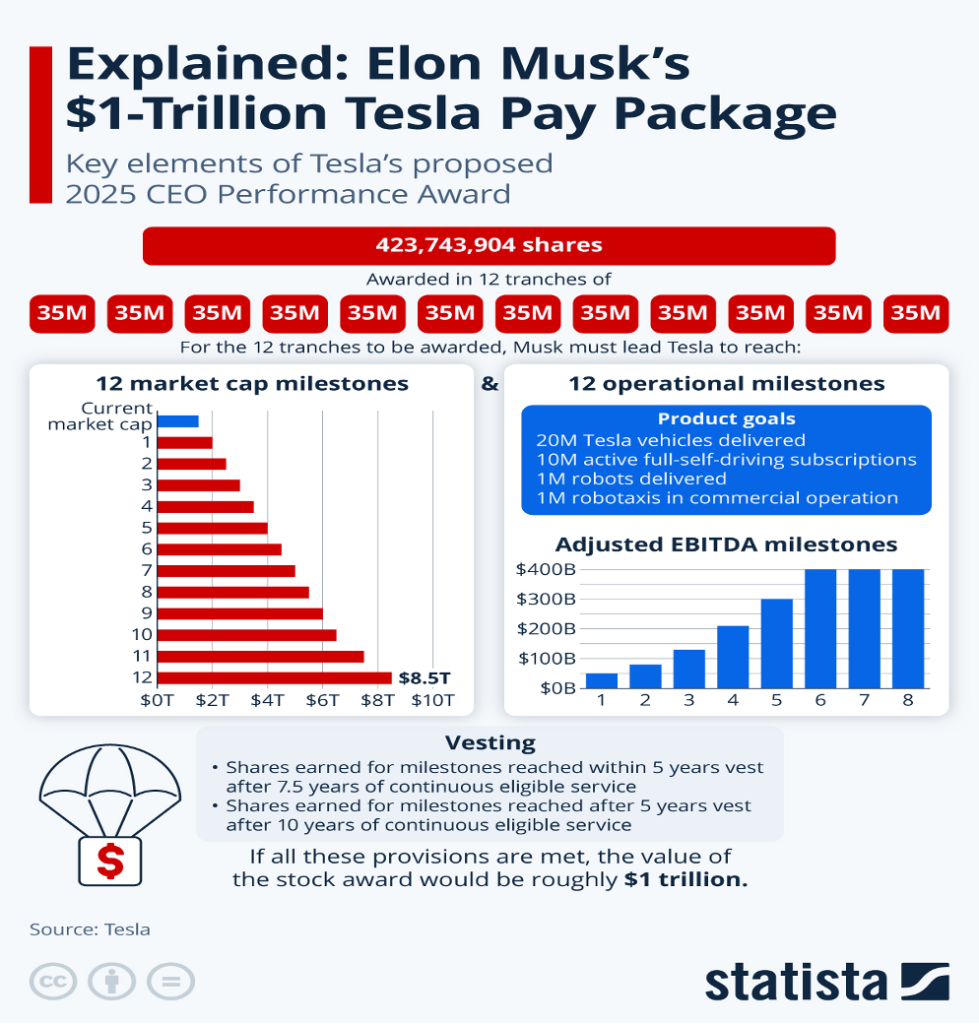
Source: www.statista.com
The idea that one man could become a trillionaire is beyond belief. But that is what could happen if somehow all the milestones are reached over the next several years. Elon Musk already has a net worth of $490 billion, according to Forbes’ billionaires list (www.forbes.com/real-time-billionaires/). As we have noted, that now makes Musk the 21st largest country in the world, just behind Sweden. No wonder inequality is rampant.
Could this be a “buy the rumour” (Musk will become the trillion-dollar man) “sell the news” (he became the trillion-dollar man)? The rise to $470 happened on declining volume and declining momentum. The RSI topped back in September. Now Tesla has been falling and has made what might be a double top on the charts. A firm break under $410 could suggest a swift decline to $350. Caveat emptor.
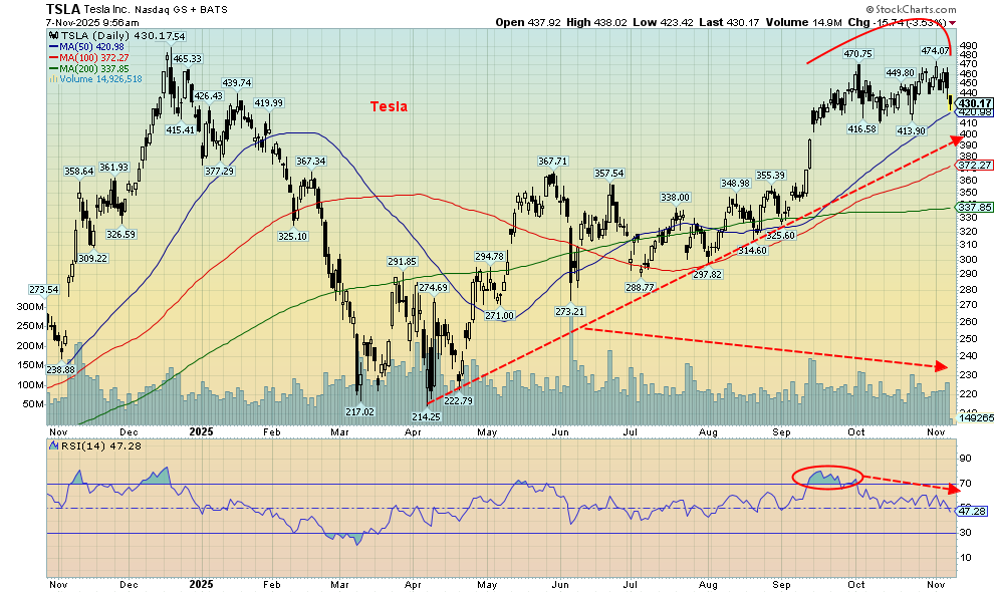
Source: www.stockcharts.com
Canada Job Numbers
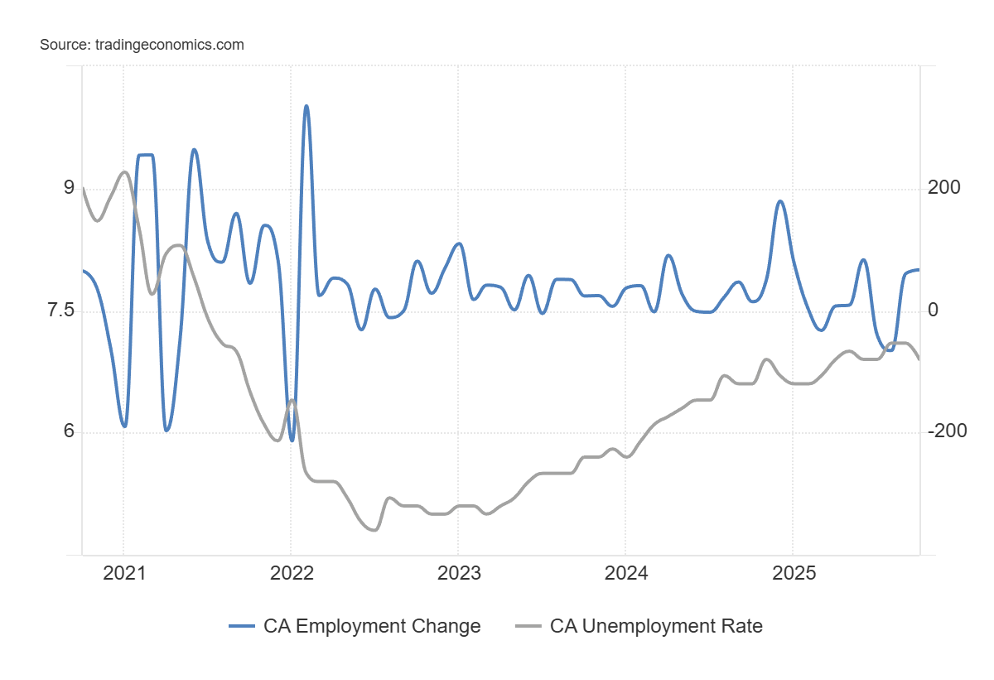
Source: www.tradingeconomics.com, www.statcan.gc.ca
In what was a complete surprise, Canada added some 66,600 new jobs in October. It follows a 60,400 gain in September. The market had expected a gain of only 5,000 while some estimates had Canada contracting. The unemployment rate fell to 6.9%, down from 7.1% and an expected 7.2%. Before we get too excited, however, part-time employment rose 85,100 while full-time employment fell 18,500.
The R8 unemployment rate, which adds in discouraged workers and involuntary part-timers, fell as well to 8.2% from 8.6%. Jobs up; unemployment rate down. Wages went up as well with average hourly wages up 4% year over year (y-o-y), above the expected 3.3%. Good news all around.
With the U.S. government shutdown, the Bureau of Labour Statistics (BLS) is shut down, so no U.S. job numbers.
Michigan Consumer Sentiment
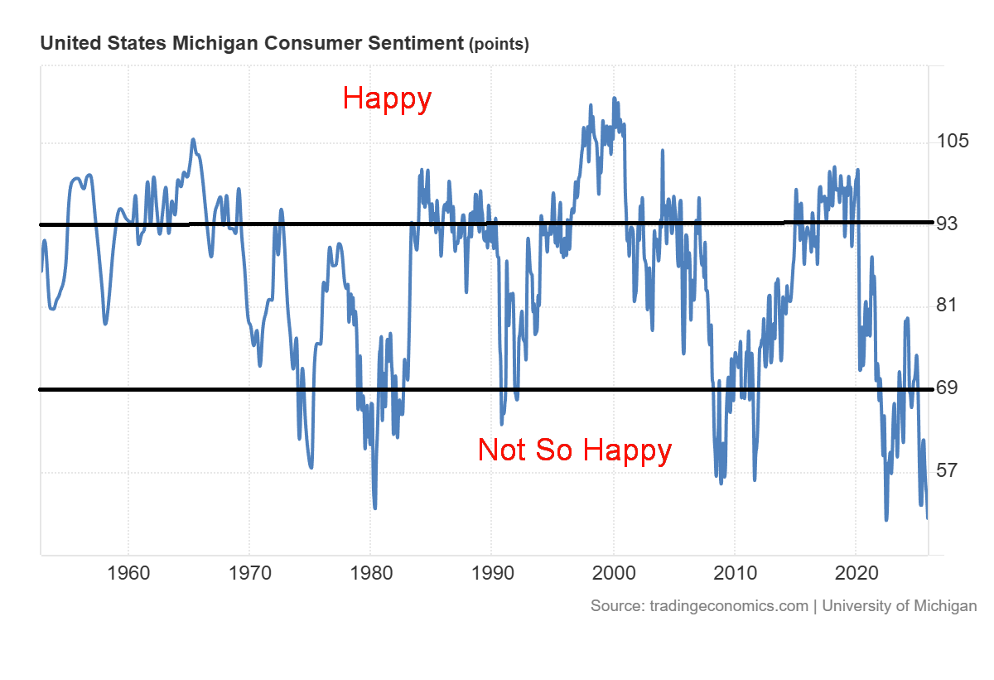
Source: www.tradingeconomics.com, www.umich.edu
The consumer is not very happy. The Michigan Consumer Sentiment Index (preliminary) for November fell to its second lowest reading on record, coming in at 50.3 below October’s 53.6 and below the expected 53.2. What can one say?
Rising layoffs, a government shutdown, air chaos, food stamps cut off for 41 million people, a majority struggling to survive while Gatsby-like bashes are held at Mar-a-Lago, and one man who could become a trillionaire. And we are not even in an official recession yet. But for many it feels like a recession, or worse.
Chart of the Week

Source: statista.com

Source: www.stockcharts.com
Is it a bird? Is it a plane? No, no, it’s Nvidia: the $5 trillion company, the largest company in the world, and the world leader in artificial intelligence computing. Oh yes, and Jensen Huang the founder, president, and CEO of Nvidia is on the Forbes’ billionaires list as the eighth wealthiest person in the world. At around $174 billion in net worth, Mr. Huang has some way to go to catch up to Elon Musk, the wealthiest person in the world at about $495 billion.
The chart from Statista (www.statista.com) shows that Nvidia has left both Meta and Alphabet (Google) in the dust as their combined worth is less than Nvidia’s. Even Apple and Microsoft are trailing as well. Five trillion dollars is a mind-boggling valuation for Nvidia, making it larger than Germany at $4.7 trillion, India at $4.2 trillion, and Japan at $4.2 trillion. All the gold ever mined in the world is worth only $7.5 trillion. It makes Nvidia the third largest country in the world, trailing only the U.S. and China. If Jensen Huang were a country, he’d be around the 57th largest country in the world, just behind Ukraine and ahead of Kuwait.
It is so crazy that some believe Nvidia could become the first quadrillionaire company. Really? The U.S. GDP is only $31.5 trillion. Nvidia has returned 3,315% since 2020. The S&P 500 returned only 112% and gold 164%. We can’t tell where Nvidia will top. But if a breakdown gets underway, Nvidia could accelerate under $180/183. So, what will it be? Is Nvidia at the heart of the golden age of AI? Or is it a dot.com bubble waiting to burst?
Markets & Trends
| % Gains (Losses) Trends | ||||||||
| Close Dec 31/24 | Close Nov 7/25 | Week | YTD | Daily (Short Term) | Weekly (Intermediate) | Monthly (Long Term) | ||
| S&P 500 | 5,881.63 | 6,728.80 | (1.6)% | 14.4% | neutral | up | up | |
| Dow Jones Industrials | 42,544.22 | 46,987.10 | (1.2)% | 10.4% | up (weak) | up | up | |
| Dow Jones Transport | 15,894.75 | 16,209.22 | 2.0% | 2.0% | up | neutral | up | |
| NASDAQ | 19,310.79 | 23,004.54 | (3.0)% | 19.1% | neutral | up | up | |
| S&P/TSX Composite | 24,796.40 | 29,912.19 | (1.2)% | 21.0% | down | up | up | |
| S&P/TSX Venture (CDNX) | 597.87 | 885.31 | (7.6)% | 48.1% | down | up | up | |
| S&P 600 (small) | 1,408.17 | 1,437.82 | 0.2% | 2.1% | down | up | up | |
| MSCI World | 2,304.50 | 2,826.36 | (0.9)% | 22.7% | down | up (weak) | up | |
| Bitcoin | 93,467.13 | 103,434.22 | (5.7)% | 10.7% | down | neutral | up | |
| Gold Mining Stock Indices | ||||||||
| Gold Bugs Index (HUI) | 275.58 | 579.51 | (0.2)% | 110.3% | down | up | up | |
| TSX Gold Index (TGD) | 336.87 | 698.43 | 1.2% | 107.3% | down (weak) | up | up | |
| % | ||||||||
| U.S. 10-Year Treasury Bond yield | 4.58% | 4.10% | 0.5% | (10.5)% | ||||
| Cdn. 10-Year Bond CGB yield | 3.25% | 3.18% | 1.9% | (2.2)% | ||||
| Recession Watch Spreads | ||||||||
| U.S. 2-year 10-year Treasury spread | 0.33% | 0.53% | 6.0% | 60.6% | ||||
| Cdn 2-year 10-year CGB spread | 0.30% | 0.73% | 1.4% | 143.3% | ||||
| Currencies | ||||||||
| US$ Index | 108.44 | 99.54 | (0.2)% | (8.2)% | up | down (weak) | down | |
| Canadian $ | 69.49 | 0.7126 | (0.1)% | 2.6% | down | neutral | neutral | |
| Euro | 103.54 | 115.66 | 0.3% | 11.7% | down | up (weak) | up | |
| Swiss Franc | 110.16 | 124.21 | flat | 12.7% | down | up (weak) | up | |
| British Pound | 125.11 | 131.61 | 0.1% | 5.2% | down | neutral | up | |
| Japanese Yen | 63.57 | 65.10 | 0.3% | 2.4% | down | down | down | |
| Precious Metals | ||||||||
| Gold | 2,641.00 | 4,002.01 | 0.1% | 51.5% | neutral | up | up | |
| Silver | 29.24 | 48.37 | (0.4)% | 65.4% | neutral | up | up | |
| Platinum | 910.50 | 1,541.80 | (1.4)% | 69.3% | neutral | up | up | |
| Base Metals | ||||||||
| Palladium | 909.80 | 1,405.50 | (3.1)% | 54.5% | neutral | up | up (weak) | |
| Copper | 4.03 | 4.94 | (3.0)% | 22.6% | up (weak) | up | up | |
| Energy | ||||||||
| WTI Oil | 71.72 | 59.89 | (1.5)% | (16.5)% | down | down | down | |
| Nat Gas | 3.63 | 4.32 | 5.6% | 19.0% | up | up | neutral | |
Source: www.stockcharts.com
Source: www.stockcharts.com
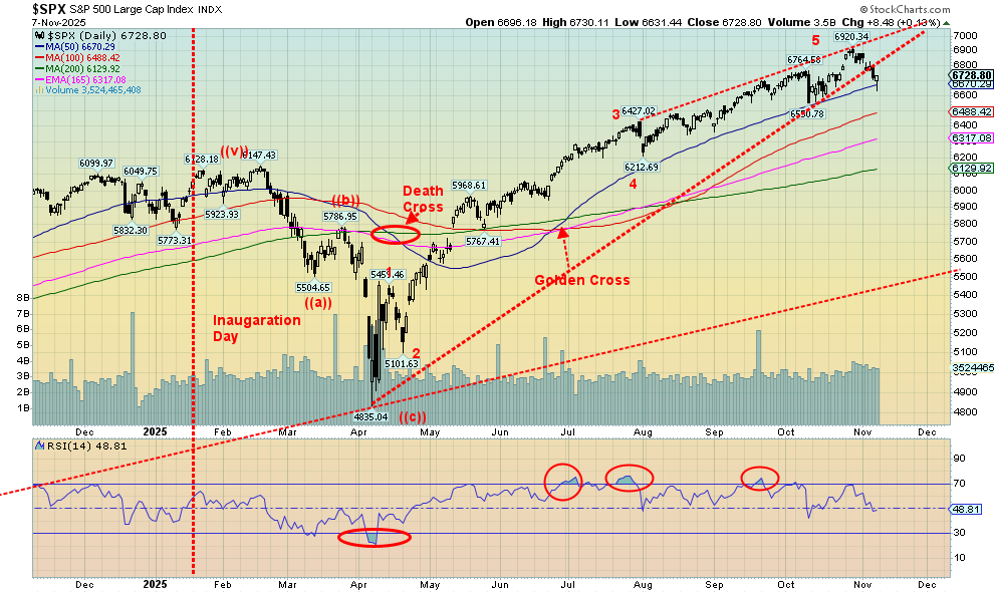
We are getting another dip in the stock market. We’ve seen this several times since the “Liberation Day” low in April. Each time it has been shrugged off and we go to new all-time highs. The question is, is this it? After all, firms are in better shape today than they were at the time of the 2008 financial crisis. Banks are in a better place (due to higher capitalization) to withstand any breakdown and increase in bankruptcies. Some regional banks are in trouble because of commercial real estate and auto lenders’ subprime loans. But they are not so big that it could cause a big problem for the money center banks led by JP Morgan Chase.
It was a down week as the government shutdown, falling consumer sentiment, and some signs of a weakening economy all helped push stock prices lower. On the week, the S&P 500 fell 1.6% and the Dow Jones Industrials (DJI) was down 1.2%, but surprisingly the Dow Jones Transportations (DJT) was up 2.0%. Maybe they like the chaos at the airports. The tech-heavy NASDAQ fell 3.0%. The NY FANG Index was down 3.0 as well. The S&P 500 Equal Weight Index dropped a small 0.2% as it is not weighed down by the MAG7 and FAANGs.
Speaking of them, it was not a good week for the MAG7. Meta fell 4.1% as did Microsoft, Tesla dropped 5.9%, Nvidia was dumped, down 7.1%, Advanced Micro was down 8.8%, Broadcom was off 5.4%, and ServiceNow was down 5.4%. In what may be telling, Trump Media (DJT) fell 14.5% to 52-week lows.
Elsewhere, the S&P 400 (Mid) was off a small 0.1% while the S&P 600 (Small) was up 0.2%. Bitcoin continued its recent woes, falling 5.7% and briefly dropping under $100,000. Is the Bitcoin rage over? In Canada, the TSX Composite fell 1.2% while the TSX Venture Exchange (CDNX) was whacked, down 7.6%.
In the EU, the London FTSE was down 0.5% after making all-time highs, the EuroNext was down 1.5%, the Paris CAC 40 was off 2.1%, and the German DAX was down 1.6%. In Asia, China’s Shanghai Index (SSEC) was up 1.1%, the Tokyo Nikkei Dow (TKN) continued its record-breaking run, making new all-time highs, but then reversed and closed down 4.1%. Hong Kong’s Hang Seng (HSI) rose 1.3%. The U.S., EU, and Canada were bad; Asia was good, except for Japan.
We are reluctant to call a top yet. Under 6,550 would be first sign of a possible top. But under 6,500 would be better and under 6,200 a top is confirmed. We are overdue for a correction at minimum. The S&P 500 gained 43% from that April low, even as it is up only 14.4% on the year. There have been few pullbacks since April. It’s overdue. New highs once again are possible if we regain above 6,830.
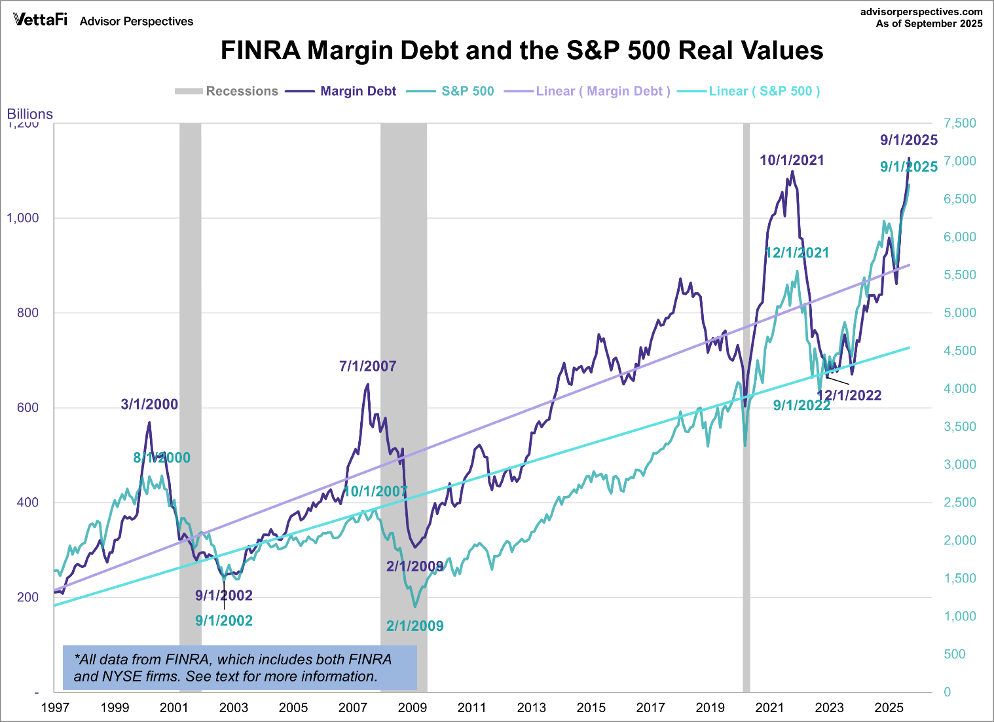
Source: www.advisorperspectives.com, www.finra.org
Another warning sign? FINRA margin debt is at record highs, far surpassing anything seen in 2000, 2007, and 2021. Our last number was in September so it may have come off somewhat since then, given what has occurred with a potentially deteriorating economy and the government shutdown. Worth keeping an eye on.
Source: www.stockcharts.com
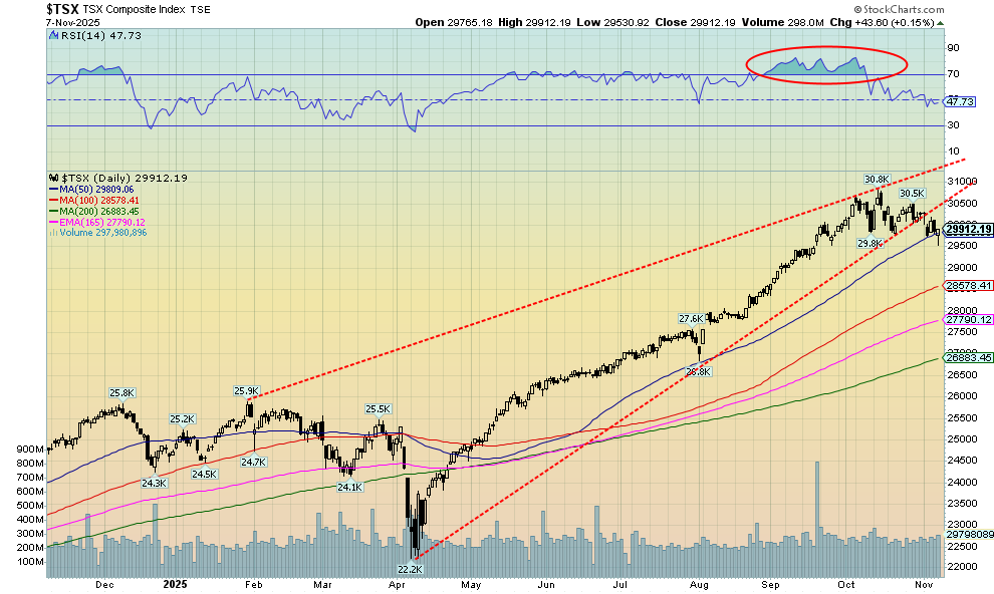
Has the TSX topped? Naturally, we can’t say that with any clarity yet, but this past week’s action suggests that the current correction may not yet be over. On the week, the TSX fell 1.2%. The junior TSX Venture Exchange (CDNX) saw a wave of profit-taking as it fell 7.6%. We appear to have broken an uptrend line from the April low. But so far, the 50-day MA (29,800) is acting as support. We hit a low of 29,530 before rebounding and closing at 29,912 on Friday. A break of 29,500 suggests lower with the next good support at 28,575. Of the 14 sub-indices, eight were up, one was flat, and five were down.
Information Technology (TTK) took the brunt of selling, down 7.6%. Because of its weight in the index, it helped push the TSX down on the week. Health Care (THC) lost 4.2%. The big winner was Energy (TEN), up 2.1% despite oil prices falling, although natural gas (NG) rose. Financials (TFS) were flat on the week. We believe an overdue correction is underway to correct that long period of overbought conditions. Reasonable targets might be down to 27,500. That’s a big rise to correct as the TSX gained almost 39% from that April low.
U.S. 10-year Treasury Note, Canada 10-year Bond CGB
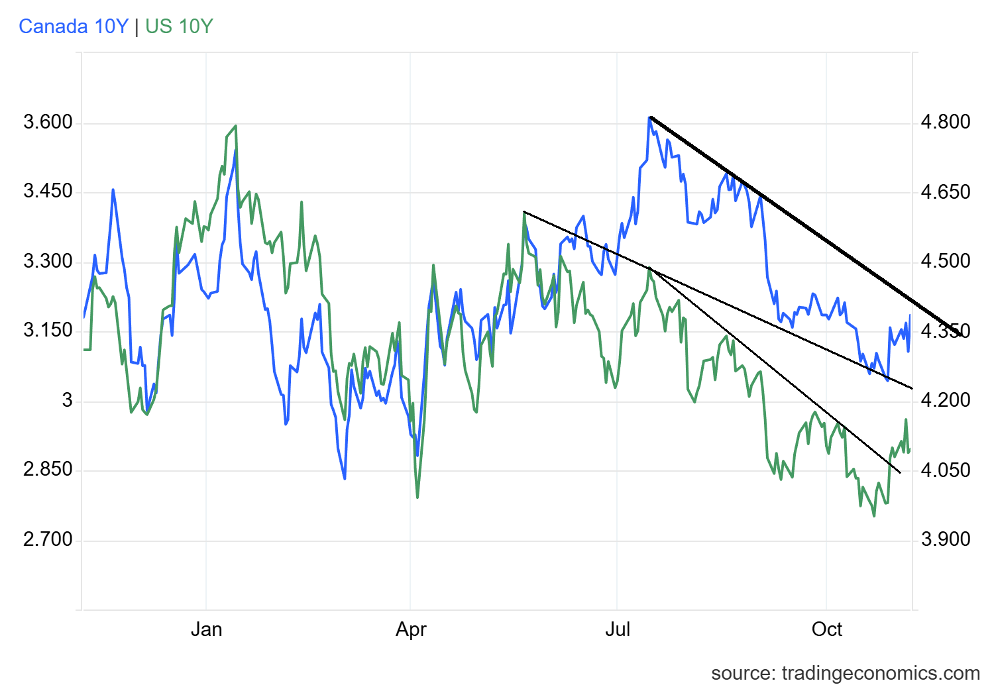
Source: www.tradingeconomics.com, www.home.treasury.gov, www.bankofcanada.ca
Signs of a weakening economy, falling consumer sentiment, and the government shutdown didn’t seem to bother bonds this past week. The U.S. 10-year Treasury note hit a high of 4.16% before settling back at 4.10%, up 2 bp on the week. Canada, meanwhile, encouraged by the gangbusters jobs report saw its 10-year Government of Canada bond (CGB) rise 6 bp to 3.18%.
The surprise jobs report now has pundits suggesting that the Bank of Canada (BofC) may not cut rates next month. On the other hand, the Fed may have no choice but to cut rates, given the deteriorating situation in the U.S. Bad news in the U.S. eventually flows over into Canada. The U.S. 10-year doesn’t really break until above 4.30%. On the other hand, a drop through 4.00% again suggests lower yields ahead. Both the Canada 10-year and the U.S.10-year appear to be in downtrends that haven’t yet found their low.
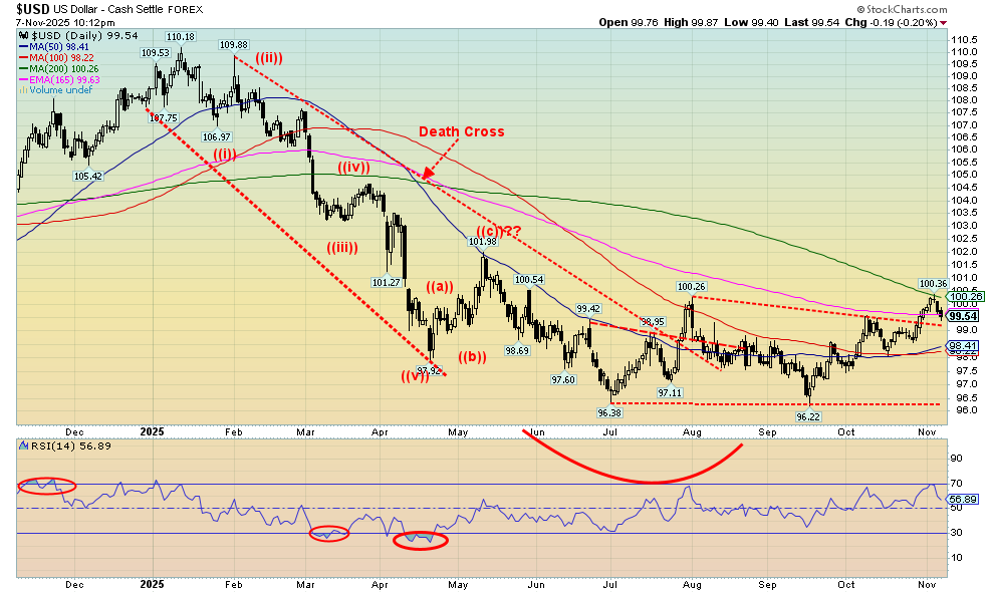
Source: www.stockcharts.com
Not much to say about currencies this past week as movement was very small. Yes, the US$ Index broke out of what appears to be a bottom pattern, but so far follow-through is weak. We ran into resistance at 100.30, the area of the 200-day MA. On the week, the US$ Index fell 0.2%, the euro was off 0.3%, the Swiss franc was flat, the pound sterling was down 0.1%, and the Japanese yen was up 0.3%.
The Cdn$ fell just under 0.1% during budget week. We need to break over 100.50 to suggest higher levels. If the bottom pattern is correct, targets could be 103.00. A break of 98.40 suggests we are going lower, possibly to new lows.
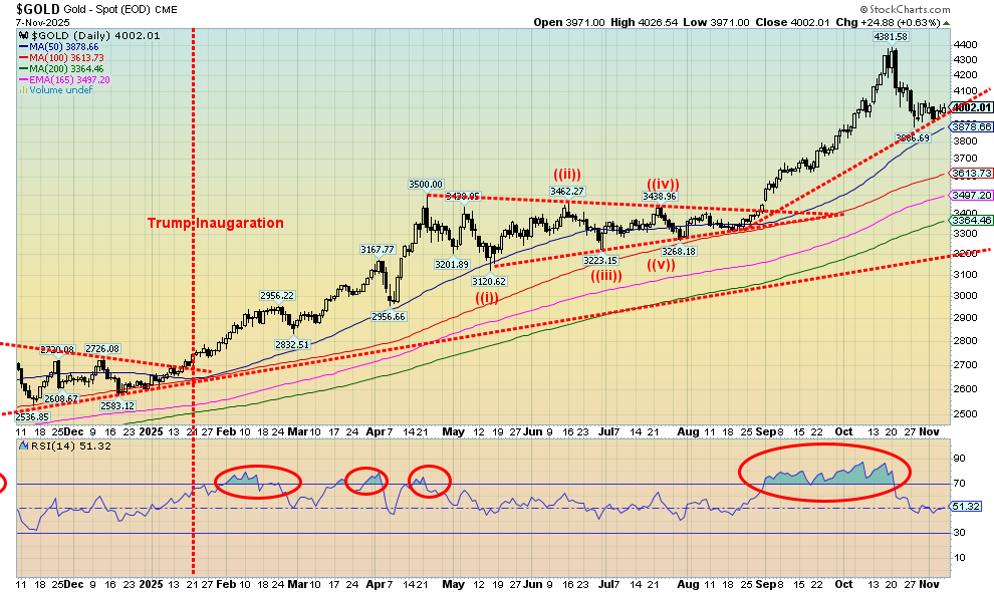
Source: www.stockcharts.com
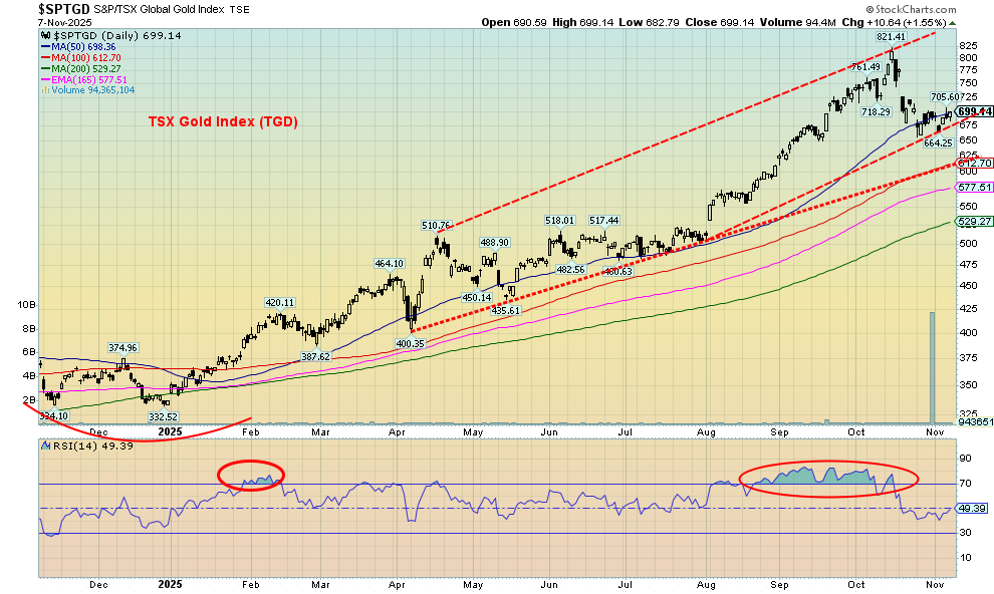
Gold is going through an overdue correction. We had never seen such a long period of overbought (RSI) conditions before. Gold rose this week a small 0.1%. Gold rebounded on Friday as concerns mounted over the government shutdown and the lack of jobs data. Yes, there are private surveys, but, overall, they don’t replace what is released by the BLS. Central bank purchases are also continuing.
So far so good, in that gold appears to be holding near $4,000. However, we would not be surprised to see it fall further with a breakdown under $3,900. That could target down to $3,600 where gold would be making a healthy correction following that overbought period.
Gold rose 0.1% on the week, silver fell 0.4%, platinum was down 1.4%, palladium lost 3.1%, and copper fell 3.0%. All in all, not a particularly good week for the precious metals (PMs). We need to regain back above $4,210 to suggest new highs. We remain bullish on gold for the long term, but this correction was clearly overdue. Following a low which we expect sometime in November or even December, we expect to rise to new highs in Q1 2026.
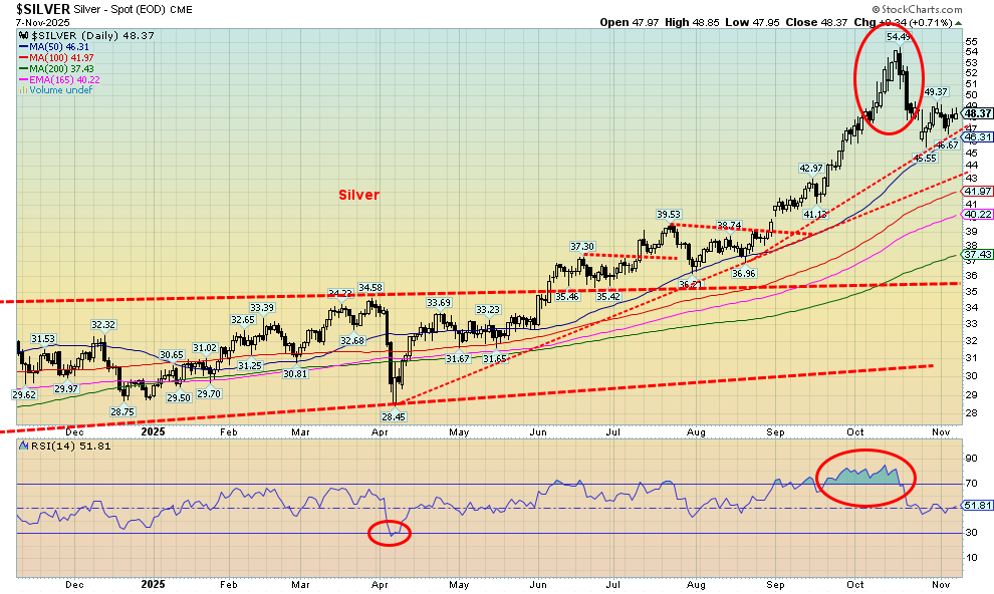
Source: www.stockcharts.com
Silver continues to correct that extreme overbought period as it fell a small 0.4% this past week. Like gold, it was largely a dull week. Possibly helping silver going forward is that the U.S. added silver to its list of critical minerals. That’s interesting as the U.S. relies heavily on imported silver. Mexico is the world’s largest silver producer, producing upwards of six times more than the U.S. who ranks eighth. China is number two and even they produce over three times more than the U.S. The U.S. is the world’s largest of importer of silver, followed by the U.K. The U.S. imports about double what the U.K. imports. Silver is heavily used in industry for electronics, cars, solar panels, chemicals, and a lot more.
We may have a support zone near the 50-day MA ($46.31). A break under $46 would send us down towards $43 which may be our ultimate target. Silver needs to regain above $52.60 to suggest new highs. We are not oversold yet. Silver miners have done well this year with the Silver Miners ETF (SIL) up for the year to date 104% vs. silver’s gain of 65.4%. The Junior Silver Miners ETF (SILJ) is up 118%. That’s marginally better than the gold miners ETFs GDX and GDXJ.
Source: www.stockcharts.com
Gold stocks flopped around this past week, forming what might be a B wave. To come, a possible C wave to the downside. On the week, the Gold Bugs Index (HUI) was down 0.2% while the TSX Gold Index (TGD) rose 1.2%. For the TGD there is some resistance at 750, but we need to break back above 765 to suggest new highs.
We are currently hovering around the 50-day MA, but a good break of 660 suggests lower prices, possibly to that next support line near 610. A break of that line could send us even lower. The 200-day MA is currently at 529. We remain bullish on gold stocks but recognize this is an overdue correction to one of the most overbought periods we’ve ever seen. In that respect this correction is healthy and needed.
Source: www.stockcharts.com
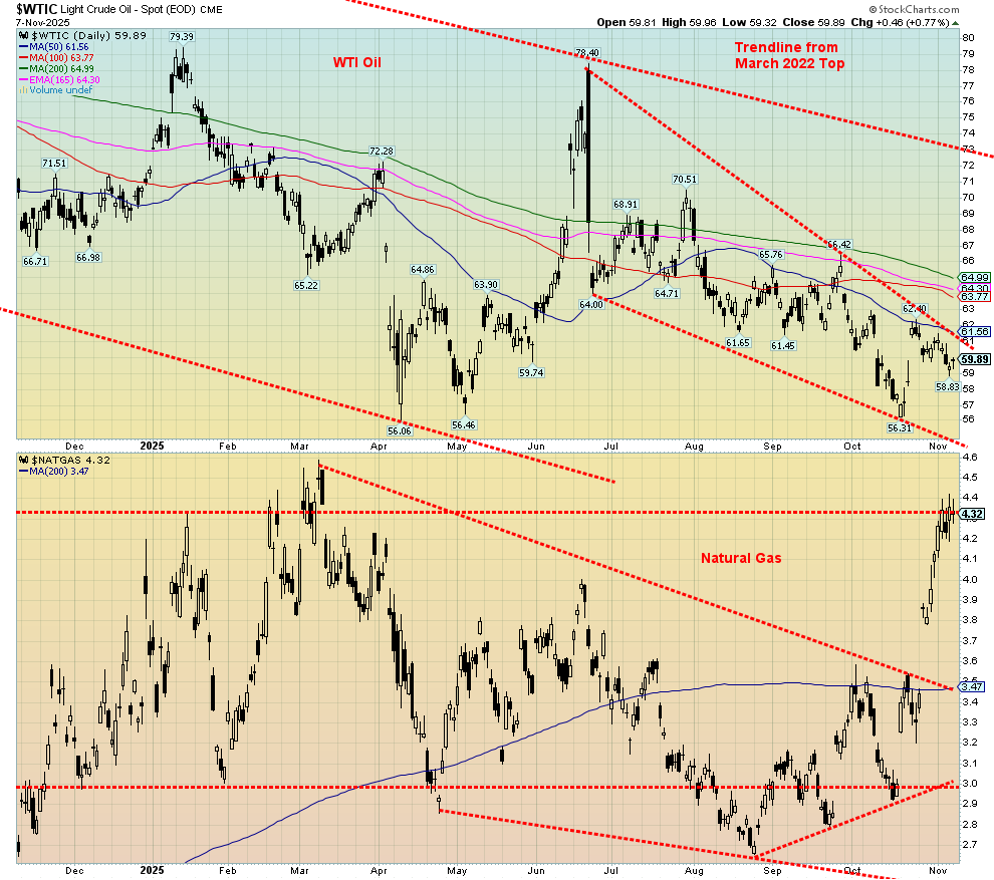
So, which is it? A world awash in oil along with subdued demand pushing prices to their lowest level in years? Or the potential for blow-ups in Russia, Venezuela, and the Middle East that could push oil prices sharply higher? Pushing prices lower may be good for consumers, but it could prove disastrous for producers who depend on higher prices; for example, Alberta with its high cost of extracting oil, shale oil producers, and Russia needing to finance its war with Ukraine. Or the other way where higher oil prices ignite inflation.
We might add in the current U.S. government shutdown, which is negatively impacting airports, thus reducing the number of flights and using a lot less gasoline. Or even the U.S.’s push to “drill, baby, drill,” thus potentially pushing more oil on the market. That the easy-to-find oil has already happened is besides the point. That leaves deep underwater, environmentally difficult places such as Northern Alaska and the Arctic, and opening national parks to drilling. All that translates into is a somewhat bearish outlook for oil.
It’s admittedly baffling as the chart below shows the performance of WTI oil vs. the ARCA Oil & Gas Index (XOI) and the TSX Energy Index (TEN). While oil prices have been falling, the XOI and TEN are slowly rising. Their returns since 2020 are roughly four to six times better than oil itself. Are they hinting that oil prices could soon rise?
That descending wedge triangle on WTI oil also suggests that we could break out to the upside. We’d need to get above $73 to suggest to us that we really are going higher. This past week WTI oil fell 1.5% while Brent crude dropped 1.2%. Meanwhile, the XOI rose 0.6% and the TEN was up 2.1%. Oil down; energy stocks up. Maybe it was all because of natural gas (NG) that jumped another 5.6% this past week.
NG is being driven by record LNG demand as Europe is still trying to wean itself off Russian oil and gas. It didn’t, however, do much for EU NG at the Dutch Hub as it fell 0.3%. It seems their problem is too much NG in storage. NG is encountering resistance at $4.40/$4.50. Will it bust through? The all-time high for NG was set in 2022 at the height of the Russian invasion of Ukraine, reaching $10.04. A pause for NG wouldn’t be a surprise, given it is currently overbought.
We’re encouraged by the energy stock’s outperformance and that compelling descending wedge. Seasonally, December to June is the strongest period for both oil and gas. We await a rise and a catalyst.
Performance WTI Oil vs. XOI and TEN 2020-2025

Source: www.stockcharts.com
__
(Featured image by Jakub Żerdzicki via Unsplash)
DISCLAIMER: This article was written by a third party contributor and does not reflect the opinion of Born2Invest, its management, staff or its associates. Please review our disclaimer for more information.
This article may include forward-looking statements. These forward-looking statements generally are identified by the words “believe,” “project,” “estimate,” “become,” “plan,” “will,” and similar expressions, including with regards to potential earnings in the Empire Flippers affiliate program. These forward-looking statements involve known and unknown risks as well as uncertainties, including those discussed in the following cautionary statements and elsewhere in this article and on this site. Although the Company may believe that its expectations are based on reasonable assumptions, the actual results that the Company may achieve may differ materially from any forward-looking statements, which reflect the opinions of the management of the Company only as of the date hereof. Additionally, please make sure to read these important disclosures.
Copyright David Chapman 2025
David Chapman is not a registered advisory service and is not an exempt market dealer (EMD) nor a licensed financial advisor. He does not and cannot give individualised market advice. David Chapman has worked in the financial industry for over 40 years including large financial corporations, banks, and investment dealers. The information in this newsletter is intended only for informational and educational purposes. It should not be construed as an offer, a solicitation of an offer or sale of any security. Every effort is made to provide accurate and complete information.
However, we cannot guarantee that there will be no errors. We make no claims, promises or guarantees about the accuracy, completeness, or adequacy of the contents of this commentary and expressly disclaim liability for errors and omissions in the contents of this commentary. David Chapman will always use his best efforts to ensure the accuracy and timeliness of all information. The reader assumes all risk when trading in securities and David Chapman advises consulting a licensed professional financial advisor or portfolio manager such as Enriched Investing Incorporated before proceeding with any trade or idea presented in this newsletter.
David Chapman may own shares in companies mentioned in this newsletter. Before making an investment, prospective investors should review each security’s offering documents which summarize the objectives, fees, expenses and associated risks. David Chapman shares his ideas and opinions for informational and educational purposes only and expects the reader to perform due diligence before considering a position in any security. That includes consulting with your own licensed professional financial advisor such as Enriched Investing Incorporated. Performance is not guaranteed, values change frequently, and past performance may not be repeated.


TopRanked.io Weekly Affiliate Digest: What’s Hot in Affiliate Marketing [Bovada Affiliate Program]
This week, we're mashing up 80s tech with 2020s private messaging apps. Why? Because Big Tech just dropped a big...


Euro Stablecoins Struggle to Compete with Dollar Dominance in Crypto Markets
Euro stablecoins remain marginal despite the euro’s global importance, with minimal trading volume compared to dollar rivals like USDT and...


Gilead Sciences Advances Growth Strategy with Focus on HIV, Oncology, and Innovation
Gilead Sciences focuses on developing treatments for HIV, cancer, and inflammatory diseases, driven by blockbuster drugs like Biktarvy. Growth relies...


Casablanca Stock Exchange Profits Surge in 2025 as Growth Momentum Strengthens
In 2025, Casablanca Stock Exchange profits rose 40% to MAD 50.9 billion. Net income grew 22.3%, driven by strong industrial...


Credibur Scales Rapidly: €2 Billion in Structured Debt Facilities in Six Months
Infrastructure fintech Credibur has added over two billion euros in structured debt facilities within six months. Its platform connects lenders,...
 |
|
 |  |
 |
|
-

 Crowdfunding2 weeks ago
Peru’s Crowdfunding Sector Shrinks Amid License Revocation
-

 Crowdfunding1 day ago
Democratizing Farmland Investment: The Rise of Farm Fractions in Agritech
-

 Crowdfunding1 week ago
Cyberpunk Trading Card Game Surges Past Goals on Kickstarter
-
 Business4 days ago
Markets Volatility, Geopolitics, and Signals of a Potential Trend Shift