Business
Markets Whipsaw as Rate Fears and Bubble Risks Intensify
Markets swung sharply as Nvidia’s strong earnings clashed with expectations that the Fed may delay rate cuts. Volatility hit the MAG7, reviving bubble concerns fueled by cheap money and AI exuberance. Rising Japanese rates threaten the carry trade, adding risk. Global markets and commodities fell, though Dollarama stood out with stronger sales and earnings.

There are some who will argue against AI being in a bubble. After all, many expect AI to change the world. Companies are making all sorts of new investments and building new data centers to power computers for AI. (Note: AI uses lots of energy).
The result is that many see AI stocks making an infinite amount of profits. It’s a “ride the wave” mentality. As long as it’s going up, just follow the trend. It also helps that, as was the case with previous bubbles, oodles of liquidity and low interest rates have helped fuel the rise. And it helps that the demand for AI stocks exceeds its supply.
AI bubble
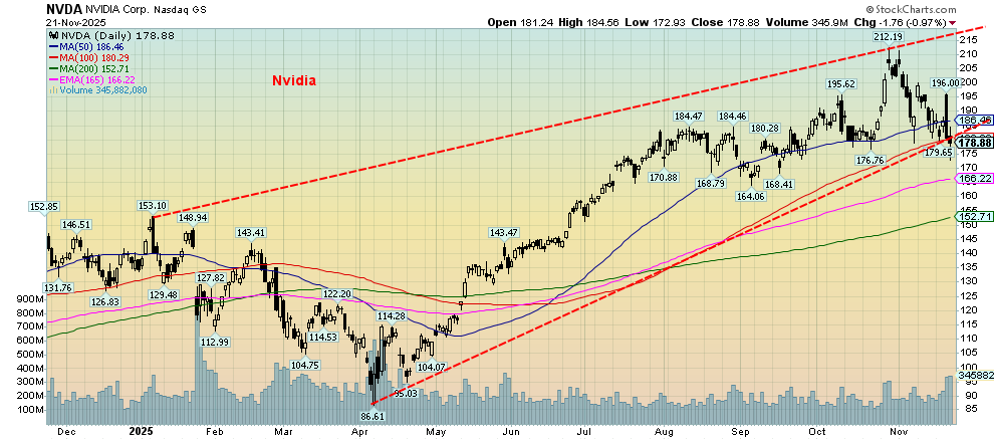
Nvidia has been the star. Nvidia first started trading in 1999 and for the next 16 years it was just a penny start-up company. Then, all of sudden, it wasn’t. Since a final low in 2013 at 26 cents Nvidia increased over 800 times. Even in 2019 one could have picked up Nvidia at just over $3. The peak? That was a mere three weeks ago at $212. We’re not even sure any dot.com stock did that, although we haven’t checked.
Over the past 100 years or so we’ve experienced at least three stock market bubbles of note: the Roaring Twenties bubble, the dot.com bubble, and now the AI bubble. Along the way we did have the Nifty Fifty rise in the 1970s and the housing bubble of the early 2000s. Other markets and countries experienced bubbles as well, such as Japan in the 1980s, arguably gold in the 1970s, and China in the 2010s. There is a long history of bubbles. As we have noted before, Charles Mackay’s book Extraordinary Popular Delusions and the Madness of Crowds outlined three famous ones: tulip mania (1634–1637), the Mississippi scheme (1719–1720), and the South Sea Bubble (1720). We are, it seems, forever blowing bubbles.
Source: www.stockcharts.com
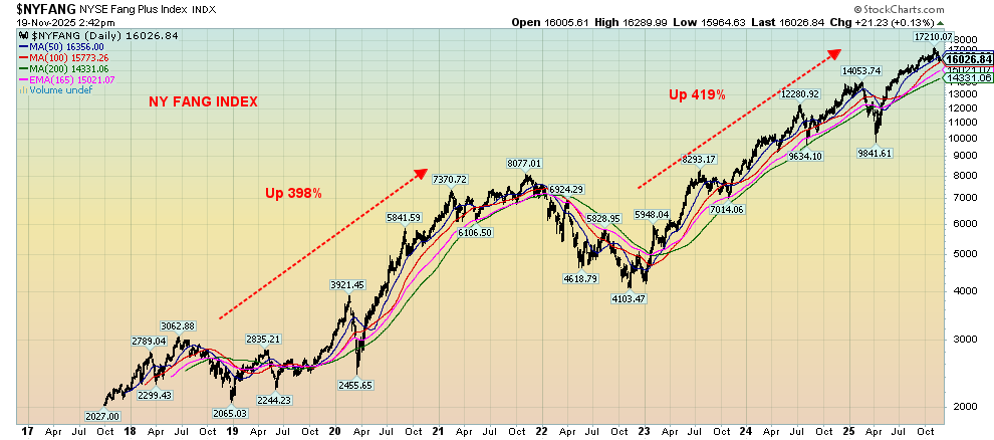
The best representation of the current AI bubble is the NY FANG Index. It contains the MAG7 – Apple, Amazon, Google, Meta, Microsoft, Tesla, and Nvidia – along with CrowdStrike, ServiceNow, and Broadcom. Maybe they should call it MAG10, but MAG7 has a better ring to it.
We identified two phases of rise. First, from 2017 to 2021, and, second, from 2022 to 2025. The NY FANG rose 398% in the first phase and 416% in the second. Altogether, from that start-out low in 2017, the NY FANG Index rose 8.5 times. We don’t know how this bubble will burst. The big banks aren’t as involved with AI companies as they were with the housing market of the early 2000s.
They were using subprime mortgages and collateralized debt obligations (CDOs) to pump the market. Simply put, AI companies would not have the same impact on the economy if they collapsed that the housing market collapse did. However, AI companies are loading up on debt to finance their purchases of other companies and also to build their data centers. They are taking on all this debt to finance something that actually doesn’t exist yet. What could go wrong?
Going back a few years to the 1920s, that period also exploded on a wave of new technology: cars, and massive use of electricity to run factories, leading to widespread use of refrigerators, household appliances, and radio. And add in movies. It was a go-go period, but probably only about 20% of the population benefited from it.
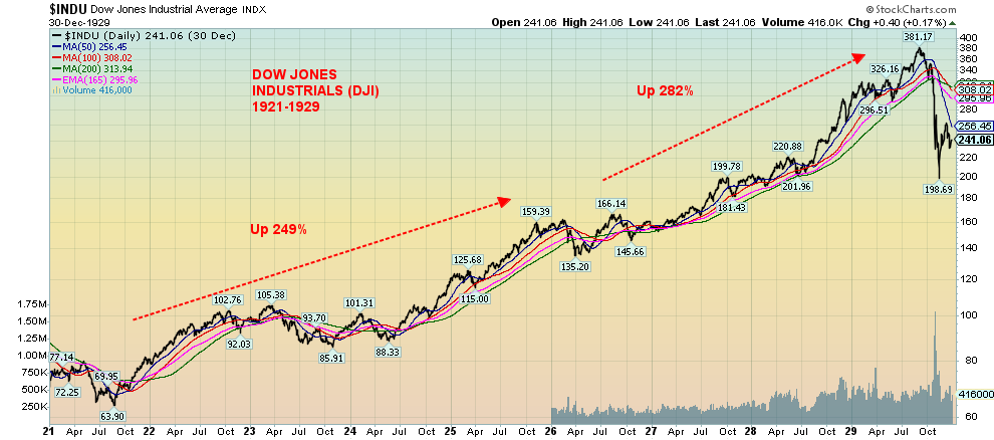
Like all bubbles, this one was debt-fueled. Use of broker margin loans exploded. Everybody was trying to get in and get rich. Go to the bank, borrow money; after all, the stock market just keeps going up. From that low in 1921 that ended the post-war depression, the Dow Jones Industrials (DJI) rose six times. We’ve identified two periods: 1921–1925 where the DJI was up 249% and 1926–1929 when the DJI leaped 282%. It was an exciting period.
But it came crashing down in October 1929 when all the borrowing and margin loans smashed onto each other and panic buying turned into panic selling. In August 1929, just before the crash, the Fed hiked interest rates to try and cool off the heated market. Combine that with banks tightening credit and calling in loans that could not be repaid. Bank failures followed, leading to a sharp decline in money supply and credit, and then consumers added to it by stopping buying – or was it being unable to afford any more cars, appliances, etc.
There were numerous instances of people selling their cars for cash and farmers trying to sell their farms. Except there were few buyers.
No, the stock market crash was not the major cause of the Great Depression, but it contributed mightily. In 1930, the Smoot-Hawley Act triggered trade wars and, as the trade wars deepened, factories closed, throwing thousands out of work. A drought didn’t help things, and many lost their farms. The DJI fell 89% from 1929–1932. It took until 1954 to get back to break even.
Source: www.stockcharts.com
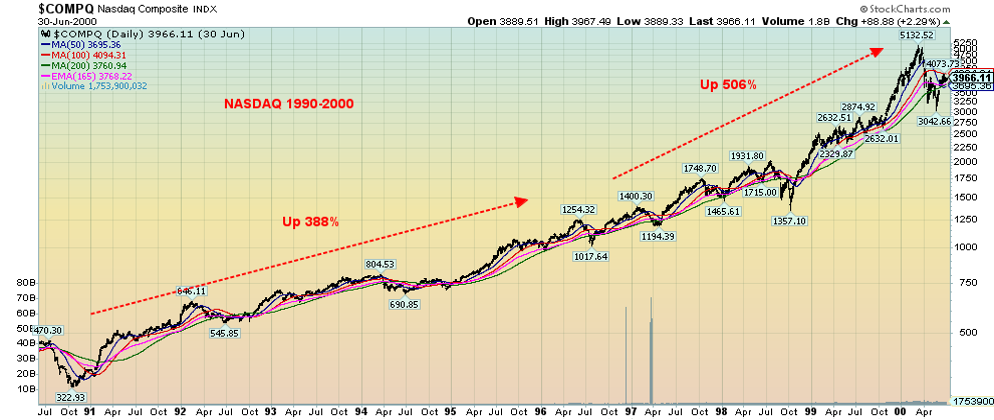
Fast forward to the 1990s. The internet became the big thing. Technology companies popped up everywhere. Everyone rushed in to buy, looking for huge gains as these companies proliferated and exploded upward. Profits be damned. The internet companies promised endless profits rather than earnings. By 1999, all the talking heads on CNBC, Fox, and elsewhere could talk about was the latest internet company. Anyone remember Pets.com? Dozens of others jumped up. It became a feeding frenzy. Until it didn’t.
From that low in 1990 to its peak in 2000, the NASDAQ rose almost 16 times. Many individual companies rose even more. Credit was easy. The Fed cut interest rates in the early 1990s. Events like the October 1987 stock market crash and the Iraq war of 1990 were in the rearview mirror. What could go wrong? The Asian financial crisis of 1997 put a dent in things, but its effect was relatively short-lived, and it was ‘’over there.’’
The Russian debt collapse of 1998 and the subsequent collapse of the hedge fund Long Term Capital Management (LTCM) sparked a real crisis on Wall Street as LTCM was leveraged up to 100 times and the Russian debt default was in the billions. Wall Street was threatened. It took a cadre of Wall Street banks to bail out LTCM plus the Fed providing oodles of liquidity and lowering interest rates sharply to prevent a collapse. When the dust cleared, LTCM was gone, Wall Street was saved, and we started the final phase of the dot.com bubble.
Again, we note two phases: 1990–1996 when the NASDAQ rose 388% and 1996–1997 when the NASDAQ rose 506%, even as it was severely interrupted in 1998 by the Russia/LTCM collapse. Overall, the dot.com collapse and subsequent recession was rather mild. The period was exacerbated by the September 11, 2001, attacks (9/11). As the collapse took hold, many dot.com companies were wiped out. The NASDAQ collapsed some 80% before bottoming in 2002. It took the NASDAQ until 2015 to get back to break even.
Source: www.stockcharts.com
Will the AI bubble explode like the 1920s bubble and the 1990s bubble? We don’t know. There are other problems out there besides the AI bubble. Commercial real estate and subprime auto loans are two areas. Regional banks are having trouble, but no word on any money center banks in trouble. Could there be a big sudden default by an AI company? The AI bubble looks a bit more like the housing bubble of the 2000s than the dot.com bubble. Okay, AI is not houses. But AI companies have been leveraging up. And that is never a good sign. It works great in a rising market. Not so much in a falling one.
Does Nvidia keep the bubble alive? Nvidia reported blowout earnings that sparked a big jump in not just Nvidia but the rest of the MAG7 and the stock market. Nvidia and the market rose, then Nvidia and the stock market reversed closing sharply lower, all in the same day. Not a good sign. Then everybody rose again the next day. Failure to make new highs and a breakdown under $180 spells trouble for Nvidia. And if Nvidia breaks, the rest will follow.
Michael Burry, the hedge fund manager depicted in The Big Short, a movie about the factors behind the 2008 financial collapse, has warned about the big tech stocks. He knew something going into the global financial crisis of 2007–2009. Maybe he knows something again. Nvidia and its CEO Jensen Huang don’t think so. Nonetheless, Nvidia remains the most valuable company in the world, with an estimated market cap of $4.7 trillion.
The NY FANG Index, which represents the MAG7 plus, has had quite a run. No, we don’t see a breakdown yet. But in the euphoria, we are carefully watching for signs that this too will come to an end. Investors are heavily invested in AI held in mutual funds, ETFs and retirement accounts. Indicators are flashing danger. But the market is paying them little heed. Nothing lasts forever.
Source: www.stockcharts.com
Japan teetering?
Japan’s 10-year government bond (JGBs) yield has soared over 1.80%. This is astounding. It’s the highest level in over a decade – two, actually. For the first time in years, the interest rate has climbed over the rate of inflation. Years of yield curve control, quantitative easing (QE), suppression of yields, and financial repression seem to be coming apart. Japan did this to try and stimulate its moribund economy that has gone through years of slow growth and recession after the collapse of the 1980s real estate and stock market bubble. It was only in 2022–2023 that the Tokyo Nikkei Dow (TKN), Japan’s premier stock market index, recovered its 1990 high. A long period of 32 years.
Japan is extremely sensitive to interest rates. Its government debt to GDP is an astounding 236%, the highest in the G7 and, if not for Sudan, the highest in the world. Japan has been printing money for years. Its money supply has exploded, particularly in the last five years, in order to prevent a collapse during the pandemic. For years, interest rates were held below 1% and even for a time below 0%. Now the maturities are having to refinance themselves at sharply higher rates. The bulk of the maturities are short dated.
The rise is destroying the yen carry trade. For years one could borrow at ridiculously low rates, then convert and invest in bonds, usually in the U.S., at sharply higher rates. But it was more than U.S. treasuries and included Eurobonds, crypto, and emerging markets, anywhere where the return was higher. That trade worked as long as interest rates stayed low, and the Japanese yen was at least steady. No longer. Interest rates are rising rapidly, and the Japanese yen is falling rapidly. It’s a scramble to unwind the trade. They sell U.S. treasuries to buy yen. It is estimated there is some $3.2 trillion tied up in the yen carry trade.
It’s even worse as Japanese pension funds are full of junk bonds that are rapidly losing value. But not all these junk bonds are with pension funds. Many Japanese zombie companies hold them as well, estimated at $3 trillion. They are called zombie companies because, technically, they have been bankrupt for years but are kept on life support in order not to spark a collapse. Japan has been a piggy bank for the world. But it now seems to be coming unraveled. Japan is the largest holder of U.S. treasuries, some $1.2 trillion. The Bank of Japan (BOJ) is expected to hike rates at its December meeting, putting more pressure on the market.
Japan – Bank of Japan (BOJ) interest rate, 10-year government bond yield (JGBs), Japanese inflation rate 2015–2025
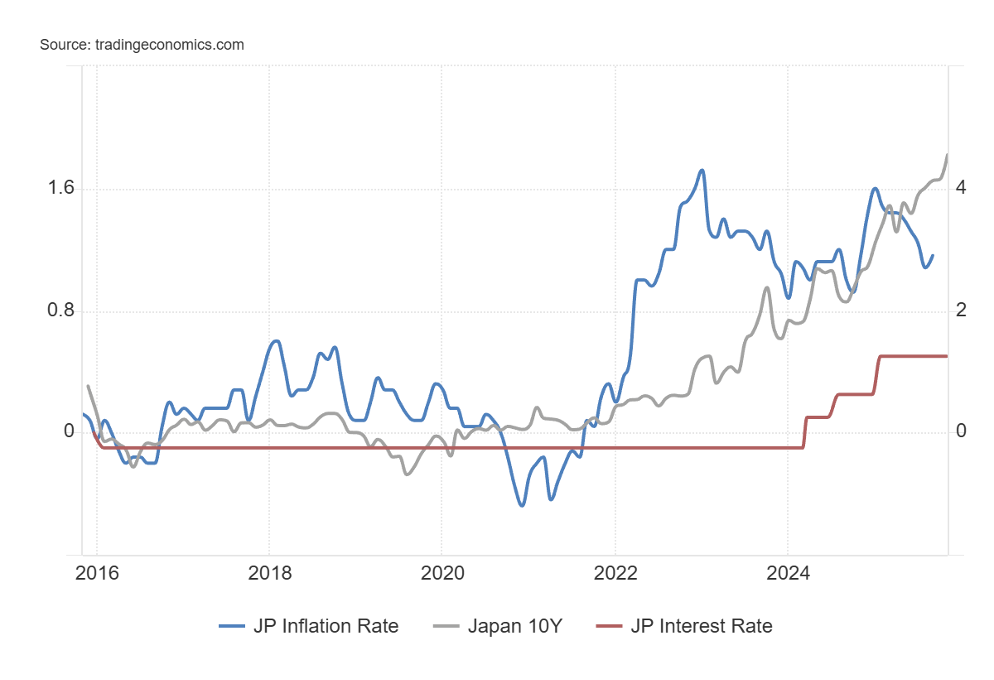
Source: www.tradingeconomics.com, www.soumu.go.gp, www.boj.or.gp
Japan Government Debt/GDP 2000-2025
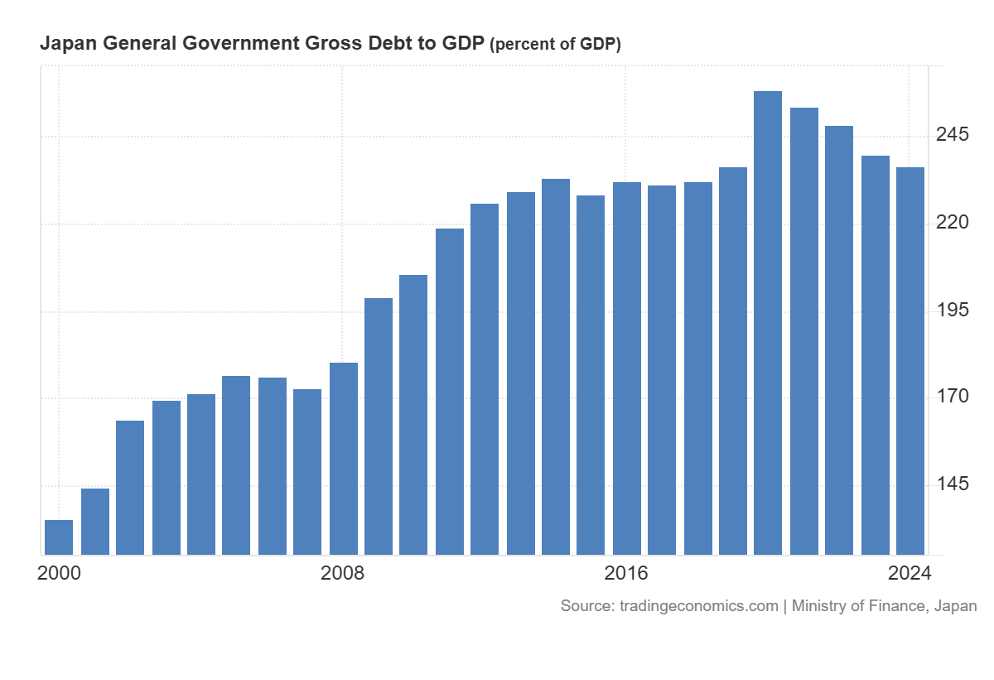
Source: www.tradingeconomics.com, www.mof.go.jp
All this goes further. The Japanese stock market is built on the cheap money as well. Now the stock market might not look so good. There are potential losers all around the world: U.S. treasuries and the U.S. stock market, emerging market currencies, euro debt. None are properly priced for a collapse of the yen and the sharp rise in Japanese bond yields.
No wonder that, as the Japanese yen sinks, the value of Japanese yen in terms of gold is soaring. Will the rest of the world feel the unwinding of Japan, the world’s fourth largest economy? Its GDP is slowing and there are signs it could soon fall into recession. Its bonds are rated A+, but the outlook is turning negative. If there is a collapse in Japan, it will take the rest of the world with it.
Japanese Yen, Japanese Yen in Gold 1977–2025 (weekly)
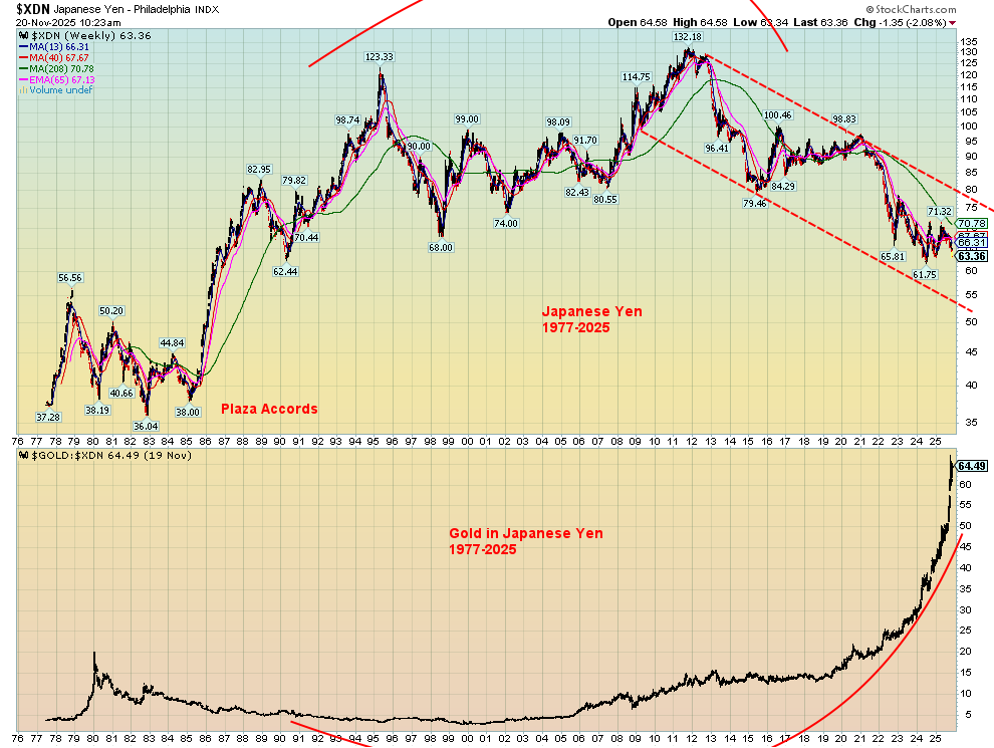
Source: www.stockcharts.com
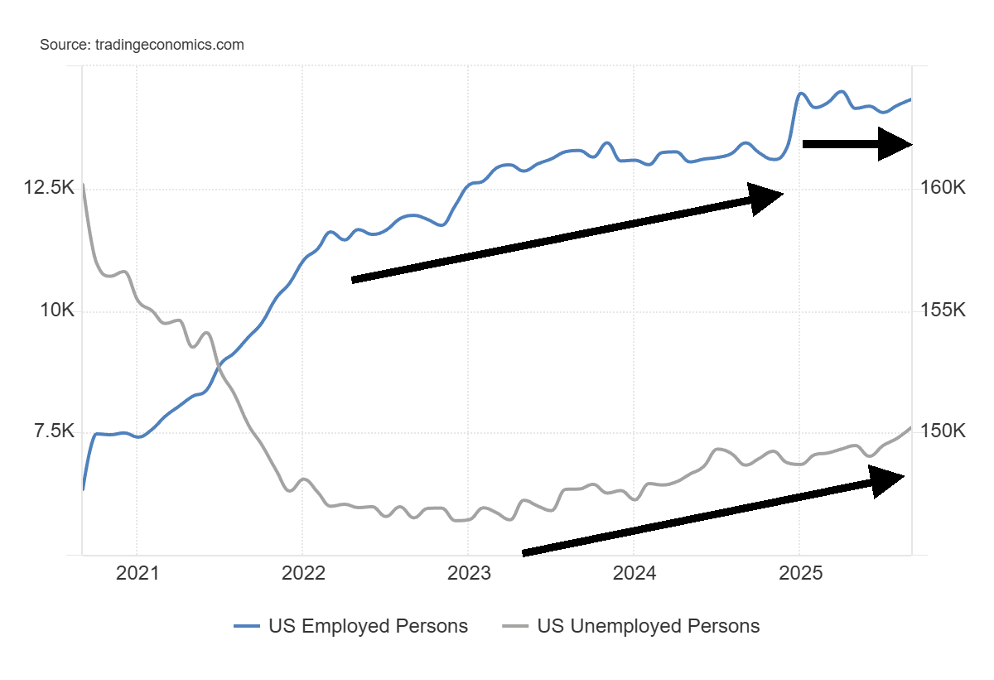
Chart of the Week
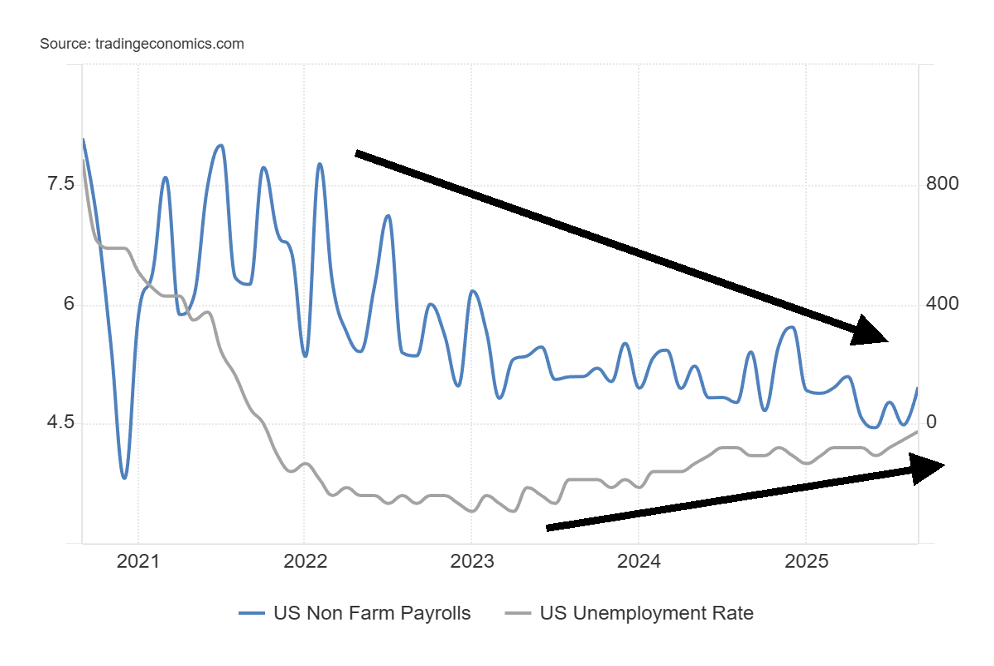
Source: www.tradingeconomics.com, www.bls.gov
After a six-week government shutdown where we missed two employment reports (September and October), we unexpectedly saw the release this past week of the September employment report. No word yet on whether we will receive the October report and, if so, when. Initial indications are that the October report is to be cancelled. The October CPI is also to be cancelled.
The report was not quite as expected. Nonfarm payrolls rose 119,000 jobs in September, above the estimate of 50,000. The August nonfarm was revised downward to a decline of 4,000 jobs from a gain of 22,000. July was also downgraded to a gain of 72,000 jobs from 79,000. Primary gains were in healthcare and food services, while transportation, warehousing, and storage took hits.
Once past those numbers, others were twisted. The civilian labour force grew by 470,000. But then the population level, which includes all those 16 years of age and over, grew by 441,000. And then the employment level rose 573,000. The unemployment level rose by 219,000, while those not in the labour force rose by 43,000. (Source: www.stlouisfed.org, www.bls.gov)
All this led the unemployment rate to rise to 4.4% from 4.3%. The U6 unemployment rate, the highest reported by the BLS, (plus all persons marginally attached to the labour force, plus total employed part-time for economic reasons, as a percentage of the civilian labour force, plus all persons marginally attached to the labour force) fell to 8.0% from 8.1%. Shadow Stats (www.shadowstats.com) August unemployment was 28% vs. 27.8% in July. (The ShadowStats-Alternate Unemployment Rate uses the current unemployment reporting methodology, adjusted for the significant portion of “discouraged workers” defined away in 1994 [discouraged less than one year].
Shadow Stats adjusts that BLS measure to include the Shadow Stats estimate of the longer-term discouraged/displaced workers – those discouraged for more than a year.) To give perspective the Shadow Stats unemployment number in 2000 was under 11%. The employment population ratio was 59.7% vs. 59.6%. That’s the percentage of the population who are working. In 2000 the employment population ratio was almost 65%. The labour force participation rate also rose 62.4% vs. 62.3%.
Again in 2000 the LFPR was over 67%. Today fewer people work as a percentage of the labour force. Average weeks unemployed fell to 24.1 weeks from 24.5 weeks while median weeks unemployed rose to 10.7 weeks from 9.8 weeks. Total unemployed 27 weeks or longer fell by 130,000. In some respects, all the numbers were confusing. They show neither declining or rising momentum as the labour picture. The result is policy makers such as the FOMC are divided. Do we cut in December or leave things as they are? It’s the most divided Fed we’ve seen in a while. The September job numbers showed a gain of 119,000, but revisions for July and August saw them revised downward by 33,000. As a result, the three-month total was 187,000 jobs, averaging 62,300/month.
According to the nonfarm payrolls, 684,000 new jobs were created in the first nine months of 2025, an average of 76,000/month. That’s down considerably from 2024 when 2,012,000 jobs were created or 167,600/month. The unemployment rate went up, but that was because of the 474,000 increase in the civilian labour force. More may have been working, but as a percentage of civilian labour force, the unemployment rate rises.
None of these numbers include all the layoffs announced recently, and they admit it has been difficult assessing the market due the high number of immigrants being deported, many of whom were fulfilling both full-time and part-time jobs. If we don’t get the October jobs report, we’ll have to wait until December 5 when the November jobs report is due.
Source: www.tradingeconomics.com, www.bls.gov
Markets & Trends
| % Gains (Losses) Trends | ||||||||
| Close Dec 31/24 | Close Nov 21/25 | Week | YTD | Daily (Short Term) | Weekly (Intermediate) | Monthly (Long Term) | ||
| S&P 500 | 5,881.63 | 6,602.99 | (2.0)% | 12.3% | down | up | up | |
| Dow Jones Industrials | 42,544.22 | 46,245.41 | (1.9)% | 8.7% | down (weak) | up | up | |
| Dow Jones Transport | 15,894.75 | 16,013.90 | (0.4)% | 0.8% | up (weak) | neutral | up | |
| NASDAQ | 19,310.79 | 22,273.08 | (2.7)% | 15.3% | down | up | up | |
| S&P/TSX Composite | 24,796.40 | 30,160.65 | (0.6)% | 22.0% | down (weak) | up | up | |
| S&P/TSX Venture (CDNX) | 597.87 | 854.76 | (2.9)% | 43.0% | down | up | up | |
| S&P 600 (small) | 1,408.17 | 1,407.83 | (1.1)% | (0.2)% | down | up | up | |
| ACWX MSCI World x US | 51.43 | 64.71 | (2.8)% | 25.8% | down | up (weak) | up | |
| Bitcoin | 93,467.13 | 84,548.5 | (10.9)% | (9.5)% | down | down | up | |
| Gold Mining Stock Indices | ||||||||
| Gold Bugs Index (HUI) | 275.58 | 594.03 | (3.4)% | 115.6% | down (weak) | up | up | |
| TSX Gold Index (TGD) | 336.87 | 717.93 | (3.3)% | 113.1% | down (weak) | up | up | |
| % | ||||||||
| U.S. 10-Year Treasury Bond yield | 4.58% | 4.07% | (1.9)% | (11.1)% | ||||
| Cdn. 10-Year Bond CGB yield | 3.25% | 3.20% | (0.9)% | (1.5)% | ||||
| Recession Watch Spreads | ||||||||
| U.S. 2-year 10-year Treasury spread | 0.33% | 0.55% | 1.9% | 66.7% | ||||
| Cdn 2-year 10-year CGB spread | 0.30% | 0.76% | 2.7% | 153.3% | ||||
| Currencies | ||||||||
| US$ Index | 108.44 | 100.14 | 0.9% | (7.7)% | up | neutral | down | |
| Canadian $ | 69.49 | 0.7096 | (0.5)% | 2.1% | down | down | neutral | |
| Euro | 103.54 | 115.20 | (0.9)% | 11.3% | down | up (weak) | up | |
| Swiss Franc | 110.16 | 123.84 | (1.7)% | 12.4% | down | up (weak) | up | |
| British Pound | 125.11 | 130.08 | (1.3)% | 4.0% | down | down | up | |
| Japanese Yen | 63.57 | 63.94 | (1.2)% | 0.6% | down | down | down | |
| Precious Metals | ||||||||
| Gold | 2,641.00 | 4,062.88 | (0.5)% | 53.8% | neutral | up | up | |
| Silver | 29.24 | 49.92 | (1.4)% | 70.7% | neutral | up | up | |
| Platinum | 910.50 | 1,509.70 | (2.3)% | 65.8% | down | up | up | |
| Base Metals | ||||||||
| Palladium | 909.80 | 1,379.00 | (1.9)% | 51.6% | down | up | up (weak) | |
| Copper | 4.03 | 4.99 | (1.0)% | 23.8% | neutral | up | up | |
| Energy | ||||||||
| WTI Oil | 71.72 | 57.95 | (3.4)% | (19.2)% | down | down | down | |
| Nat Gas | 3.63 | 4.57 | 1.3% | 25.9% | up | up | up | |
Source: www.stockcharts.com
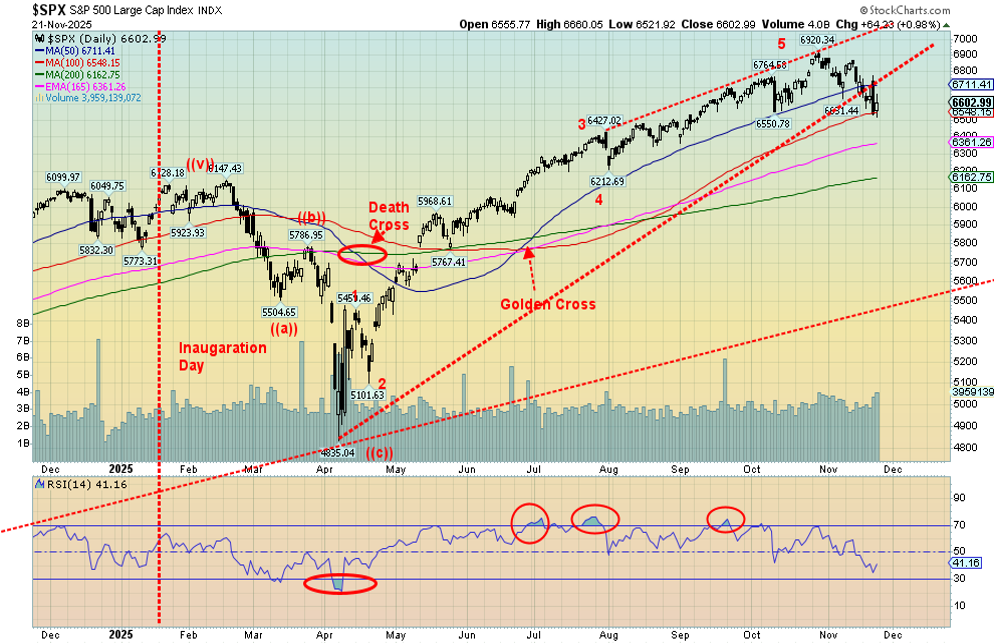
Source: www.stockcharts.com
Have we topped? That’s the question on everyone’s mind. We note how overvalued this market is. Strongly overvalued is the Buffett Indicator, the price/earnings ratio, the price/sales ratio, and an indicator we haven’t noted previously – the mean reversion indicator. Just overvalued is the interest rate model and fairly valued is the earnings model (courtesy of www.currentvaluation.com). If there is a silver lining, it’s that we can’t help but notice the CNN Fear/Greed indicator is currently at extreme fear. That could be positive and signal a rebound.
This past week the stock markets were battered, with the Nvidia earnings that exceeded expectations sparking a rally, followed by a sharp reversal (sell the news?) and an outside day reversal. The next day, on thoughts of a Fed rate cut in December, the market rebounded sharply. Volatility? It seems so. On the week, the S&P 500 fell about 2.0%, the Dow Jones Industrials (DJI) fell 1.9%, the Dow Jones Transportations (DJT) fell 0.4%, while the NASDAQ was down 2.7%.
The S&P 500 Equal Weight Index dropped 0.9%, the NY FANG Index fell 3.3%, the S&P 400 (Mid) was off 0.7%, and the S&P 600 (Small) was down 1.1%. Bitcoin took it on the chin once again, falling 10.9%, and is now down 9.5% in 2025 and down 33% from its all-time high. Bitcoin is in a bear market. Its last two bear markets saw Bitcoin fall 84% in 2017–2018 and 77% 2021–2022. Is another wipe-out on its way?
In Canada, the TSX Composite was off 0.6% but the TSX Venture Exchange (CDNX) fell 2.9%. In the EU, the London FTSE fell 1.6%, the EuroNext was down 2.7%, the Paris CAC 40 was down 2.3%, and the German DAX dropped 3.3%. In Asia, China’s Shanghai Index dropped 3.9%, the Tokyo Nikkei Dow (TKN) fell 3.5%, and Hong Kong’s Hang Seng (HSI) dropped 5.1%. A down week everywhere.
We suspect we have made our top. We briefly fell under the October low for the S&P 500 but we did not close under it. A close under it would suggest that we have made a top. From there, we need a close under 6,200 to confirm a top. Under 5,500 we are officially in a bear market. We broke uptrend line support. Only new highs above 6,920 can keep this market alive. But our suspicion is that the genie is out of the bottle and the next move is to the downside, unless we get those new highs.
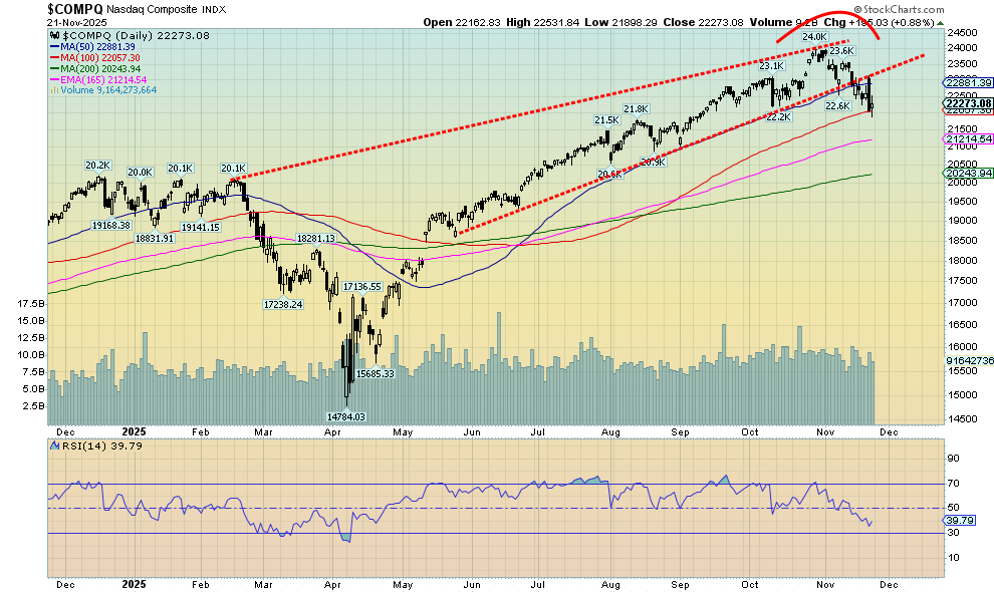
Source: www.stockcharts.com
We haven’t posted a chart of the NASDAQ lately. But, given the gyrations of the MAG7, we thought it worthwhile to show it. The NASDAQ fell 2.7% this past week. The NY FANG Index (MAG7 + 3) fell 3.3%. But some of the falls of the MAG7+ caught our attention. Amazon was down 5.8%, Netflix was off 6.2%, Google made new all-time highs and then closed down 7.6% (ouch), and Microsoft was down 7.4%. Nvidia’s earnings came out and everyone loved them. Nvidia rose, then fell, closing down 5.9% on the week.
CrowdStrike lost 8.7% and ServiceNow dropped 4.4%. Were there any winners? Well, Apple only lost about 0.3%. A decline that stood out is Trump Media (DJT). While not a FANG stock, Trump Media once again fell to all-time lows, down 6.6% on the week. Trump Media is down 81% from a high in October 2024 and down 94% from its all-time high. It seems to be falling faster than Trump’s approval ratings.
The NASDAQ, we suspect, has topped. We have broken an uptrend line; we are under the 50-day MA and currently finding some support at the 100-day MA. We took out that low in October, but we haven’t closed firmly under it yet. Once we do, then a fall to 21,000 is next. The 200-day MA is at 20,200. Only new all-time highs firmly over 24,000 can suggest we have bottomed.
Performance since Inauguration Day January 20, 2025
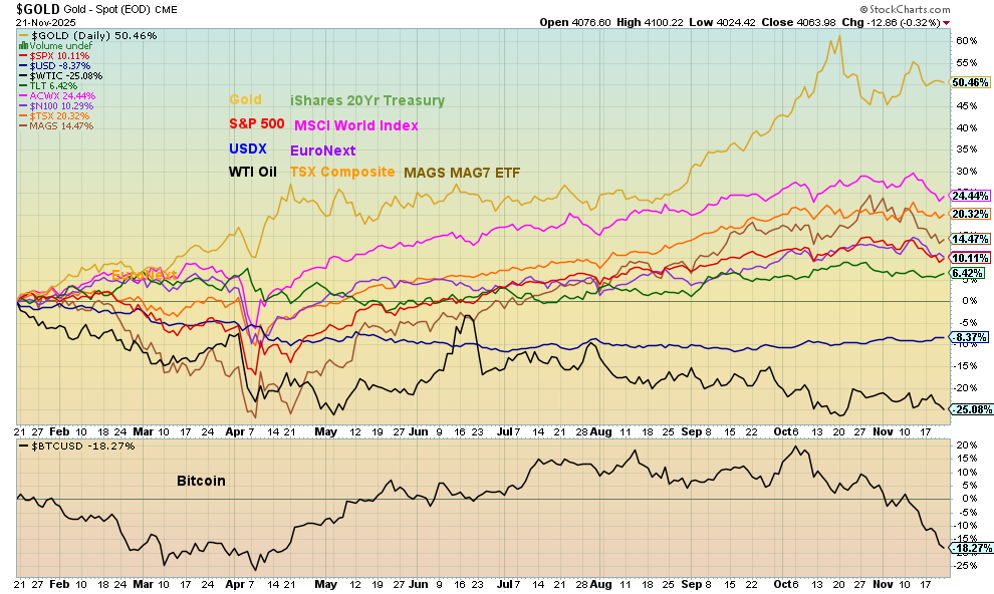
Source: www.stockcharts.com
We haven’t shown the performance of various markets since January 20 for awhile. It’s no surprise that gold remains well in the lead, up 50.5%. WTI oil remains at the bottom, down 25.1%, but Bitcoin is gaining, now down 18.3%. The US$ Index is down 8.4%. In second place is the substitute ETF for the MSCI World Index (ex USA), up 24.4% so far since January 20. We note that StockCharts is no longer providing the MSCI World Index (ex USA) but noted to use instead the ETF.
Source: www.stockcharts.com
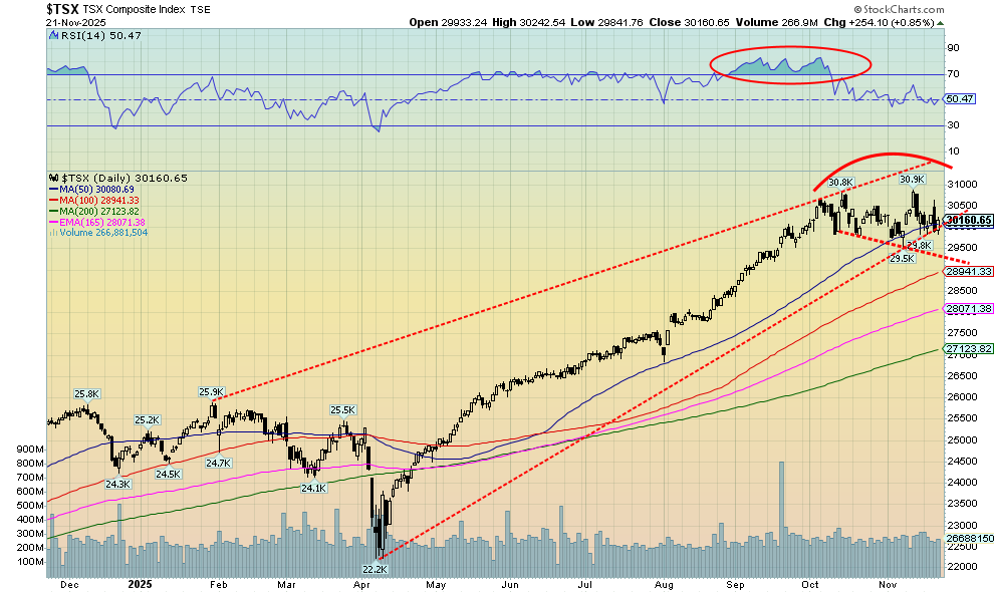
The TSX was not immune to the weak markets in the U.S. this past week. The TSX Composite fell 0.6% while the TSX Venture Exchange (CDNX) dropped 2.9% but remained up 43% on the year. Nine of the 14 sub-indices were down on the week, led by the Materials sector with Golds (TGD) down 3.3%, Metals off 3.3%, and Materials down 3.5%. Of the winners, two hit new all-time highs. Consumer Discretionary (TCD) was up 1.1%, Consumer Staples (TCS) rose 3.0%. Energy (TEN) made 52-week highs, up 0.5%.
Has the TSX Composite made a double top at 30,808 and 30,863? A breakdown under 29,500 might signal a further decline to 28,000. Currently, we are hugging the 50-day MA. We can see support near the 28,000 target, then down to 27,000. Interim support might come in near 29,000. Firm new highs over 31,000 could dispel talks of a sell-off. But the pattern looks negative, so a decline is more probable.
U.S. 10-year Treasury Note, Canada 10-year Bond CGB
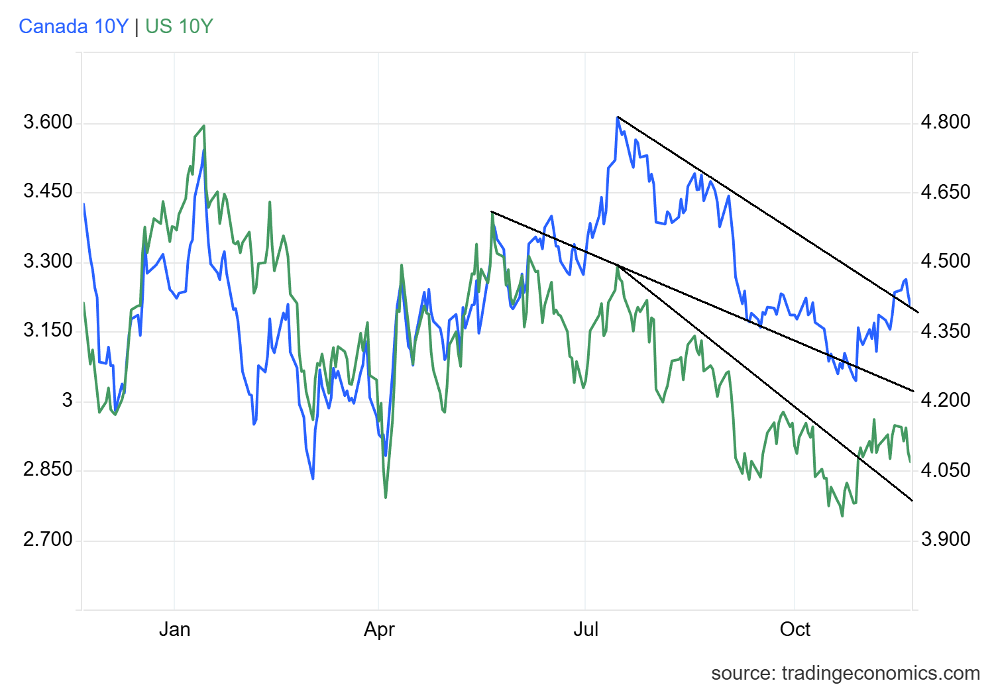
Source: www.tradingeconomics.com, www.home.treasury.gov, www.bankofcanada.ca
Talk of a rate pause sees bond yields rise. Talk of a Fed cut sees bond yields fall. Bond yields fell this past with the U.S. 10-year Treasury note falling 8 bp to 4.07%. Canada followed as the 10-year Government of Canada bond (CGB) fell 3 bp to 3.20%. For the closely followed 2–10 spread, the U.S. 2–10 rose a basis point to 55 bp and Canada’s rose 2 bp to 76bp. Both of these 2–10 spreads are predicting a recession down the road.
Nothing much has changed with bond yields. The U.S. 10-year appears to have broken a downtrend line over 4.06% but needs to get over 4.25% to really suggest we are headed higher. The Canada 10-year also broke out over 3.15% but needs to regain over 3.30% to suggest we are headed higher. The better than expected jobs numbers in the U.S. helped prevent bond yields from falling further this past week.
Source: www.stockcharts.com
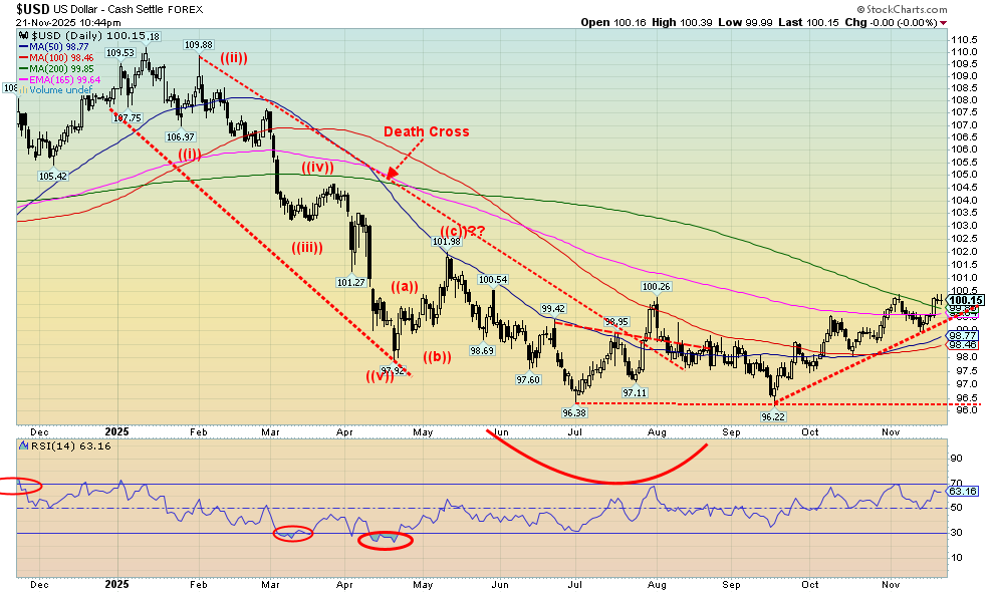
Could the US$ Index be on its way to its next target, up around 102? This week the US$ Index rose 0.9% and closed over the 200-day MA and over 100. The 200-day MA could also prove to be resistance, despite the close over this past week. Naturally other currencies fell. The euro lost 0.9%, the Swiss franc was down 1.7%, the pound sterling was off 1.3%, and the Japanese yen continued its recent woes, falling 1.2%.
The Cdn$ didn’t respond either and fell 0.5%. The currencies’ daily/short-term trends are now down while the US$ Index has turned up. The intermediate trends are weakening but only the Japanese yen is in a firm downtrend. A rising US$ Index could be a problem for gold as gold prices and the US$ Index tend to move opposite to each other. However, we have seen periods where both gold and the US$ Index are rising in tandem.
Source: www.stockcharts.com
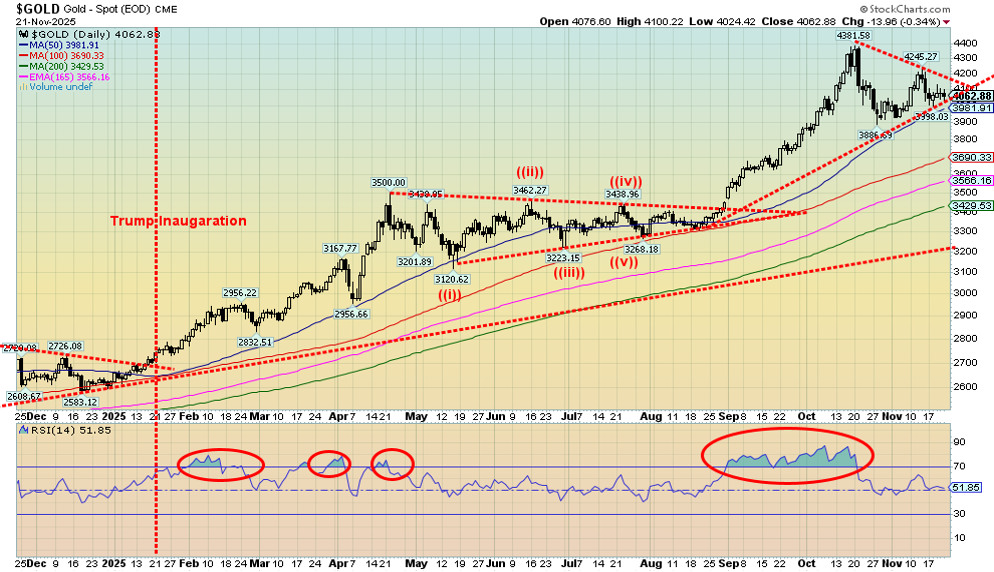
So, we have talk of a peace deal between Russia/Ukraine, along with talk on whether the Fed will stand pat in December or lower rates. Talk of the Fed staying pat helped push gold prices down, while talk of an interest rate cut helped gold prices to rise. Also, there was the somewhat friendly jobs report that favoured the bearish camp. Prices rebounded on Friday, following suggestions from Fed officials that an interest rate cut might still be on. But, as a reminder, we have noted the Fed is divided for the first time in years.
On the week, gold fell 0.5% but remains up a healthy 53.8% on the year. Silver fell 1.4%, platinum was down 2.3%, and of the near precious metals, palladium was off 1.9% and copper fell 1.0%. The gold stocks naturally fell as well. The Gold Bugs Index (HUI) lost 3.4% while the TSX Gold Index (TGD) dropped 3.3%. A lousy week all around, but definitely not a disastrous week. Of concern is that gold fell from its high of $4,381, hitting a low of $3,886 before rebounding back up to $4,245. Given that it fell short of the previous high it’s a signal that we could now be on a C wave down.
A break back under $3,886 could, in theory, project down to $3,400. That would be about a 13% correction. A reminder that, during the 2009–2011 gold bull market, gold fell twice around 13%–15% and three other times as well where the decline approached 10%. A correction of that nature is not unusual. Since this rally started in 2022, we’ve already had one correction of 13% and two other corrections of under 10%. We still expect a potential low into December before another up leg gets underway. Could the Fed at its December 9–10 meeting be the catalyst? We remember well the Fed meeting of December 2015 that ignited a strong gold rally into 2016. Could lightning strike twice?
Source: www.stockcharts.com
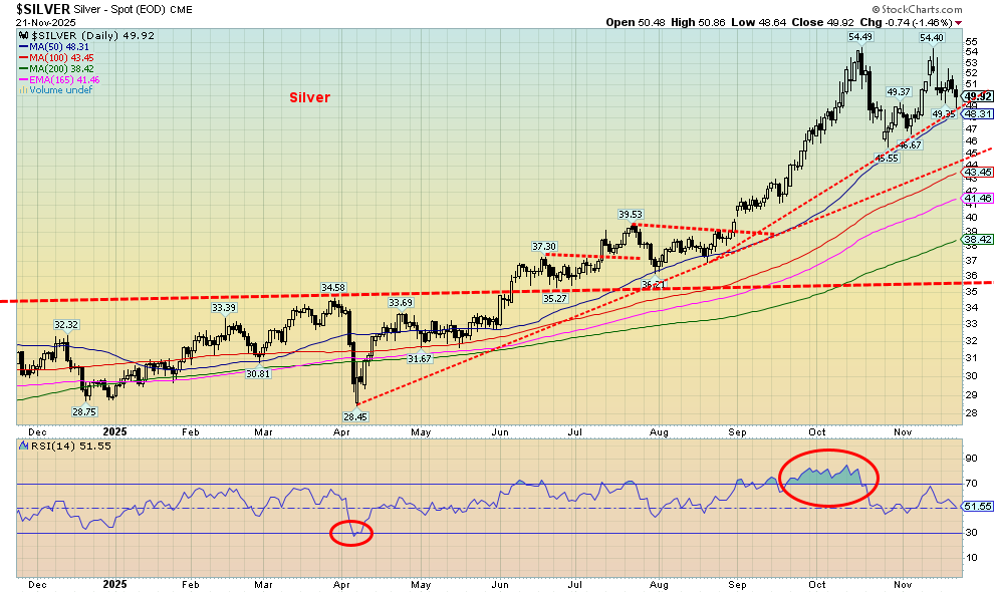
Silver, like gold, took it a bit under the chin this past week, given all the talk that the Fed won’t cut, then that the Fed will cut. Silver fell 1.4% but remains up 70.7% on the year. No matter how one looks at it, silver and the precious metals have had a good year. The gold/silver ratio is at 81.32, well off its high of 107.66 but still above a potential breakdown zone at 76 and especially under 75.
Silver’s high was $54.49, and the recent rebound took it only to $54.40 before turning down again. Is it a double top? We don’t know yet. The neckline is near $48.30 and under $48 silver looks a bit shaky. If it is a double top, the breakdown could project a drop, down to $39.50 near the 200-day MA. There is interim support at $45 and $41/$42. The chart looks a bit negative with that potential double top. New highs would end any discussion of a double top.
Source: www.stockcharts.com
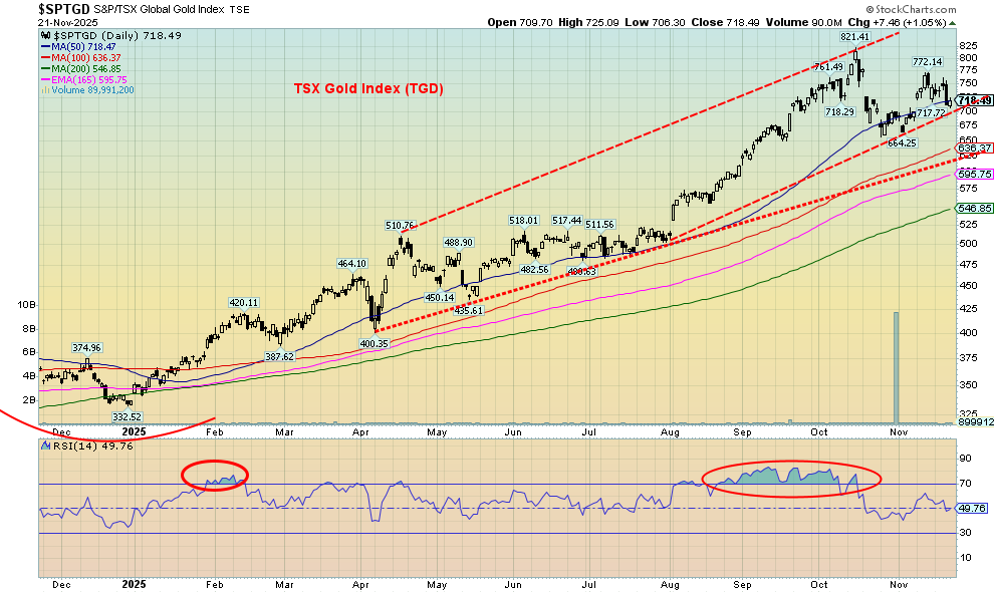
Given weakness in the broader stock market, it is probably no surprise that gold stocks have also been weak. Both gold and silver are also off their highs. In a down market, as in an up market, the gold stocks tend to lead. While gold was off 0.5% and silver down 1.4% this past week the gold stock indices fell more. The Gold Bugs Index (HUI) dropped 3.4% and the TSX Gold Index (TGD) fell 3.3%. Altogether, the HUI is down 14.3% and the TGD is down 12.5% from their respective all-time highs. That’s correction territory.
As the chart of the TGD shows, we continue to hold above the 50-day MA, but will that last if the stock market continues to fall? A breakdown under 700 could suggest a fall to better support around 635. The recent rebound was well short of the recent all-time high. That’s a negative sign as only new highs tells us the low is in. The RSI is neutral. We await a fall for the RSI under 30 to suggest that a bottom may be in progress. The junior developer gold stocks have also been under a bit of pressure of late. That’s no surprise as they tend to fall faster in a down market, just as they rise faster in an up market.
Source: www.stockcharts.com
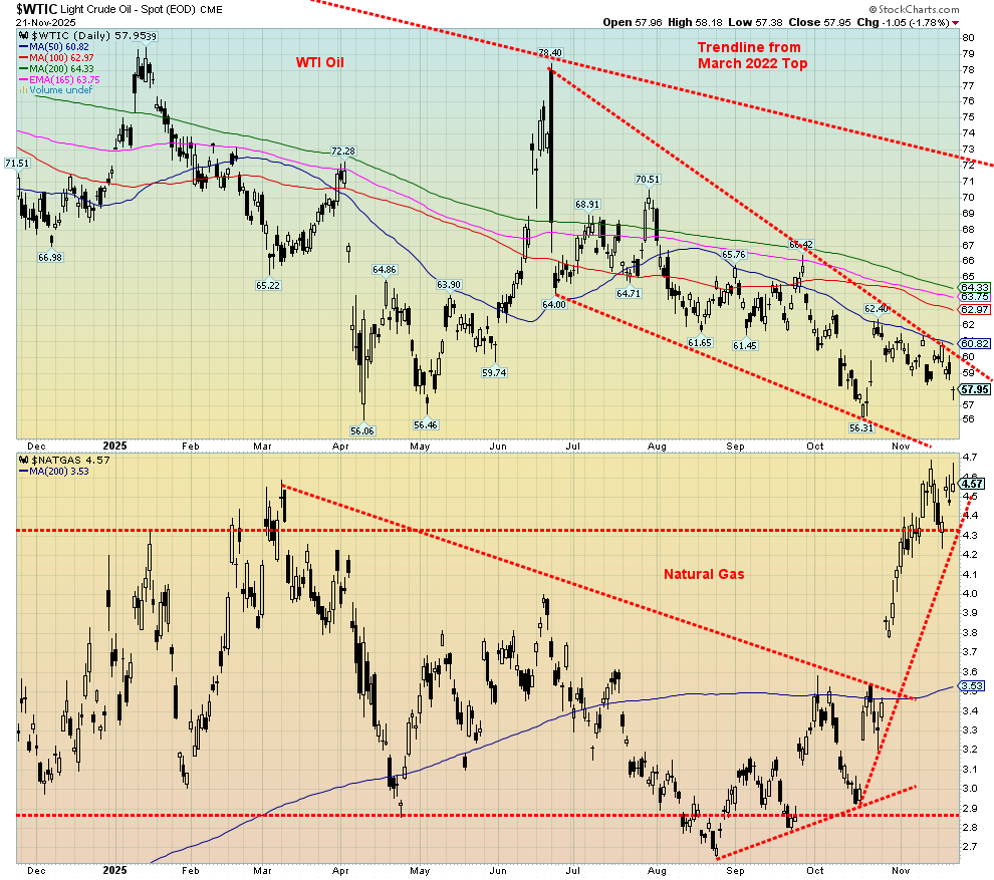
Oil – down again. This time it’s the thought that the Russia/Ukraine war might be settled, given the U.S.’s 28-point peace plan. But will the plan be accepted? Or accepted with amendments? All of these are unknown. But the markets took the easy out, given the potential for higher Russian oil supply to the market. Oil prices fell.
WTI oil fell 3.4% while Brent crude dropped 2.9%. It had little impact on natural gas (NG), as NG at the Henry Hub rose 1.3% but NG at the EU Dutch Hub fell 2.3%. Talk about colder weather and an uptick in exports helped push Henry Hub NG up. Ample supplies in storage and talk of the Russia/Ukraine peace deal had the EU Dutch Hub price falling.
Did energy stocks pay attention to the drop in oil prices? The ARCA Oil & Gas Index (XOI) fell 3.4%; however, Canada’s TSX Energy Index (TEN) not only made fresh 52-week highs but closed up about 0.5%. Given the ongoing accumulation in energy stocks, are they anticipating a rise down the road? It seems that way.
U.S. oil stocks and gasoline stocks are also very low and need to be replenished. That could put upward pressure on prices. WTI oil needs to regain over $60 to suggest a low is in. Over $64 it’s in, but a major breakout doesn’t occur until over $72/$73. NG continues to trade higher but has been consolidating. A break back under $4.30 might suggest a top is in. Under $4.20 it’s in.
Copyright David Chapman 2025
__
(Featured image by Sulpicio Helps via Unsplash)
DISCLAIMER: This article was written by a third party contributor and does not reflect the opinion of Born2Invest, its management, staff or its associates. Please review our disclaimer for more information.
This article may include forward-looking statements. These forward-looking statements generally are identified by the words “believe,” “project,” “estimate,” “become,” “plan,” “will,” and similar expressions. These forward-looking statements involve known and unknown risks as well as uncertainties, including those discussed in the following cautionary statements and elsewhere in this article and on this site. Although the Company may believe that its expectations are based on reasonable assumptions, the actual results that the Company may achieve may differ materially from any forward-looking statements, which reflect the opinions of the management of the Company only as of the date hereof. Additionally, please make sure to read these important disclosures.
David Chapman is not a registered advisory service and is not an exempt market dealer (EMD) nor a licensed financial advisor. He does not and cannot give individualised market advice. David Chapman has worked in the financial industry for over 40 years including large financial corporations, banks, and investment dealers. The information in this newsletter is intended only for informational and educational purposes. It should not be construed as an offer, a solicitation of an offer or sale of any security.
Every effort is made to provide accurate and complete information. However, we cannot guarantee that there will be no errors. We make no claims, promises or guarantees about the accuracy, completeness, or adequacy of the contents of this commentary and expressly disclaim liability for errors and omissions in the contents of this commentary. David Chapman will always use his best efforts to ensure the accuracy and timeliness of all information. The reader assumes all risk when trading in securities and David Chapman advises consulting a licensed professional financial advisor or portfolio manager such as Enriched Investing Incorporated before proceeding with any trade or idea presented in this newsletter.
David Chapman may own shares in companies mentioned in this newsletter. Before making an investment, prospective investors should review each security’s offering documents which summarize the objectives, fees, expenses and associated risks. David Chapman shares his ideas and opinions for informational and educational purposes only and expects the reader to perform due diligence before considering a position in any security. That includes consulting with your own licensed professional financial advisor such as Enriched Investing Incorporated. Performance is not guaranteed, values change frequently, and past performance may not be repeated.


Tether Seeks Big Four Audit to Boost USDT Transparency
Tether, issuer of USDT, plans a full audit by a Big Four firm to address transparency concerns over its $184...


H&M Advances Sustainability and Cuts Emissions by 2025
H&M Group reported that by 2025, 91% of materials were recycled or sustainably sourced, with recycled content reaching 32%. Emissions...


NHS Funds Breakthrough CAR-T Therapy Breyanzi for Lymphoma Treatment in Spain
Bristol Myers Squibb announced NHS funding for CAR-T therapy Breyanzi, enabling its use from April 1st in Spain for lymphoma...


Crypto Markets Volatile as Bitcoin Hovers, Solana Eyes AI Integration
Crypto markets remain volatile amid the Iran war, with Bitcoin near $70,000 and ETF inflows improving outlook. Ethereum faces declines...


Crowdfunding Evolves into Core Financial Infrastructure in Europe
European crowdfunding has matured under ECSPR, growing to 254 platforms by 2026 despite operational challenges. Key shifts include debates on...
 |
|
 |  |
 |
|
-
 Crypto4 days ago
The Iran War Tests Bitcoin and Crypto Market Resilience
-

 Crypto2 weeks ago
Oil Surge and Iran War Lift Bitcoin as Crypto Sentiment Improves
-
 Crypto1 day ago
Crypto Markets Volatile as Bitcoin Hovers, Solana Eyes AI Integration
-

 Cannabis1 week ago
Germany’s Medical Cannabis Market: Legal Reform, Falling Prices, and Rapid Expansion