Markets
Markets Wobble After Highs as Tariffs Rise and Commodities Soar
Trump announced 35% tariffs on Canada, exempting CUSMA goods, effective August 1. Markets hit new highs but closed lower amid tariff tensions and his feud with Fed Chair Powell. Precious metals surged, with several hitting 52-week or all-time highs. Sprott Inc. performed strongly. The commodities supercycle appears underway, with gold and miners likely to follow.

Canada added 83,100 jobs in June, far outstripping the expectation of zero (0) growth and an 8,800 gain in May. The unemployment rate fell to 6.9% from 7.0%, definitely below the expected 7.1%. Even the R8 unemployment rate (plus discouraged searchers, waiting group, portion of involuntary part-timers), the highest reported by Statistics Canada, fell to 8.6% from 9.1%. Of the job growth numbers, 13,500 were full-time vs. 57,700 in May, while part-time jumped sharply, up 69,500 vs. down 48,800 in May.
The part-time growth effectively offsets the May report. This is possibly due to shifting periods or a catch-up? The huge jump in part-time employment, however, is a cautionary sign. Irrespective of this, “it’s tariffs, what tariffs.” The biggest gains were in wholesale and retail trade, along with health care and social assistance. The provinces with the big gains were Alberta, Quebec, and Ontario while the Maritimes saw small losses.
Canada Jobs Report
Canada Employment Rate vs. Unemployment Rate 2020–2025
Gangbusters. That’s about all we can say about the June jobs report for Canada. But is it really?
Wage growth slowed to a year-over-year (y-o-y) gain of 3.2%, below the 3.5% the previous month, while the participation rate rose to 65.4% from 65.3%. The employment population ratio was 60.9% vs. 60.8%, reflecting more people working. All this points to is that the economy is not dead yet. The Canadian economy grew by 2.3% in Q1. That’s interesting as the U.S. economy grew by 2.0% in Q1 (annualized). Canada outpacing the U.S.? Despite all the issues of Trump’s attacks on Canada and the rest of the world? First quarter growth may have been a little skewed by manufacturers, business, and consumers wanting to get ahead of tariffs by buying early and stockpiling.
This is the last jobs report before the next meeting of the Bank of Canada (BofC) on July 30. We suspect that the BofC will hold interest rates firm because of this better than expected report. While layoffs in some companies are being reported, other companies are hiring. With layoffs as well, people are not counted as unemployed until their severance runs out. Both the number of people employed and unemployed rose last month: employed +7,400, unemployed +39,300.
This is the biggest gain in six months. All this was reported before the potentially negative effects of Trump’s 50% tariff on copper and 35% against Canada. Grant you, it’s the TACO man talking (“Trump Always Chickens Out”), so what is said today can change tomorrow. We are supposed to have a trade deal by July 21. We confess, we’ll be surprised if it happens. Nonetheless, there has been negative fallout from tariffs, in particular those impacting Ontario, the manufacturing heartland of Canada. Windsor, for example, has an unemployment rate of 11.2% vs. 6.9% for Canada.
Overall, a good report. But the huge jump in part-time is illusory as that gain can also be first to disappear.
Updates
S&P 500
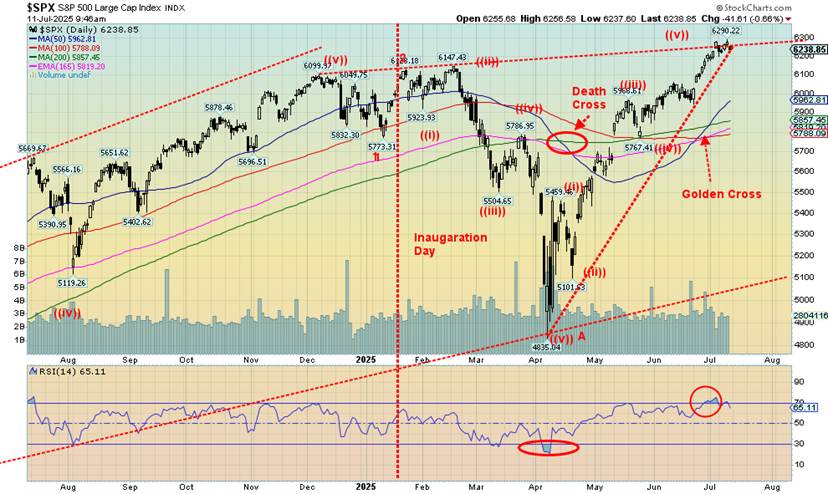
Has the U.S. stock market topped? Once again. the S&P 500 (SPX), along with the NASDAQ, has made all-time highs. But, once again, neither the Dow Jones Industrials (DJI) nor the Dow Jones Transportations (DJT) have made all-time highs. In Canada, the TSX Composite did make new highs. This only becomes a significant divergence if the market were to turn down and give us a sell signal or confirm a top. Interestingly, also making a new all-time high was Bitcoin. A breakout? Or a hook? The crypto market is bubbly with calls for $150,000, $200,000 Bitcoin. But what is Bitcoin used for? Well, not much.
It is not difficult to see that the SPX briefly went above the trendline connecting the earlier tops. However, follow-through has not been seen. Will we see it? Even further highs remain possible. On the other hand, the NASDAQ has cracked its upper trend line. Interestingly enough, while that trendline connecting the tops for the SPX was a rising trendline, the same trendline for the NASDAQ connected declining tops. Another divergence? We have golden crosses for both the SPX and NASDAQ, another buy signal. But not yet for the DJI, although it is getting close. DJT? Not a chance.
The rise for the markets since the “Liberation Day” low in April has been almost straight up. A V recovery. We are now overbought by a number of measurements but so far, the market has not cracked. Volume has tailed off. The VIX volatility indicator is at 16 which we consider mildly complacent. The CNN Fear & Greed Index is registering Extreme Greed. Nvidia has been the hero, the first $4 trillion company, making Nivida the fifth largest country in the world, behind Japan but ahead of the U.K. (market cap vs. GDP).
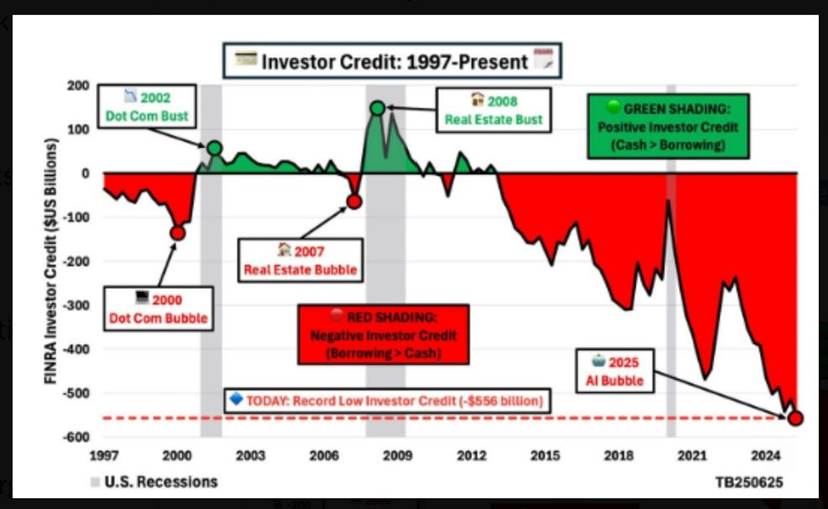
Things have been generally rosy for the stock market. Lots of money around, it seems. The economy has been “Goldilocks” despite the tariff wars, but that could change now that President Trump is once again slapping tariffs on a host of countries. So far, the response has been somewhat muted but that could change. There remain funds on the sidelines that could be employed into the market. Interestingly, there is evidence that the public is piling into the stock market. The chart below shows the huge uptick in margin buying by the public. It far outpaces what was seen during the dot.com and real estate bubbles. It’s AI mania. The public always gets in at the top and sells at the bottom.
Given the tariff wars, there is a risk is that foreigners decide to take their money out of the U.S. (bonds and stocks) in response to Trump’s tariffs. Foreigners are piled into U.S. bonds and equities. Foreign holders of U.S. treasuries make up 33% of the public treasury market, while they also make up 27% of the corporate bond market. As well, they make up some 18–20% of the U.S. equity market. It wouldn’t take much of a withdrawal to suddenly spark a concern (panic?) to get out of U.S. securities. The falling U.S. dollar is not helping.
The economy is a Goldilocks economy with lower inflation, even as it is still above the Fed’s 2% target, a labour market that continues to show life, earnings that remain off their highs but still elevated, and economic growth that is still positive on an annualized basis. On a quarterly basis, Q1 was negative 0.5%. The PE for the SPX is near 30 which is high. The Schiller PE ratio is even higher at 38. Previously, the market has topped out with PEs that high. Add in tariff uncertainty and we could be setting up conditions for a top.
The market looks at earnings, not the latest tariff war between the U.S. and Myanmar. So far, the announcement of a new round of tariffs hasn’t moved the market until they announced steep tariffs on Canada. The TACO man could once again change his mind. He wants tariffs, but he also doesn’t want the market to fall. The uncertainty of what Trump may or may not do has most companies sitting on their hands.
As of now, we wouldn’t consider that the SPX has topped until we drop under 5,900. Under 5,750 it has topped for sure. Warning bells are ringing everywhere. This is not the time to be buying.
Lest we forget there is still the question of huge $37 trillion debt, the $3 trillion annual deficit and the ongoing fight between Trump and Fed Chair Jerome Powell. We don’t know how this will end as the only thing certain is Powell’s term is up in 2026. Powell mostly ignores what Trump says but the threats against the Fed Chair are rising. Anything that overthrows Powell will not be well received by markets as we suspect bond yields will rise, gold will rise but stocks will fall and the US$ Index will fall. A dangerous game they are playing.
Not helping the debt and deficits this past week was the fact that bond yields as represented by the U.S. 10-year treasury note jumped to 4.42% up 1.6%. The Canadian 10-year Government of Canada bond (CGB) was also up gaining 4.4% to 4.50%. Rising bond yields are not good when one has $37 trillion in debt. Hence another highlight for the president/Fed Chair fight.
Chart of the Week
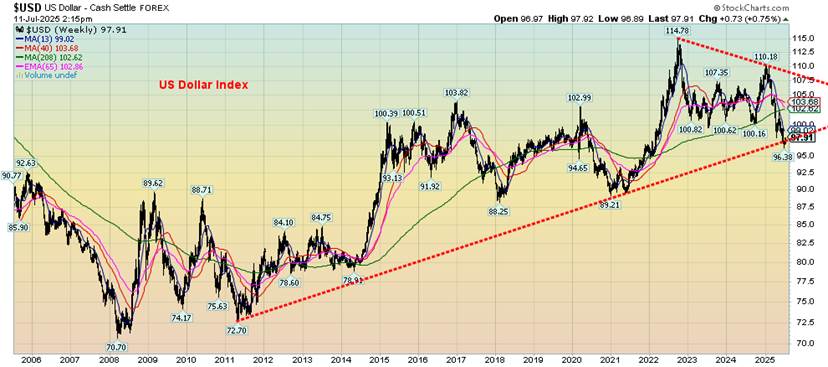
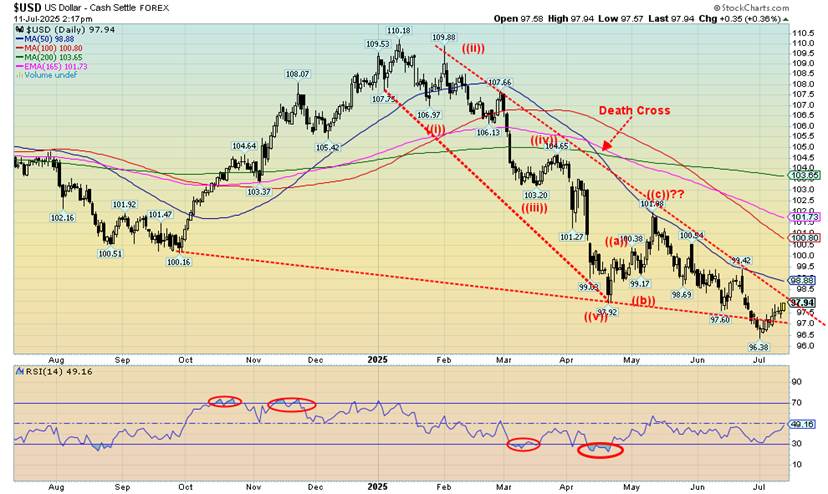
Is the US$ Index poised to break down or poised to rebound? This longer-term chart of the US$ Index of the past 20 years shows that the US$ Index is either breaking down under that trendline or it’s poised to stage a big rebound. A move now back over 98 and especially over 99 could signal that a low is in. Over 100 we could rise further to 101. If the US$ Index rebounds, it could have a negative impact on gold. Only a further drop under the recent low of 96.38 could suggest we are continuing our downward trend.
The next chart shows the US$ Index broke below a trendline, then reversed back up. No, it is not as yet giving us a buy signal, but it is beginning to look like a false breakdown. A rising US$ Index could be negative for gold. As one can note from the daily chart of the US$ Index on the next page, we are approaching a breakout of that downtrend line. One positive we have noted of late is that there have been days when gold rose despite the US$ Index also rising. Helping gold is its safe haven status and ongoing demand from central banks.
Also, gold is a hedge against the volatility being seen in markets. Gold is also responding positively to the hiking of the debt limit and growing systemic risk in the banking sector, particularly if loan losses continue to rise and the risk of a sovereign debt crisis also rises. We note that, during COVID and the start of the Russia/Ukraine war, gold and the US$ Index both rose together.
Gold
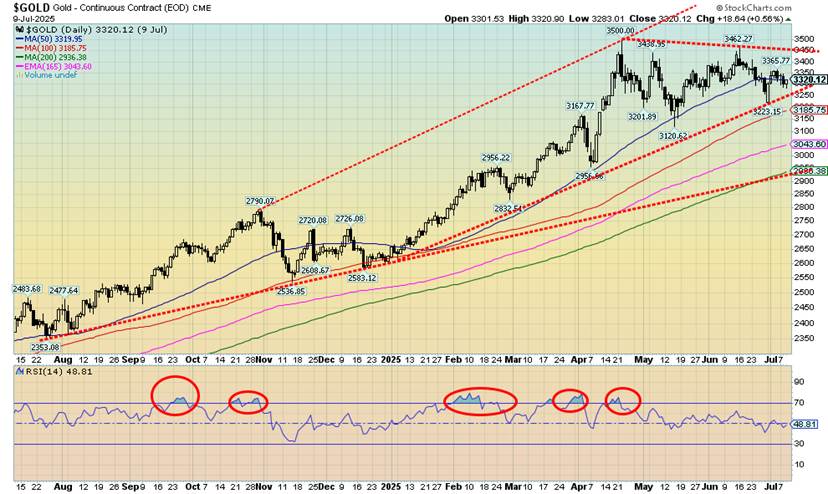
Gold continues to tantalize us as to whether it will break higher or continue in its current corrective period. The pattern is appearing as symmetrical triangle with the potential for a five-point reversal pattern that should propel us higher. Symmetrical triangles can be both continuation patterns and topping patterns. Which one is this? We lean towards a continuation pattern but are wary of a topping pattern.
The pattern can be ambiguous and, if we were to break down under $3,250 and especially under $3,200, we could see a larger drop towards $3,000, even $2,900. New highs will help as well as new highs for silver. On Friday, July 11, 2025 silver did jump to new 52-week highs over $38. Is silver leading? The key now going forward is that gold also jumps over $3,500 and the gold stocks indices (HUI, TGD) also make new highs.
We are in a weak period for gold (and the precious metals), but hold to the potential for a July low. However, sometimes these periods also last into August, even early September, before we see the rally into October/November. All this has put us on short-term cautious alert, but we remain long-term bullish. Note that in 2024 we also had a consolidation period that lasted into August, then we rallied into October/November before another decline into December. Silver making new highs is encouraging. Now it needs to hold it.
RSIs for both gold and silver and silver are fairly neutral here, adding to the uncertainty. The gold stocks also appear to be forming a symmetrical triangle. The TSX Gold Index (TGD) needs to break out over 520 to confirm higher. A breakdown under 480 and especially 470 spells trouble with potential downside targets to 400. The TGD is showing what may be an ascending triangle which is bullish. But we need to break to new highs to confirm that. Incidently the TSX Metals & Mining Index (TGM) made all time highs this past week. An omen for gold?
Gold was our number one pick for 2025 and, so far, it has not disappointed. Percentage-wise, gold is up in 2025, along with silver. The indices are also performing very well with the HUI up percentage-wise and the TGD also up. As well, we are seeing buying in the junior miners that primarily trade on the TSX Venture Exchange (CDNX).
Other metals have been moving up as copper, platinum, palladium all made new highs this past week while copper made all-time highs. The CDNX has also been making new 52-week highs. The best part about the gold market is that, despite the new highs and the strong performance to date, we are seeing few signs of frothiness that could signal a potential top. Gold, along with silver and the precious metals, remains under-owned and under-appreciated, particularly in North America. As a friend who watches U.S. channels such as CNBC and Fox notes, they rarely ever mention gold. AI rules.
Markets & Trends
| % Gains (Losses) Trends | ||||||||
| Close Dec 31/24 | Close Jul 11/25 | Week | YTD | Daily (Short Term) | Weekly (Intermediate) | Monthly (Long Term) | ||
| ne | ||||||||
| S&P 500 | 5,881.63 | 6,259.75 (new highs) * | (0.3)% | 6.4% | up | up | up | |
| Dow Jones Industrials | 42,544.22 | 44,371.51 | (1.0)% | 4.3% | up | up | up | |
| Dow Jones Transport | 16,030.66 | 16,208.86 | 1.0% | 2.0% | up | neutral | up | |
| NASDAQ | 19,310.79 | 20,585.53 (new highs) * | (0.1)% | 6.6% | up | up | up | |
| S&P/TSX Composite | 24,796.40 | 27,023.25 (new highs) * | (0.1)% | 9.3% | up | up | up | |
| S&P/TSX Venture (CDNX) | 597.87 | 784.42 (new highs) | 3.9% | 31.2% | up | up | up | |
| S&P 600 (small) | 1,408.17 | 1,376.56 | (0.3)% | (2.2)% | up | neutral | up | |
| MSCI World | 2,304.50 | 2,705.41 (new highs) * | 0.2% | 17.4% | up | up | up | |
| Bitcoin | 93,467.13 | 118,053.56 (new highs) * | 9.6% | 26.3% | up | up | up | |
| Gold Mining Stock Indices | ||||||||
| Gold Bugs Index (HUI) | 275.58 | 430.35 | 0.8% | 56.2% | up | up | up | |
| TSX Gold Index (TGD) | 336.87 | 503.70 | 0.1% | 49.5% | up | up | up | |
| % | ||||||||
| U.S. 10-Year Treasury Bond yield | 4.58% | 4.42% | 1.6% | (3.5)% | ||||
| Cdn. 10-Year Bond CGB yield | 3.25% | 3.50% | 4.2% | 7.7% | ||||
| Recession Watch Spreads | ||||||||
| U.S. 2-year 10-year Treasury spread | 0.33% | 0.52% | 13.0% | 57.6% | ||||
| Cdn 2-year 10-year CGB spread | 0.30% | 0.76% | 10.1% | 153.3% | ||||
| Currencies | ||||||||
| US$ Index | 108.44 | 97.88 | 0.9% | (9.8)% | down | down | down | |
| Canadian $ | 69.49 | 0.7309 | (0.9)% | 5.2% | up | up | neutral | |
| Euro | 103.54 | 116.87 | (0.6)% | 12.9% | up | up | up | |
| Swiss Franc | 110.16 | 125.47 | (0.2)% | 13.9% | up | up | up | |
| British Pound | 125.11 | 134.95 | (1.1)% | 7.9% | up | up | up | |
| Japanese Yen | 63.57 | 67.85 | (1.6)% | 6.7% | up | up | neutral | |
| Precious Metals | ||||||||
| Gold | 2,641.00 | 3,356.22 | 0.9% | 27.1% | up | up | up | |
| Silver | 29.24 | 38.47 (new highs) | 4.4% | 31.6% | up | up | up | |
| Platinum | 910.50 | 1,455.70 (new highs) | 5.9% | 55.9% | up | up | up | |
| Base Metals | ||||||||
| Palladium | 909.80 | 1,285.00 (new highs) | 11.7% | 41.2% | up | up | down | |
| Copper | 4.03 | 5.54 (new highs) * | 8.6% | 37.5% | up | up | up | |
| Energy | ||||||||
| WTI Oil | 71.72 | 68.78 | 2.9% | (4.1)% | up | neutral | down | |
| Nat Gas | 3.63 | 3.36 | (2.6)% | (7.4)% | down | neutral | neutral | |
__
(Featured image by Jakub Żerdzicki via Unsplash)
DISCLAIMER: This article was written by a third party contributor and does not reflect the opinion of Born2Invest, its management, staff or its associates. Please review our disclaimer for more information.
This article may include forward-looking statements. These forward-looking statements generally are identified by the words “believe,” “project,” “estimate,” “become,” “plan,” “will,” and similar expressions, including with regards to potential earnings in the Empire Flippers affiliate program. These forward-looking statements involve known and unknown risks as well as uncertainties, including those discussed in the following cautionary statements and elsewhere in this article and on this site. Although the Company may believe that its expectations are based on reasonable assumptions, the actual results that the Company may achieve may differ materially from any forward-looking statements, which reflect the opinions of the management of the Company only as of the date hereof. Additionally, please make sure to read these important disclosures.
Copyright David Chapman
David Chapman is not a registered advisory service and is not an exempt market dealer (EMD) nor a licensed financial advisor. He does not and cannot give individualised market advice. David Chapman has worked in the financial industry for over 40 years including large financial corporations, banks, and investment dealers. The information in this newsletter is intended only for informational and educational purposes. It should not be construed as an offer, a solicitation of an offer or sale of any security. Every effort is made to provide accurate and complete information.
However, we cannot guarantee that there will be no errors. We make no claims, promises or guarantees about the accuracy, completeness, or adequacy of the contents of this commentary and expressly disclaim liability for errors and omissions in the contents of this commentary. David Chapman will always use his best efforts to ensure the accuracy and timeliness of all information. The reader assumes all risk when trading in securities and David Chapman advises consulting a licensed professional financial advisor or portfolio manager such as Enriched Investing Incorporated before proceeding with any trade or idea presented in this newsletter.
David Chapman may own shares in companies mentioned in this newsletter. Before making an investment, prospective investors should review each security’s offering documents which summarize the objectives, fees, expenses and associated risks. David Chapman shares his ideas and opinions for informational and educational purposes only and expects the reader to perform due diligence before considering a position in any security. That includes consulting with your own licensed professional financial advisor such as Enriched Investing Incorporated. Performance is not guaranteed, values change frequently, and past performance may not be repeated.


The TopRanked.io Weekly Digest: What’s Hot in Affiliate Marketing [LiveChat Affiliates Review]
Quick Disclosure: We’re about to tell you how LiveChat Affiliates run a top-notch affiliate program. And we really mean it....


German SMEs Face Tighter Bank Lending, Turn to Alternatives
Access to bank loans for German SMEs is tightening despite strong financing needs. About 37.8 percent face restrictive lending, driven...


Bitcoin Stalls as Geopolitical Risks and Crypto Industry Tensions Persist
Bitcoin is moving sideways near $72,000 amid ongoing Iran tensions, while ETF inflows remain strong. Quantum security debates continue. Ethereum...


Geopolitical Tensions and Trade Disruptions Reshape Global Commodities Markets
Geopolitical tensions and disrupted trade routes, especially around the Strait of Hormuz, are reshaping global commodities markets. Agriculture faces supply...


Germany Sees 413 Cannabis Cultivation Clubs Two Years After Partial Legalization
Two years after partial cannabis legalization in Germany, 413 cultivation clubs have been established nationwide. Lower Saxony leads in clubs...
 |
|
 |  |
 |
|
-

 Biotech1 week ago
Gilead Sciences Advances Growth Strategy with Focus on HIV, Oncology, and Innovation
-

 Impact Investing4 days ago
Ortus Secures €97M Green Loan to Expand Solar Portfolio in Italy
-

 Impact Investing2 weeks ago
Italian Unlisted Banks Lag on ESG Sustainability
-
 Business2 days ago
The TopRanked.io Weekly Digest: What’s Hot in Affiliate Marketing [LiveChat Affiliates Review]