Featured
Amid massive global debt, gold as safe haven could save the market
While the outlook for 2019 doesn’t look particularly good, the first few days of January 2019 will act as a barometer for the year ahead.
“This is the end, beautiful friend. This is the end, my only friend, the end”—The Doors, The End, 1967
“We have two kinds of forecasters, those who don’t know and those who don’t know they don’t know.”—John Kenneth Galbraith, economist, public official, diplomat, 1908–2006
“I really have no ability to forecast gold prices. I have been in the business for 30 years, and it occupies my mind day and night.”—Peter Munk, former chairman and founder Barrick Gold, 1927–2018
This past year, 2018, has been a very volatile year. Previously, we outlined how in 2018 there have been five days where the Dow Jones Industrials (DJI) had fallen 600 points or more. We had to go back to 2011 to find one and back to 2008 to find at least four. 2018 has not been a pleasant year. Out of a list of 37 indices provided by The Economist every week, only six were up on the year. The worst performer has been China’s Shenzhen Composite while the best has been Brazil’s Bovespa Index. We have declared that global stock markets have entered a bear market. If there is one thing that appears certain at this time, it is that, going into 2019, both volatility and the bear will continue. Those conditions are ideal for gold and it should rise.
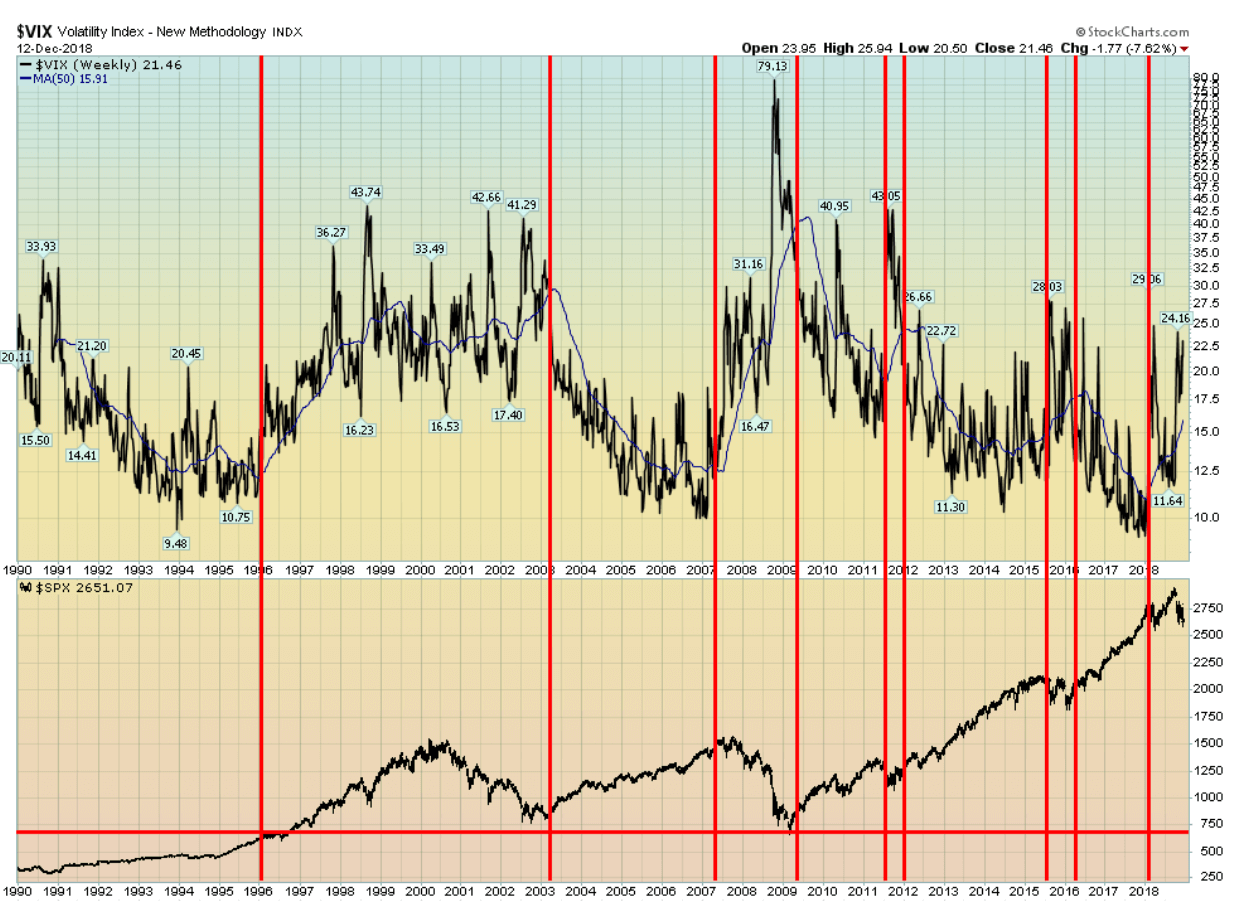
It is interesting looking at a longer dated chart of the VIX Volatility Index, going back to its beginnings in 1990. Since 1990, this is the fifth period of elevated volatility. The first period actually got underway in 1996 while the markets were still rising. Volatility didn’t abate until the markets started rising again in 2003. By the time the markets bottomed in October 2002, they had retraced themselves all the way back to March 1997.
Following a relative period of tranquility as the stock markets rose into a final top in October 2007, volatility had started to rise earlier in April 2007. Volatility started to calm by May 2009 after the market bottomed in March 2009. By the time the final bottom was seen in March 2009, the market had fallen back to levels last seen in August 1996. In other words, the market wiped out 13 years of gains (see long-term VIX and S&P 500 chart below).
Volatility picked up again in July 2011 but the 2011 EU/Greek crisis proved to be short-lived and, once again, volatility calmed by December 2011. The market went through a long period of low volatility as it relentlessly climbed in a huge bull market backed by ultra-low interest rates and quantitative easing (QE). Volatility picked up in July 2015 when QE was ending, but once again the crisis was short-lived and volatility began to fall by March 2016. The bottom was in February 2016.
The market took off again, reaching new heights, and volatility fell to record lows. But volatility has picked up once again in January 2018 when the market topped. It hasn’t eased since, despite a brief respite between May and October when the markets recovered and hit yet another all-time high. But volatility never fell anywhere near previous record low levels.
Despite the volatility and setbacks, the DJI and the S&P 500 have enjoyed stellar gains from 1990 onwards. The DJI has gained 790% or roughly 28% per year. The S&P 500 is up 650% or roughly 23% per year. Gold is up only 208%, gaining roughly 7% per year. The period 1990–2018 had two of the biggest and longest bull markets in history, first from 1990 to 2000 and then from 2009 to 2018. Both faced only shallow corrections. The 1990 to 2000 bull had two corrections, first in 1994 and again in 1998. Similarly, the 2009 to 2018 bull also faced only two corrections of significance in 2011 and again in 2015/2016. None of these corrections exceeded 20%.
© David Chapman
It’s what happened in between that should concern investors. The markets faced two 50% plus collapses. The markets hadn’t seen anything like that since the collapse in 1973/1974. Before that, one has to go back to the Great Depression and the collapses of 1929/1932 and 1937/1938.
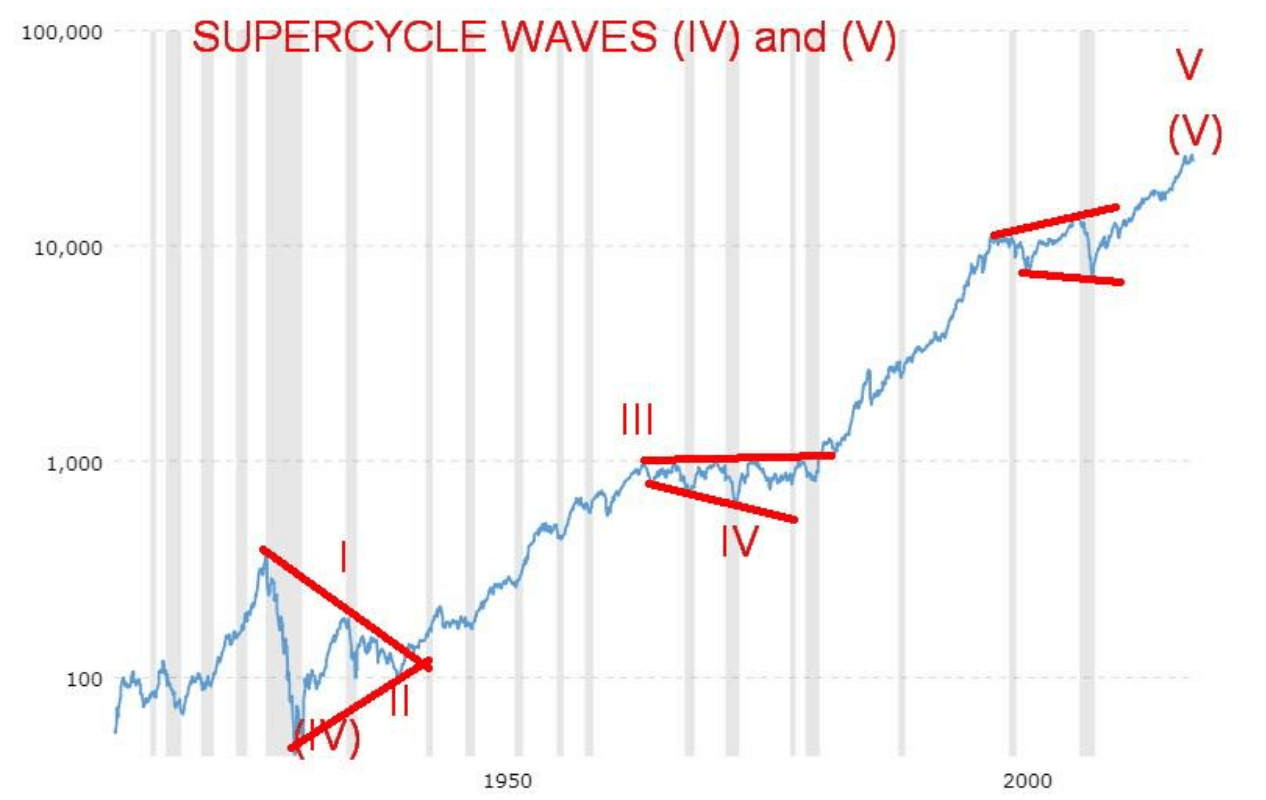
Elliott Wave International believes we have hit a historic zenith. They believe that we have completed five waves up from the 1932 Great Depression low. Waves one and two were first the wave up from 1932 that topped in 1937 followed by the 1938 collapse which was leg two of the Great Depression. Wave three got underway and took years to make its final top in 1966. Wave four was the inflationary recession throughout the 1970s with its nominal bottom in 1974. Wave five was the longest bull market in history that Elliott Wave believes made its final top in October 2018. Grant you, it is unconfirmed at this time. Only time will tell. But, if correct, then Elliott wave believes the DJI could collapse at least back to the levels seen at the bottom in March 2009 and possibly lower.
So far, all that has been going on in 2018 is another possible correction along the lines of 2011 and 2015/2016. The DJI and other stock indices did make new lows this past week, but they have not taken out the February 2018 lows. However, several have including the TSX Composite making new 52-week lows. At its worst, the correction so far was down only a bit over 12% as with the DJI and the TSX Composite. Pretty normal, really—we don’t consider it a more serious bear market until we are down at least 20%. What has not been normal is the volatility, given the number of 600 plus down days in 2018.
© David Chapman
There are a lot of reasons for the volatility and the fear that seems to ebb and flow in the market. At the heart of the looming crisis is debt. But the crisis is about more than just debt. It is about the clash of titans as China and the U.S. battle it out for global supremacy. It is about rising nationalism that threatens to take us back to the “Dirty Thirties,” a period where fascism reared its ugly head. There is also the potential for a looming constitutional crisis in the U.S. as the President comes under deepening scrutiny as a result of testimonies by former aides, many of whom have been indicted in the ongoing Mueller investigation. Finally, it is about the looming environmental crisis that nobody seems to agree upon. Any or all of these could give rise to one of the most devastating stock market collapses since the Great Depression.
It won’t be a collapse that happens overnight. More likely it will play itself out over a period of years. Any stock market collapse will probably look like the collapse of 1930–1932 or 1973–1974. Those bear markets were just relentlessly down. The collapses of 2000–2002 and 2007–2009 saw a period that left everyone guessing, only to end in a swift devastating capitulation.
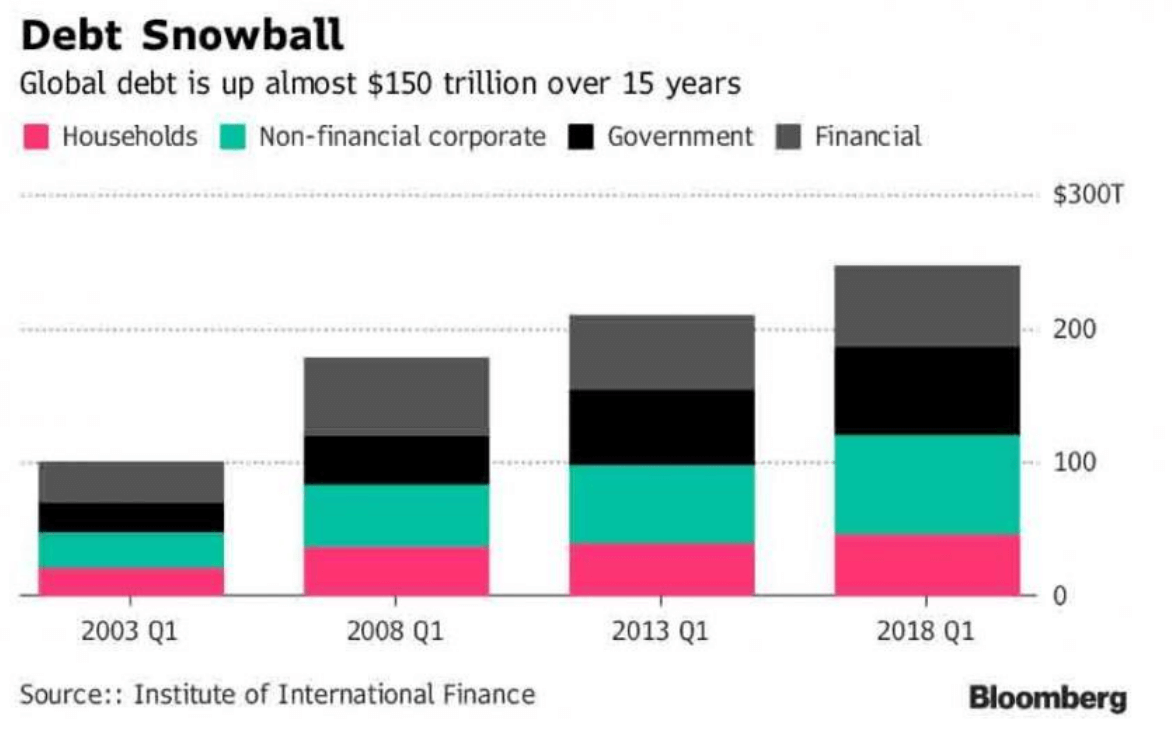
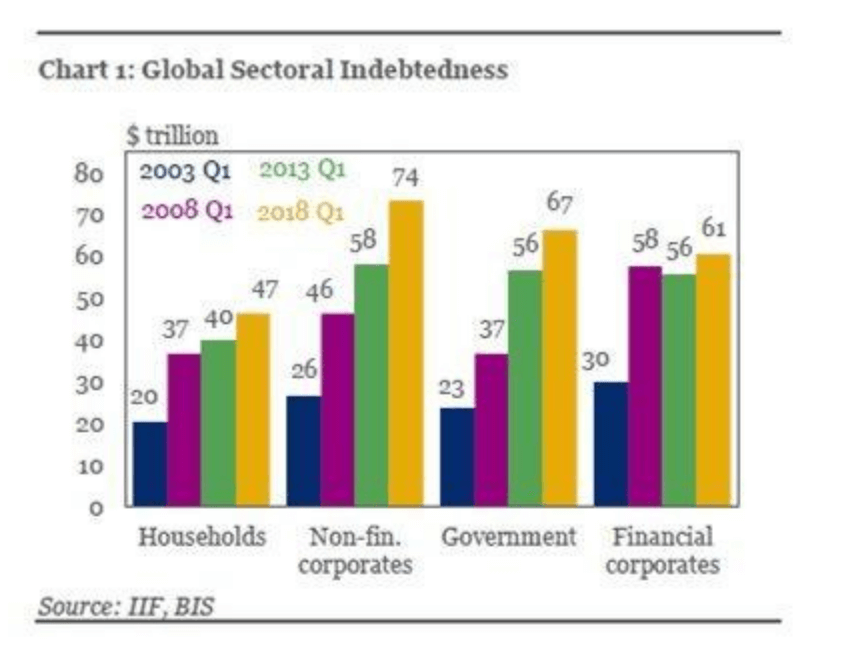
Global debt reached a level of $247 trillion in Q1. No doubt it is higher now. At the end of 2017, it had reached $237 trillion, so if the increase of $10 trillion/quarter holds it could be as high as $277 trillion by the end of 2018. Globally, the debt to GDP ratio was 318% in Q1 and again probably higher now. This is unsustainable.
© David Chapman
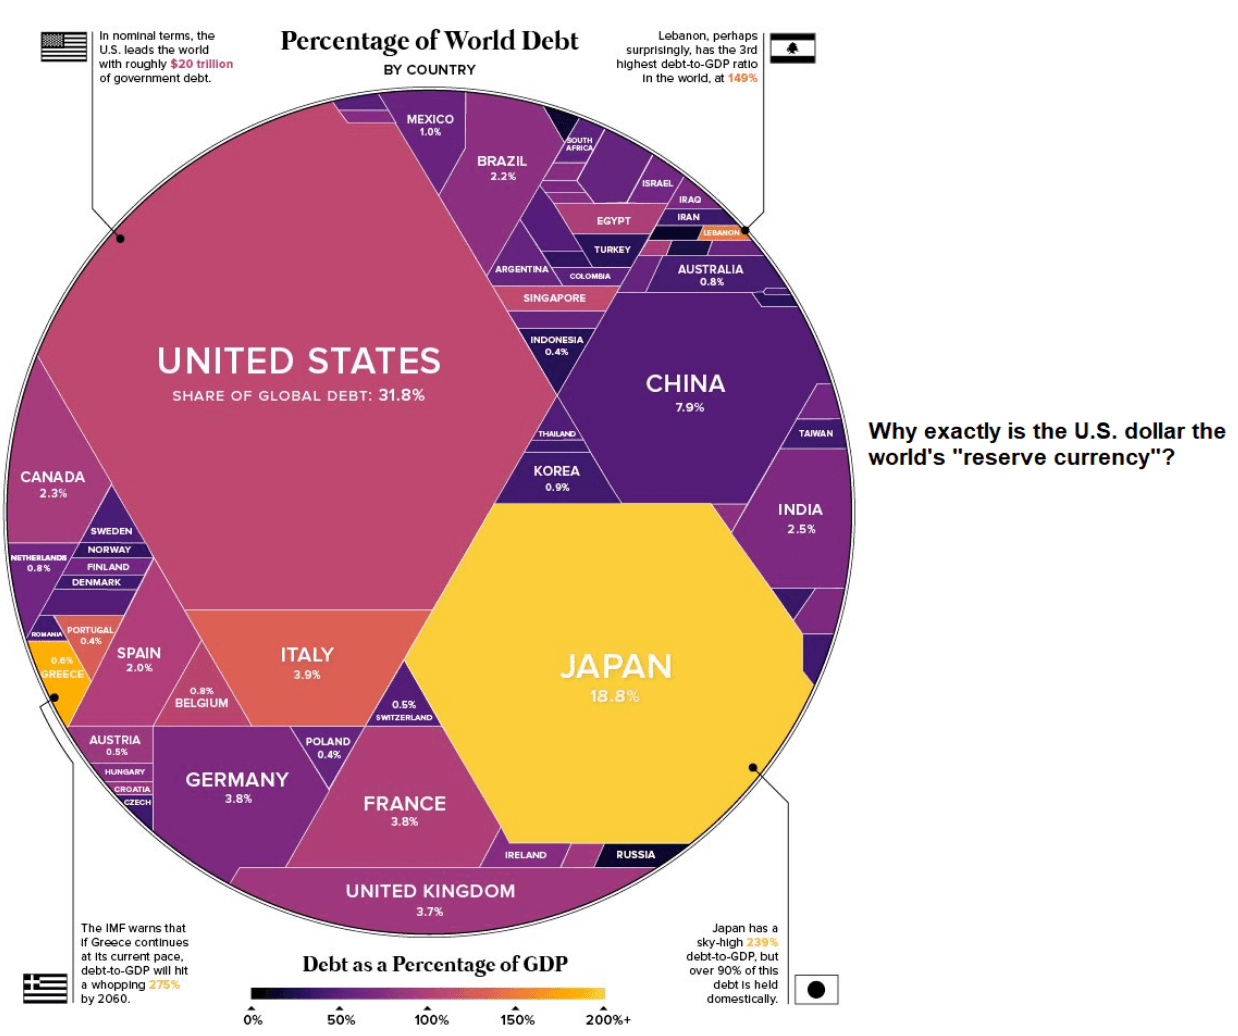
One of the biggest increases has been non-financial corporate debt, rising to $74 trillion and up from $58 trillion in just five years. Globally, the corporate sector is overborrowed and leveraged up. Chinese real estate debt is a potentially major problem, but the problem is everywhere, not just China. In the U.S., many corporations leveraged up just to buy back their own stock helping to push the indices higher. Next up was the growth of government debt at $67 trillion, up from $56 trillion five years earlier. Of that, the U.S. is responsible for 31% of it at $21 trillion. Financial debt stood at $61 trillion at the end of Q1 up from $56 trillion while household debt was $47 trillion up from $40 trillion. The total debt to GDP exceeds 600% in both the United Kingdom and Japan.
If it were only a few voices sounding the alarm bells, they could be easily dismissed. But respected authorities such as the IMF, major banks like Citigroup, and investment companies like Blackrock, and respected economic publications like The Economist are sounding the alarm bells. Many are predicting that a recession could get underway in 2019, and if not this coming year, certainly by 2020/2021. The reality is governments are handicapped as a result of the financial crisis of 2008. They no longer have the wherewithal to bail out the financial system if there is a collapse. Years of ultra-low interest rates and massive injections of liquidity and growth of debt have produced at best feeble sub-par economic growth.
Instead of a bail-out, the keyword is bail-in as debt would be converted to equity, and include deposits not covered by deposit insurance. A wide-spread financial collapse could quickly exhaust deposit insurance funds, as was seen during the 2008 crisis. Choose your financial institution carefully. Canadian banks are amongst the best capitalized with some of the toughest regulations in the world.
A global banking crisis is a distinct possibility. Italy, France, Eastern Europe, China, Japan, United Kingdom, and the U.S. have banks that could be vulnerable. In the EU, the ECB is trying to end quantitative easing (QE), but given EU GDP growth has been sticky at best, ending QE could turn into a disaster. Japan has been going through years of rolling recessions and according to recent numbers appears to entering another one.
Mario Draghi, the head of the ECB, is stepping down and the battle to succeed him could look more like a Game of Thrones scenario, assuming anyone would want the job. The EU is in turmoil with Merkel of Germany departing, Macron of France in deep trouble, and May in the United Kingdom poised to fall because of the potential collapse of Brexit. A worst-case scenario for the U.K., as noted by BOE head Mark Carney, is that a hard Brexit could see the U.K. GDP shrink by 8%, the housing and commercial real estate market collapse up to half, sharply rising unemployment, and a collapsing pound sterling. His worst-case scenario is not pointing to a recession; it points to a depression. Although Carney has been heavily criticized for his gloomy outlook, it can’t be dismissed. Mark Carney is not Marc Faber (aka Dr. Doom, the author of the Gloom, Boom and Doom Report).
© David Chapman
One should keep in mind that the predictive power of the large financial institutions is highly suspect. Few, if any, predicted the collapse of the mortgage security market in 2008 nor the collapse of two giant investment banks. But happen they did. The question going forward is not so much could it happen, but where it will happen and who it will happen to. The expectation is that at some point there will be a shock collapse – aka a black swan event. Many have noted that Deutsche Bank of Germany is a potential collapse candidate. A collapse of Deutsche Bank would make Lehman Brothers look puny. No wonder the German government is pushing a Deutsche Bank/Commerzbank merger.
But a potential collapse is not just limited to Deutsche Bank. In the U.S., leveraged loans are at record levels, with $2.53 billion in withdrawals in the past week—a record. Mutual funds saw the largest withdrawal of $1.82 billion while ETFs lost $705 million. That was the fourth consecutive week of withdrawals. Somebody is nervous. And this is against the backdrop of a U.S. economy that continues to hum along despite the growing problems. It could be a false dichotomy. It was the collapse of the U.S. housing market that led to the near collapse of the financial system. Housing markets are another area of concern because of years of sharply rising prices that have led to a bubble. Rising interest rates and tightening credit conditions could lead to housing market collapses in the U.K., the U.S. (again), Canada, and Australia—to name a few that are vulnerable. Massive amounts of debt mean that governments are ill-equipped to bail them out as happened in 2008/2009.
© David Chapman
Trade wars and sanctions are also taking their toll. Sanctions are just another word for trade wars. The U.S. is currently involved in trade wars and sanctions with so many countries that even we have had trouble trying to tally them all up. But it would not be a mistake to say that two-thirds of the population of the world is either under sanctions or involved in trade wars with the U.S.
Trade wars have been catalysts to world war. In 1907, former British Prime Minister Arthur Balfour (1902–1905) told an American diplomat, “We are probably fools not to find a reason for declaring war on Germany before she builds too many ships and takes away our trade.” By 1914 Germany was surpassing Britain’s economic output and was challenging British supremacy in its overseas empire and its colonies. Britain had signed military alliances with France and Russia while Germany formed an alliance with Austria-Hungary.
Britain may have ruled the seas, but Germany was building an economic powerhouse through steel production, and tank, plane, and shipbuilding. Germany, not being a large naval power like Britain was also building a railway known as the Berlin/Baghdad railway that would link Europe with Asia. If it sounds familiar it is because the current-day comparison is China’s “Belt & Road” initiative (BRI), also known as the “Silk Road Economic Belt.” Britain tried to stop or slow down Germany’s railway and the U.S. is trying to stop or slow down China’s silk road. How? The British armed groups adjacent to the Berlin/Baghdad railway and through bribes had them attack and disrupt. The U.S. is involved in or has encouraged wars in key countries such as Syria along the route of the BRI. Iran is also a key conduit for the BRI.

© David Chapman
The end of WW1 unleashed currency wars that led to the trade wars of the 1930s. The dislocations of reparations on Germany and the Great Depression led to a rise of nationalism and fascist governments in Germany, Italy, and Japan, amongst others. Smoot-Hawley (1930) and the trade wars of the 1930s eventually led once again to real war. There was a saying that “when goods don’t cross borders, soldiers will.” The quote was attributed to a 19th-century French liberal economist Frederic Bastiat 1801-1850.
The economic dislocations of the financial collapse of 2008, coupled with “those left behind” as a result of globalization, have seen the rise of nationalism once again. In Europe, nationalistic populist parties have seized power in Hungary, Poland, and Italy and powerful nationalistic parties are active in numerous other EU countries including France, Germany, the United Kingdom, Austria, and, surprisingly, some of the Scandinavian countries including Denmark and Sweden.
Protests and violence have become a regular occurrence in numerous EU countries. But it is elsewhere as well. Right-wing parties have seized power in Brazil and could do so in a number of other Latin American countries. The Philippines has become a de facto right-wing dictatorship. Nationalism is also rising in North America, particularly in the U.S. and, to a lesser extent, in Canada. The U.S. is led by a nationalist-populist President. As in the past, nationalistic populist parties’ blame is placed on “the others” or, in this case, immigrants.
Global tensions have been rising as trade wars and sanctions threaten to become real wars. There has been a massive build-up of the military all along the Russian border as well as in the Baltic and Black Seas. NATO and Russian warplanes buzz along the border and again in the Baltic and Black Seas. War destroyers of both China and the U.S. and Japan prowl the waters of the South China Sea and have come perilously close to collisions. Russia has moved nuclear bombers into Venezuela, and Chinese and Russian aircraft carrier ships are threatening to prowl the waters of the Gulf of Mexico. Chinese naval ships have been seen off the coast of Alaska, and Chinese, Russian, U.S., and other warships prowl the Mediterranean Sea. Tensions continue in the Mid-East as the U.S., Russia, and Turkey vie for power.
The U.S. has constantly threatened Iran. Iran is the world’s fifth-largest oil producer and natural gas producer. Iran abuts the Straits of Hormuz where one-third of the world’s oil passes. Iran is also a key conduit for China’s silk road. Finally, tensions and a low-level war persist in Israel with the Palestinian territories and Israeli bombing of Iranian facilities in Iraq.
Climate change has been deemed a geopolitical threat. Yet there exists a constant battle between those who recognize the dangers of climate change and those who deny climate change is a threat or even exists. Already climate change—or however one wishes to refer to it—is causing major dislocations with fierce hurricanes, tornadoes, devastating fires, freak flooding and snowstorms, drought, and rising sea levels, as well as threatening bio-diversity and continuation of species. Whether one wishes to believe that climate change is real or not, the biggest threat, as laid out by even the U.S. Pentagon and the CIA, is to food supplies. Gwynne Dyer wrote a book in 2008 entitled Climate Wars wherein he describes a world at war for survival as the world overheats. Much of what he wrote about is already happening or is pointed in that direction.
Wall Street may be beginning to notice the Mueller investigation after the testimony, indictment, and jail term of Trump’s former lawyer Michael Cohen. Once Wall Street became concerned about the Watergate investigation and especially following what was known as the “Saturday Night Massacre” in October 1973, a long decline in the stock market intensified. A new Democrat-controlled Congress takes office in January 2019. The investigation of President Trump is sure to intensify. Attempts to impeach him could create a constitutional crisis along with violence on the streets as he whips up supporters.
All of these themes are currently present and will continue into 2019. Given the current direction, all are bound to intensify as the year progresses. There will be ebbs and flows and, as we have seen already, nothing will be particularly clear. Stock market volatility is sure to continue. Some are even touting a 1929-style crash followed by another Great Depression. Given the current direction it is a possibility and shouldn’t be dismissed as the ravings of perma-bears, doomsayers, and charlatans. Warnings from the IMF, the Pentagon, and others should not be taken lightly or dismissed.
In terms of cycles we follow, our suspicion is that something bigger is at play. We have noted in the past that the financial collapse of 2007–2009 was most likely the culmination of three major cycles. These were: the 75-year cycle, which came 75–77 years after 1932; the 37.5-year cycle, which came 33–35 years after the 1973-1974 stock market collapse; and the 18.75-year cycle, which came 21 years after the stock market collapse of 1987. All were within an acceptable range. Some have wondered as to whether there is a 90-year cycle of major depressions/long steep recessions. Ninety years after 1932 comes 2022. Ninety years before 1932 was 1842 and the U.S. and the world were in the grips of a deep economic depression.
The well-known 4-year cycle has a range of 3–5 years. It last bottomed in 2015/2016. As we enter 2019, we are in the early stages for a potential four-year cycle low that could range from 2019–2021. There has also been a steady 6.5-year cycle (range 5–8 years) and it too last bottomed in 2015/2016. It is next due 2020–2024. An interesting cycle that gets little notice is the Mayan cycle of 51.6 years. If, as we suspect, the markets topped in 2018, we can go back 51.6 years and we come to 1966. That year proved to be a major top for the next 16 years until the final (inflation-adjusted) bottom in August 1982. There were a few instances of marginally higher nominal highs but on an inflation-adjusted basis, the 1966 top wasn’t taken out until 1994. The 18.75-year cycle has some overlaps with the 6.5-year cycle. The range for the 18.75-year cycle is 13–22 years. That means the next one is due anywhere from 2022–2031. All of this points to a potential decline of at least 30% and more likely one of 50%–60% à la 2008.
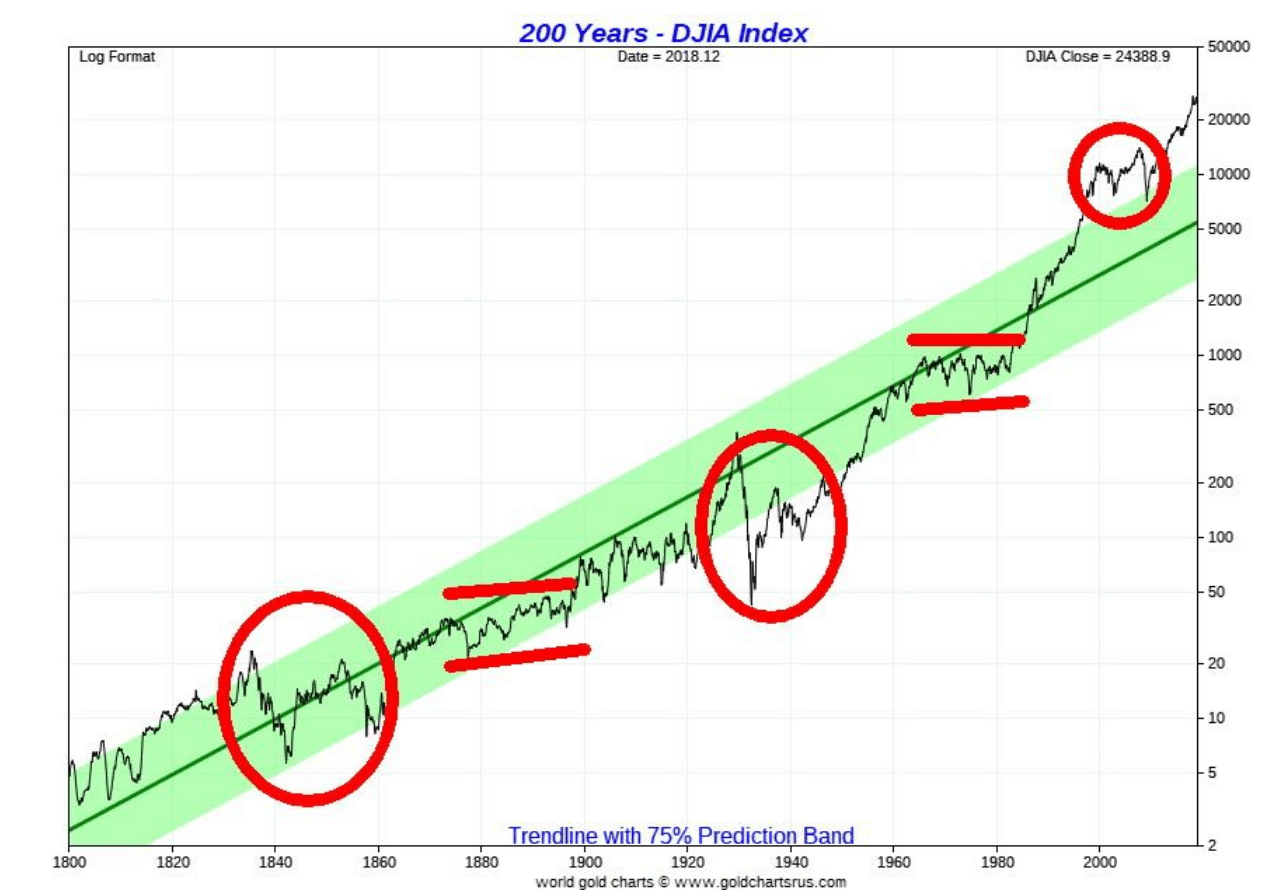
We are showing a really long 200-year chart of the DJI below. There are a couple of interesting observations. We noted the potential for a possible 90-year cycle. We have circled three periods. The first period runs from roughly 1837 to 1861, the second 1929–1949, and the third covers the period 2000–2009 only. The first two periods occurred within a range of roughly 90 years apart (1837–1929 = 92 years; 1861–1949 = 88 years). Both were periods of economic depressions and wars. The second period which is blocked out with the first one known as the “Long Depression” running from 1873–1896. The second blocked-out period was the long recession of the 1970s that ran roughly from 1966 to 1982, although 1984 might be more appropriate even though it was a higher low. Again, the periods are roughly 90 years apart (1873–1966 = 93 years; 1896–1984 = 88 years).
A characteristic of all of these periods of depressions and recessions was a sharp turndown followed usually by a period of a respite than another sharp downturn. That was certainly the case with 1837–1861 and 1929–1949 while the other periods 1873–1896 and 1966–1984 tended to be choppy up and downswings. The period 2000–2009 does not conform to the 90-year cycle. We noted that one is more likely the 75-year cycle. If the 90-year cycle theory holds, then we do note that 2018 is 89 years from 1929. At the other end 1949 + 90 = 2039. Are we prepared for a possible long period of recession or depression lasting 20 years? Given the current direction of many things, we have noted it is not beyond the realm of impossibility and shouldn’t be dismissed out of hand.
Note how the DJI has overthrown its 75% prediction band. It would not be unusual to have it fall back within the band once again and test the center line. It is currently down near 5,000. The 2008 financial collapse only tested the upper edge of the band. The only other time the DJI overthrew or in this case underthrew the predictive band was during the Great Depression.
© David Chapman
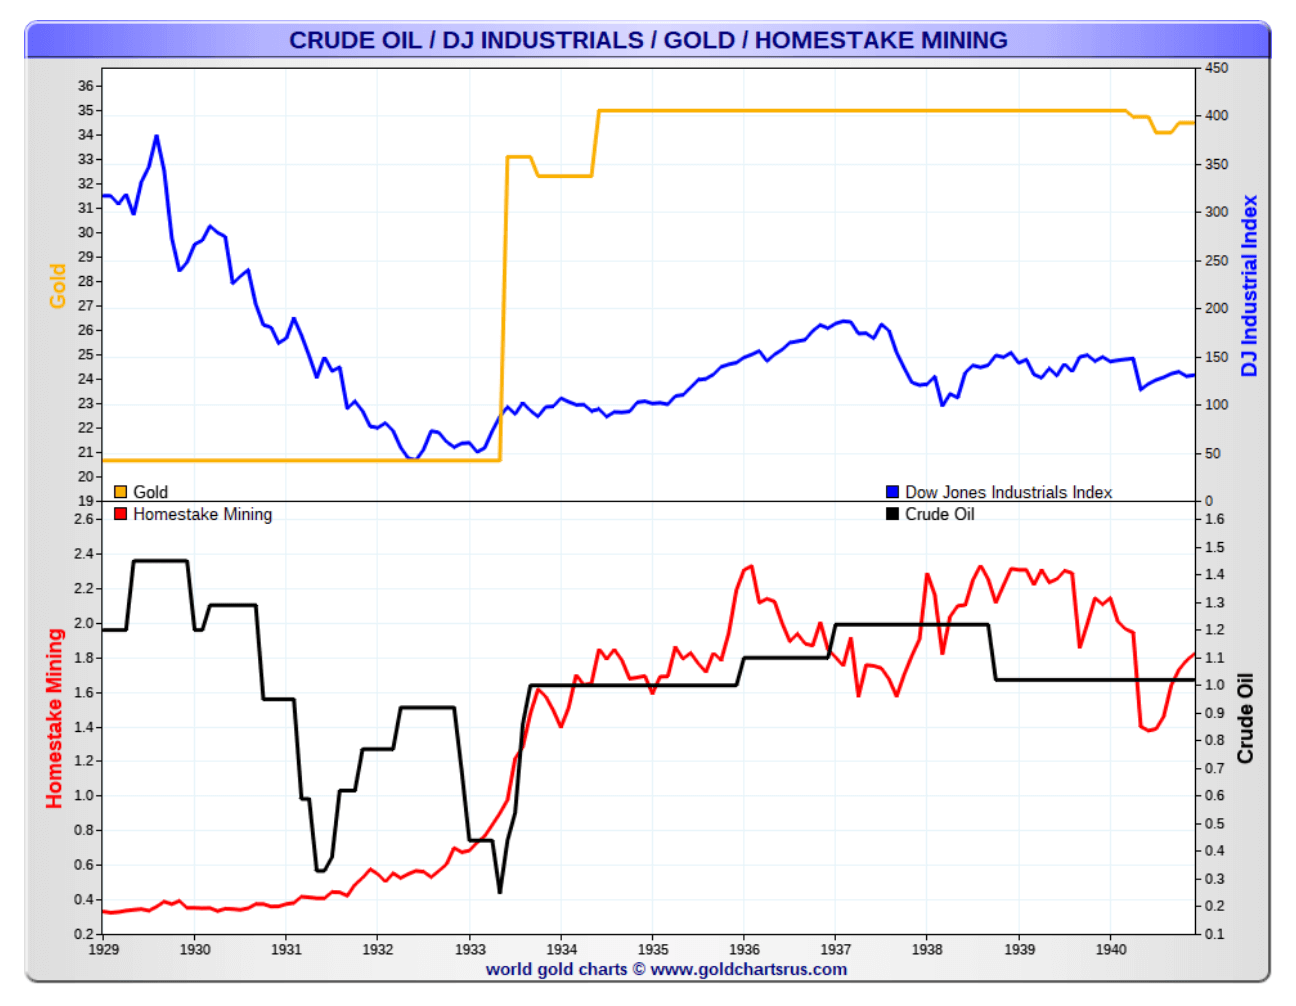
One thing that performed well during previous periods of depressions and recessions was gold. If we accept the fact that gold is money (many don’t), then we need to examine the performance of gold during those periods. As we know, the world was largely on a gold standard throughout the 19th century and into the 20th century. The gold price was fixed. We only have a history of free-trading gold from the 1970s following the closing of the gold window by President Richard Nixon in August 1971. During the Great Depression, the Gold Reserve Act of 1934 revalued gold upward from US$20.67 to US$35, a roughly 70% increase.
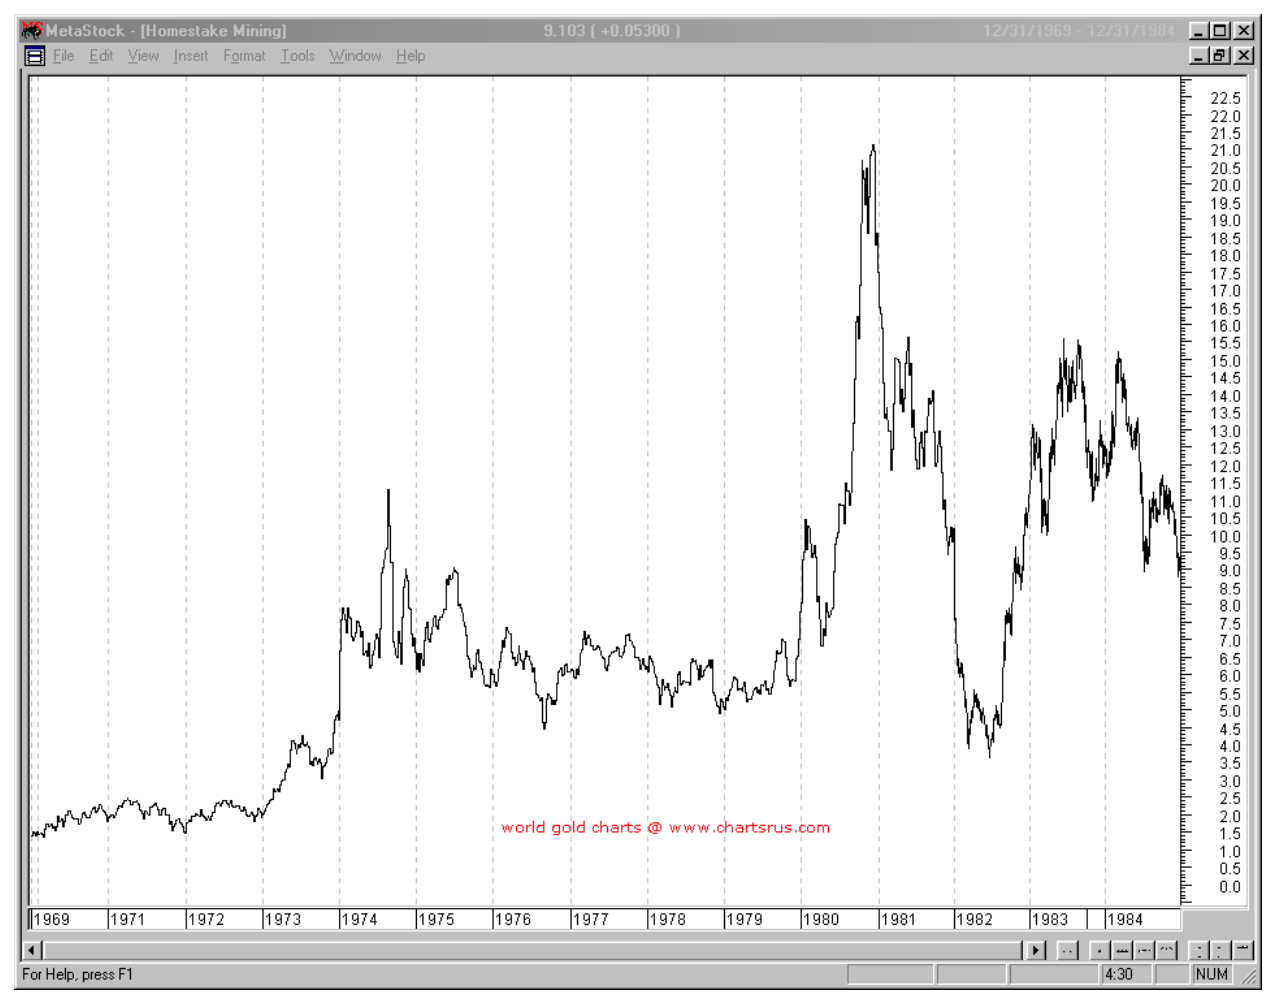
But there was more. Gold stocks were active and one of the key stocks was Homestake Mining (HM) (since merged with Barrick Gold in 2002). During the Great Depression, while the DJI was falling 89% HM was rising. By 1933, HM was up 474% from where it was trading in 1929. Dome Mines, another large gold miner gained 558% in the same period. HM acted as a proxy for gold.
© David Chapman
During the 1970s gold and gold stocks vastly outperformed the DJI and the stock market. Gold rose from $35 to a peak of $875 in January 1980. When the stock markets were beginning to launch in 1984, gold was still trading between $300 to $400 up from $35 in 1970. Similarly, gold stocks soared during the 1970s. HM rose from roughly $1.50 in 1969 to a peak of $21 by 1980 a gain of roughly 1,300%. HM was still trading around $9 in 1984 when the stock market began to take off.
Gold last peaked in 2011 at about $1,923. Today, it languishes near $1,250. However, gold has been rising in all major currencies. While gold is up about 19% in US$ terms from its major low in 2015, gold is up in the same period almost 34% in Canadian dollars, 36% in euros, 15% in Japanese yen, and 43% in pound sterling. Despite considerable malignment compared to the stock indices the TSX Gold Index (TGD) is up 52% from its major low in late 2015. That has actually outperformed the TSX which is only up 26% and the S&P 500 up 34% in the same time period.
Homestake Mining 1969-1984 © David Chapman
Gold acts as a safe haven during periods of economic stress. It acts as a hedge against a stock market crash. Gold is money. It has intrinsic value and no liability, unlike stocks and bonds. Currencies (Cdn$, US$, euros, etc.) are backed by nothing except a promise to pay (I.O.U.) the very definition of fiat currency. Gold has a limited supply, unlike a government printing press. Low prices have ensured that no major new gold mines have been found over the past decade.
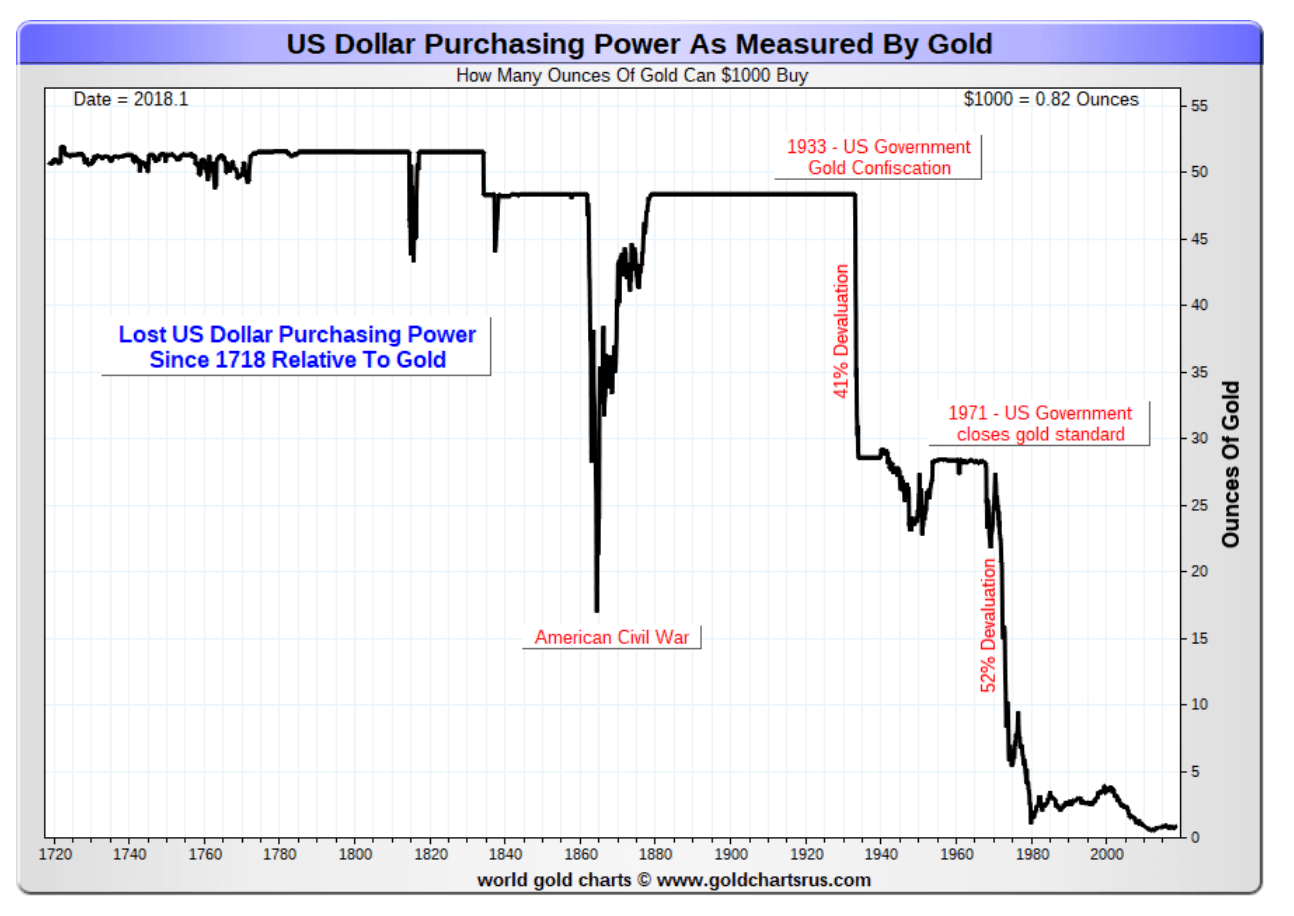
The value of gold holds up over a long period of time. The US$ (and Cdn$) have lost purchasing power over a long period of time. When Richard Nixon closed the gold window in 1971, US$1,000 purchased 28.5 troy ounces of gold. Today, that same US$1,000 will buy only 0.80 troy ounces of gold. Even for Canadians, Cdn$1,000 purchased the same 28.5 troy ounces of gold in 1971. Today, Cdn$1,000 will buy only 0.60 troy ounces of gold. If someone took that $1,000 in 1970 and put it under a mattress, they would still have $1,000 today. But if they had purchased 28.5 ounces of gold and put it under the mattress, they would have U.S.$35,000 or Cdn$47,000 today.
© David Chapman
The volatility of the stock market over the past year points to problems ahead. A lot of negatives are beginning to come together as we go into 2019. If we are correct, then odds favor that the stock indices could be lower in 2019. There will be areas that do better. Some areas of high technology, health care and consumer staples are three that come to mind.
History is replete with debt collapses as well as stock market panics, depressions, and war. They always say “this time it is different.” The only thing that is different is what might trigger a collapse. “Black Swan” events do occur. Think of war – Pearl Harbour December 1941, sudden shocks – Arab Oil Embargo October 1973, 9/11 attacks September 2001 or financial shocks – Lehman Brothers September 2008. We have outlined many risks as we go into 2019 and none of them are favorable. But gold has a history of acting as a safe haven during periods of economic stress. It might be worthwhile to own some.
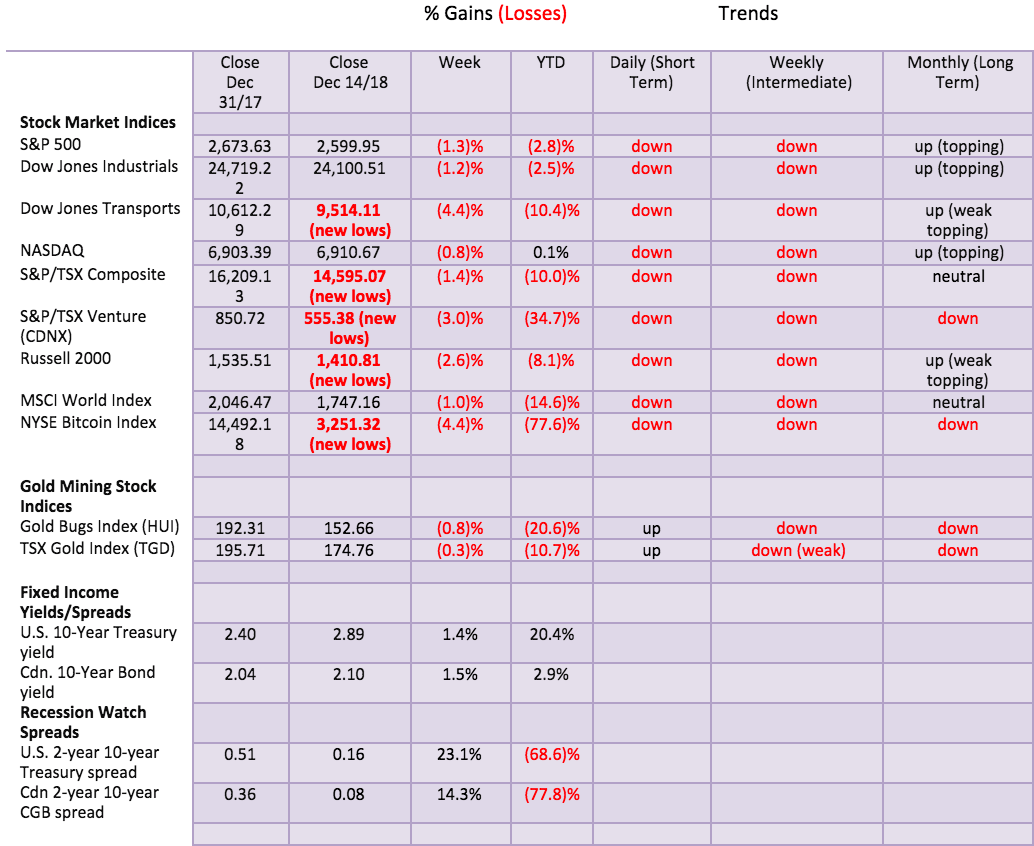
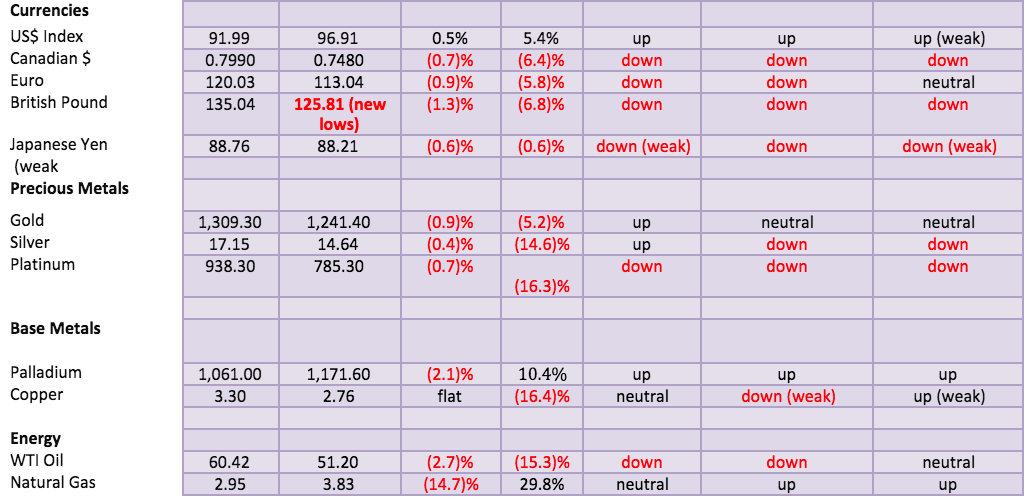
Markets and trends
 New highs/lows refer to new 52-week highs/lows. © David Chapman
(Featured image by DepositPhotos)
—
DISCLAIMER: David Chapman is not a registered advisory service and is not an exempt market dealer (EMD) nor a licensed financial advisor. We do not and cannot give individualised market advice. David Chapman has worked in the financial industry for over 40 years including large financial corporations, banks, and investment dealers. The information in this newsletter is intended only for informational and educational purposes. It should not be considered a solicitation of an offer or sale of any security. The reader assumes all risk when trading in securities and David Chapman advises consulting a licensed professional financial advisor before proceeding with any trade or idea presented in this newsletter. We share our ideas and opinions for informational and educational purposes only and expect the reader to perform due diligence before considering a position in any security. That includes consulting with your own licensed professional financial advisor.

-

 Africa2 weeks ago
Mozambique Nears End of Rate Cuts as Flooding Risks Mount
-

 Markets1 day ago
Silver Dips Sharply, While Gold Gains Amid Mixed Stock Market
-

 Crowdfunding1 week ago
EvenFi Launches Run-Off Service to Protect Investors as Crowdfunding Platforms Exit
-

 Crypto5 days ago
Ethereum’s Growing Capacity Puts Pressure on Layer 2 Platforms


You must be logged in to post a comment Login