Featured
Mid-August Market Update: The Dow Jones Made Four New BEV Zeros This Past Week
For as long as this party goes on, the bulls have the ball on their side of the court. What that means for the Dow Jones I haven’t a clue. Maybe a close over 40,000 sometime in early 2022? From this week’s close, that would be an advance of only 8.8% or so. On the other side of that is the possibility of a loss of 30% or greater in a few weeks’ time, something similar to what happened in February / March 2020.

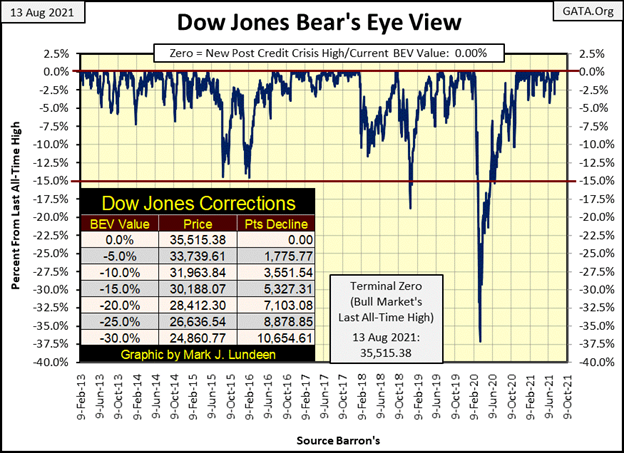
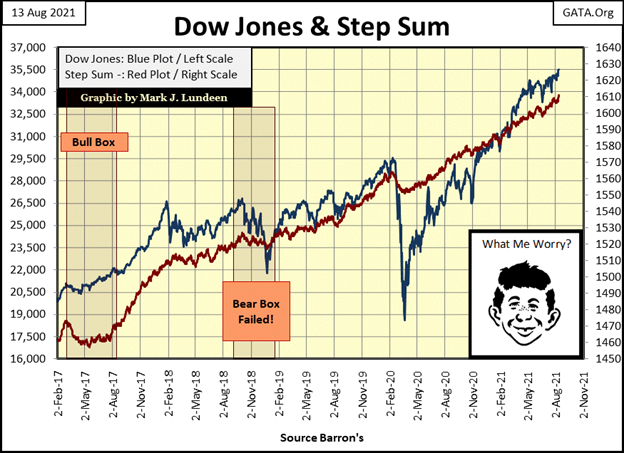
This week the Dow Jones made four new BEV Zeros (new all-time highs), which on a BEV chart looks pretty boring. And it’s not just these new all-time highs making the Dow Jones’ BEV chart below appear so tedious; since last November, the Dow Jones hasn’t corrected from one of these forty-one new BEV Zeros by even 5%. On June 18th Dow Jones saw a BEV of -4.28%, but following that the Dow Jones hasn’t seen a BEV of -3% or more.
Keep in mind, the Bear’s Eye View is just that; Mr Bear’s view of the market / new all-time highs (BEV Zeros) and percentage claw-backs from them. Unless he’s clawing back the bulls’ capital gains by some double-digit percentage, as he did in February / March 2020 below, there isn’t much of a show going on in a BEV chart.
Looking at the table listing the corrections, the Dow Jones broke above and closed above 35,500 today. After making four new BEV Zeros this week this shouldn’t be a surprise. But those four new all-time highs only pushed the Dow Jones up by 307 points from last week’s close. In a market where the Dow Jones is trading above 35,000, one would expect the bulls could have gotten more than 307 points out of four new all-time highs in a single week.
But it is what it is, and what it is, is the Dow Jones has been making market history for the past ten months, since last November.
The Dow Jones, as see in its daily bars below, displays more drama for us to enjoy. The Dow Jones has been stymied by its 35,000 level since early May, and this week it left all that behind as it closed above 35,500.
What’s next? I’m thinking 36,000. What Mr Bear has on his mind I’m sure is something else, something far below 35,000. As long as the Dow Jones continues advancing in tiny baby steps, as seen below, I’m not going to worry about what Mr Bear may be thinking.
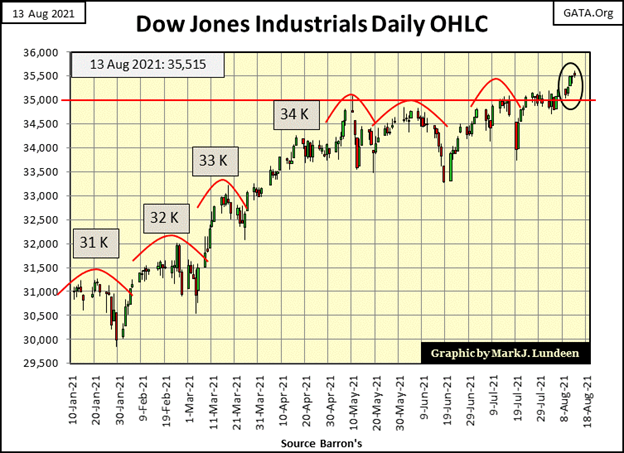
When market volatility once again becomes a factor in the stock market, and the daily bars become huge daily events (Dow Jones 2% days), that’s when I’d become worried about what’s on Mr Bear’s mind.
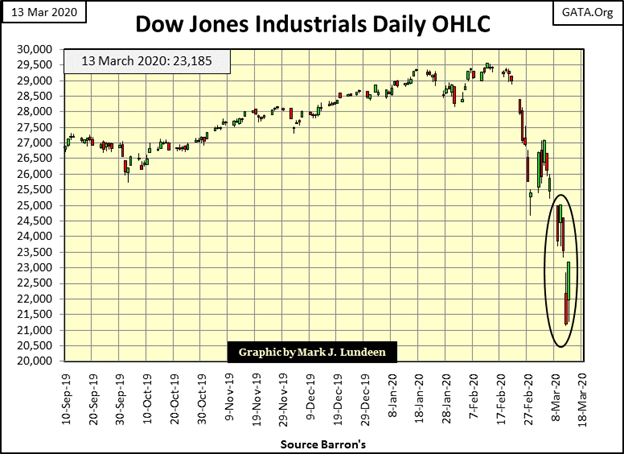
Below is the Dow Jones in daily bars from my 13 March 2020 article. A year and a half ago, it wasn’t hard seeing when Mr Bear returned to the stock market, as he ripped market valuation from the bulls. I expect the same will be true when he next pays Wall Street a little visit.
Note the large advancing bars (green) below. BIG daily advances, as seen below are bear market events, not excuses to step into the market to scoop up some bargains.
For as long as this party goes on, the bulls have the ball on their side of the court. What that means for the Dow Jones I haven’t a clue. Maybe a close over 40,000 sometime in early 2022? From this week’s close, that would be an advance of only 8.8% or so. On the other side of that is the possibility of a loss of 30% or greater in a few weeks’ time, something similar to what happened in February / March 2020 seen above.
Keep in mind the point I made last week; with all bull-market advances, risks only increase with the market’s rising valuation, as the potential for profit diminish, eventually to zero at the very top of the market.
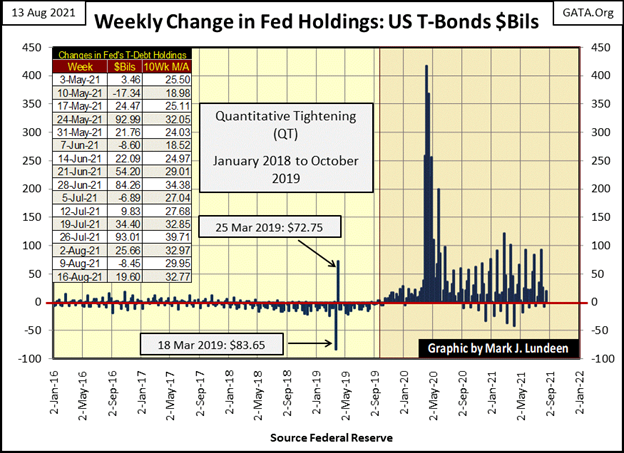
The FOMC continues “injecting liquidity” into the market; this week with an “injection” of $19.60 billion. As long as the FOMC can control bond yields and interest rates, keeping them near their present levels, their “liquidity injections” should “support market valuations.” But come the day when the market recognizes the bond market is in a big-bear market – rising yields and deflating valuations, there will be little the FOMC can do to “support market valuations” with monetary inflation.
The major problem for the “policy makers” is their “liquidity” is now flowing into consumer prices. The following quote from Barron’s on rising inflationary pressures is only the beginning.
https://www.barrons.com/articles/inflation-producer-price-index-stock-market-51628772904
At some point in the future, buyers in the debt markets will once again demand an inflation premium, exactly as they did from the late 1950s to 1981 when corporate bond yields increased from below 5% to well into double-digits. Just seeing rates and yields in the debt market return to where they were before the sub-prime mortgage debacle (around 5%) would crash the stock market.
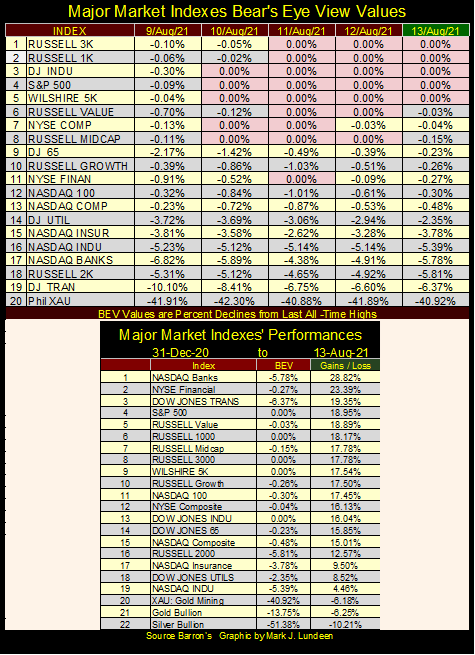
The week closed with five of the major indexes below at BEV Zeros, and the next ten of them in scoring position. Scoring position being within 5% of an index’s last all-time high.
This is how bull markets work in a BEV plot. A market series makes repeated BEV Zeros, which the index then declines from, until once again the index sees another new all-time high. The Dow Jones since last November has made forty-one BEV Zeros, after each the Dow retreated down into scoring position. That’s how bull markets work their way up the hill.
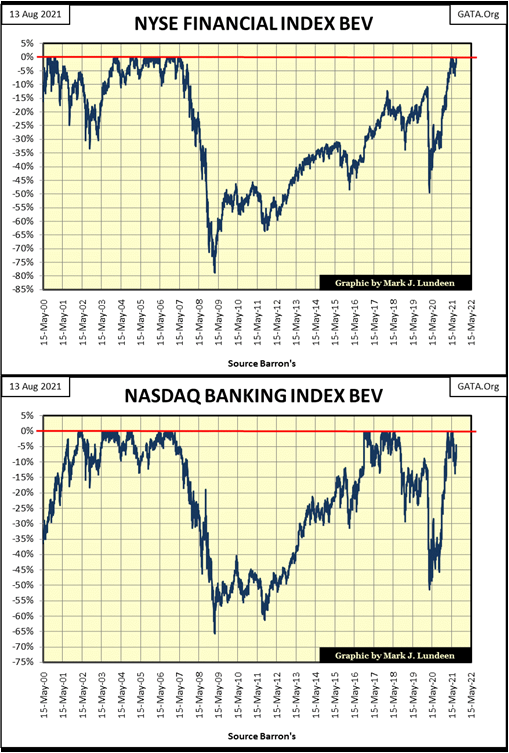
The NYSE Financial and NASDAQ Banking indexes took a lot of damage during the sub-prime mortgage crisis (2007-09), as seen in their BEV charts below. And last year’s flash-crash (February – March 2020) saw each of them lose 50% of their market valuation in a few weeks. But those were the bad old days. Now in the summer of 2021, both are again seeing new BEV Zeros, which is a good thing.
However, for the past twenty years both have been very sensitive to “disturbances in the force”, if you know what I mean. What I mean is they were not much damaged with the popping of the high-tech bubble (2000-2002). But they proved to be “ground zero” for disastrous consequences from FOMC “policy miscalculations” of the 21st century. At their sub-prime mortgage bottoms (first half of 2009), each of these indexes deflated by over 70%. Last year during the February / March flash-crash, each deflated by 50% before Fed Chairman Powell injected a few trillion into the financial system.
I think I’ll keep an eye on them in the coming year. Should they once again deflate down to their BEV -20% lines, can a new, and larger QE be far away? I think not.
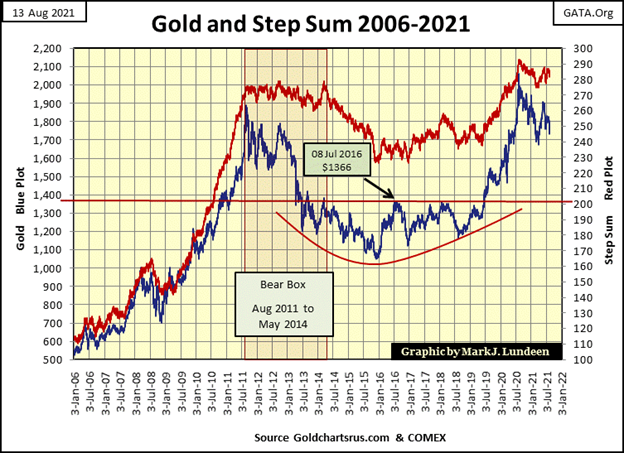
Moving on to gold’s BEV chart, and I really like what I see below. Last week we discovered the answer to the question; what BEV line would gold next cross, and the answer was its -15% BEV line ($1752).
Last Sunday night, with most of the world still asleep, goons from the COMEX flooded the over night market with $4 billion in sell orders, resulting in a sharp $100 decline in the price of gold. Nothing that we’ve haven’t seen before. But what’s refreshing is gold, at the close of this week, actually closed $17.45 above last Friday’s close.
On a closing basis, all last week the goons failed to drive gold below a -16% BEV. Really? Yes, really! Worse yet (for the goons) gold closed the week with a BEV of -13.75%, meaning gold isn’t all that far from its BEV -10% line. If you’re one of those COMEX goons who whacked gold last Sunday night, last week’s market action at the COMEX has to give pause for thought of the futility of life as a COMEX goon.
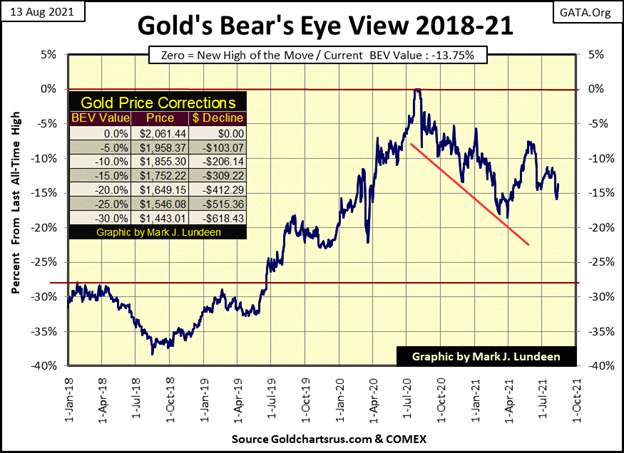
This is excellent market action! We may see another assault on gold and silver next week, but I believe the way has been made for gold to advance now, and then clear its BEV -10% line in the chart above. You guys do realize I’ve placed a table listing BEV values along with their dollar values in the BEV chart above? Gold’s current BEV -10% line is equal to $1855. Should gold break above that level in the following month, we could see some real excitement in the precious metal markets before 2021 comes to an end.
Gold’s step sum chart below is little changed from last week. The low of March 30th ($1679) is still holding. Nothing happening this week changed that. After seeing the failed bear raid on the gold and silver markets this week, I believe the path of least resistance for the old monetary metals is up.
I’ve not kept it a secret; I don’t like this stock market. That said, the Dow Jones and its step sum below continues looking good.
In normal times (which this isn’t), I’d be concerned that following the 91% (16,923 point) advance seen following the twenty-seven day, -38% deflation event of March 2020, the Dow Jones is due for a double-digit percentage correction that may take six months or maybe even a year to complete.
But this isn’t a normal market. What this is, is a market controlled by “monetary policy” flowing from the FOMC. I really believe they fear that should they allow the market to correct by 10% to 15% from current levels, they may not have the means to reverse the correction, no matter how many trillions-of-dollars they “inject” into the financial system.
So, I expect we’ll see the Dow Jones continue crawling up in the market for as long as the FOMC remains in control. When they lose control, it will be a repeat of what we saw in March 2020, as seen in its March 2020 daily bar chart I included earlier. Oh, those dreaded Dow Jones 2% days seen in March 2020!
Take a quick look at gold’s BEV values for last week in the table below. On Sunday night, when most of the buyers were still asleep, COMEX goons flooded the gold futures market with $4 billion in sell orders. Yet, they failed to drive gold’s BEV down into the sub -16% BEV range any day last week. I think this is very significant. Last Sunday’s failed bear-raid may prove to be a bullish-turning point in the gold and silver markets.
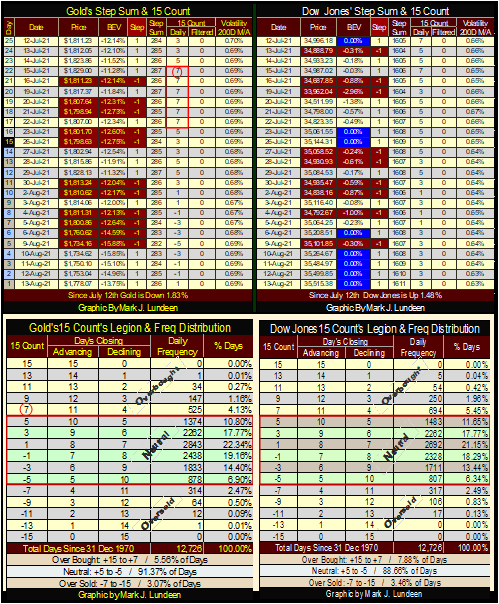
On the Dow Jones’ side of the table, look at all those pretty blue BEV Zeros the stock market saw last week. I doubt we’ll see another four next week. However, for as long as the FOMC can “contain inflationary pressures” in the commodity markets, and constrain bond yields and interest rates, I’m expecting more blue BEV Zeros in the weeks and months to come. But in August 2021, the stock market is becoming a mug’s game. The precious metals and their miners are where the real action will be found in the coming years.
I watched some of Mike Lindell’s Cyber Symposium last week. Then I looked at some of the coverage of it by the usual suspects (the mainstream media). They made no effort to report to their audience any factual information on last year’s election theft, choosing instead to focus on the trivial and mundane aspects of the event. I’m sick of them all, including Fox News.
If we had a functioning system-of-law in this country, the Justice Department would take Mike’s evidence and start prosecuting the many guilty. Which by necessity would include members of the MSM for being accessories before, during and after the fact of last November election fraud on the nation.
—
(Featured image by sergeitokmakov via Pixabay)
DISCLAIMER: This article was written by a third party contributor and does not reflect the opinion of Born2Invest, its management, staff or its associates. Please review our disclaimer for more information.
This article may include forward-looking statements. These forward-looking statements generally are identified by the words “believe,” “project,” “estimate,” “become,” “plan,” “will,” and similar expressions. These forward-looking statements involve known and unknown risks as well as uncertainties, including those discussed in the following cautionary statements and elsewhere in this article and on this site. Although the Company may believe that its expectations are based on reasonable assumptions, the actual results that the Company may achieve may differ materially from any forward-looking statements, which reflect the opinions of the management of the Company only as of the date hereof. Additionally, please make sure to read these important disclosures.


Youth Cannabis Use in Colorado Is Falling — But the Full Story Is More Complex
The 2026 Colorado survey shows teen cannabis use fell to 10 percent in 2025, down from 21 percent in 2015....


Morocco’s Growth Holds at 4.6% as Agriculture Offsets Economic Pressures
Morocco’s economy grew 4.6% in Q1 2026, driven by a strong agricultural rebound offsetting declines in industry. Services expanded moderately...


Abivax Shares Surge as New Trial Data Eases Safety Concerns Over Ulcerative Colitis Drug
Abivax shares surged nearly 36% after positive updated trial results for its ulcerative colitis drug obefazimod reassured investors following earlier...


El Dorado Raises $9M to Expand Cross-Border Fintech Platform
El Dorado, a Latin American fintech improving cross-border financial services, raised a $9 million Series A led by Paradigm with...


Bitcoin Stalls Near $60K as Strategy Moves, ETFs Outflow, and EU MiCA Rules Take Effect
Bitcoin hovers near $60,000 with ETF outflows, while Strategy boosts reserves, sells BTC, and raises dividends to reassure investors. Ethereum...
 |
|
 |  |
 |
|
-

 Markets1 week ago
Cocoa Market Faces Mixed Trends Amid Rising Supply and Weak Demand
-

 Africa6 days ago
Bank of Africa Expands Sino-African Trade Partnerships in Beijing
-

 Biotech2 weeks ago
Bavarian Biotech Sector Expands with Record Funding and Startup Growth in 2025
-

 Africa2 days ago
BOAD Approves Major Funding Boost to Drive West African Development