Featured
More companies join the trillion-dollar market cap club
A small group of stocks are driving this market higher, and the fragility of the bull market has never been more extreme. Stock valuations have now reached an all-time high. They are nearly twice as high as the historical average and even higher than the NASDAQ bubble peak! This iteration of a massive equity bubble has seen a turn toward passive investments and a surge of money going into ETFs.

There are a handful of stocks in which institutions and individual investors have recently piled into. This behavior is emblematic of all bull markets once they begin to hit the manic phase. Wall Street falls in love with a few high-growth darlings and takes their valuations up to the thermosphere.
If you add up the market capitalizations of just four stocks, Google (Alphabet), Apple, Microsoft, and Amazon, their combined worth exceeds $5 trillion. If you throw in Facebook, you get the top 5 biggest firms by market capitalization, and they compose an amazing 18% of the S&P 500. Another way of looking at this is that the market cap of a full 282 companies in the S&P 500 now equals the same as the top 5 behemoths.
Again, this is not dissimilar to what has occurred in past blow-off tops. Recall the NASDAQ internet craze in the late ’90s and the Nifty Fifty bubble mania of the late ’60s and early ’70s. In the 694 days between January 11th, 1973, and December 6th, 1974, the Dow Jones Industrial Average lost over 45% of its value, but many stocks in the Nifty Fifty fared much worse. The Dot.com disaster was even more dramatic. It caused 5 trillion dollars of equity to vanish and wiped-out nearly 80% of market value.
The Nifty 50 stocks were the fastest-growing companies on the planet in the latter half of the 1960s and became known as “one-decision” stocks. These were viable companies with real business models but became extremely over-priced and over-owned. Investors were lulled into the belief they could buy and hold this group of stocks forever. By 1972, the overall S&P 500 Index’s P/E stood at 19. However, the Nifty Fifty’s average P/E at that time was more than twice that at 42. When the inevitable crash arrived, stocks that were part of the Nifty Fifty fell much more than the overall market. For example, by the end of ’74, Xerox fell 71 percent, while Avon and Polaroid plunged by 86 percent and 91 percent, respectively.
The years 1994 to 2000 marked a period of massive growth in the adoption of the internet, leading to a massive bubble in equities surrounding this technological revolution. This fostered an environment where investors overlooked traditional metrics, such as the price-earnings ratio. During this period, the Nasdaq Composite Index rose 400%, as its PE ratio soared to 200.
It’s always the same story: near the end of a massive bull market, a relatively small number of stocks get taken to incredible heights by a public that is thirsty for some story to justify such lofty valuations that are far above fundamentals. This can be clearly proved by viewing the Market capitalization of the Wilshire 5000 as a percentage of GDP. Stock valuations have now reached at an all-time high. In fact, they are nearly twice as high as the historical average and even higher than the NASDAQ bubble peak!
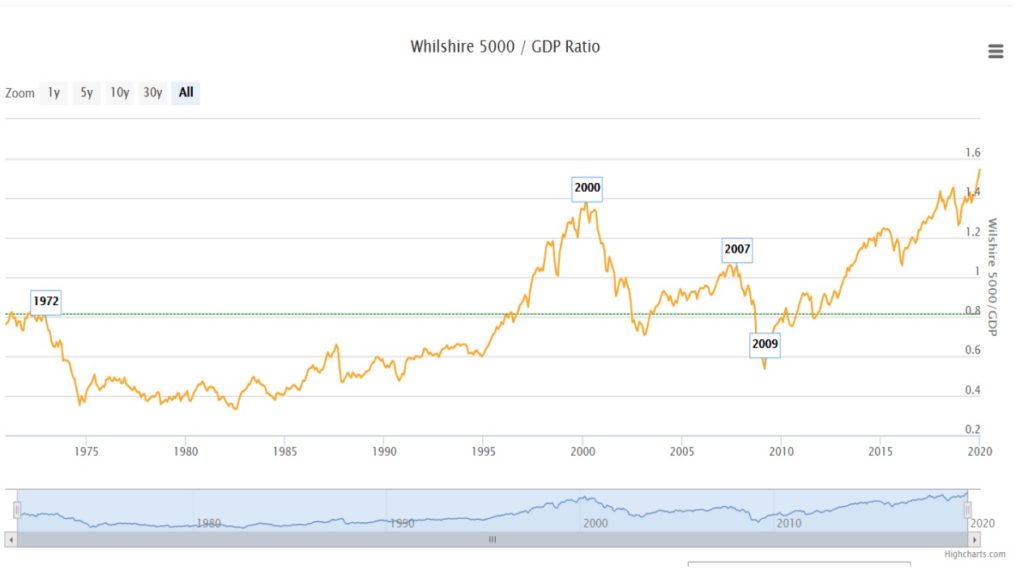
Not only this, but there are a record number of IPOs that don’t make any money, and a near-record number of U.S. listed companies that are spewing red ink—just like in past bubble tops.
This particular iteration of a massive equity bubble has seen a huge turn towards passive investments and a surge of money going into ETFs.
A paper done by the Federal Reserve explains that passive funds in 2018 now account for 39 percent of the combined U.S. Mutual Fund and ETF assets under management, up from just 3 percent in 1995 and 14 percent in 2005. According to the paper, passive investing is pushing up the prices of index constituents and there is a risk that rising prices can lead to more indexed investing, and the resulting “index bubble” eventually could burst.
The potential problem with ETFs
This brings us to a potentially huge problem with the overall market. A study done by Factset shows that in some instances of the largest market cap stocks that are held within ETFs, they represent more than 30 days of the average daily trading volume of the individual security that is traded on the exchanges. This means, for example, if only 10% of ETF holders decide to sell the security on any given day, it will represent three times the entire volume that is traded on the NYSE. Therefore, what we have is a condition where investors have become overcrowded in a few positions–just like what has occurred in previous market tops. However, this time around the situation is compounded by an influx of new money that has piled into ETFs. These same investments have doubled down on the doomed strategy of piling into a handful of winners.
In 2008 there was just $700 billion invested in ETFs; today, there is just under $5 trillion. ETFs have greatly exacerbated market directions in the past. Their existence tends to propel bull markets higher but, on the flip side, they also have led to flash crashes. To fully understand the dangers associated with buying and holding ETFs—and the overall market in general, especially in a bear market–you have to understand the process of creation and redemption units and how Authorized Participants (AP) function.
APs are the only entities that are allowed to directly interact with an ETF provider in order to create and redeem units. During a bull market, an ETF often trades at a premium to the underlying securities held by the index it tracks. In this case, an AP can buy the individual shares on the index at a discount and exchange them for a new ETF that is trading in the market at a higher price and then sells the ETF in the market for a profit. This process is known as creation, which adds to the supply of ETFs. And, it perpetuates the bull run.
Conversely, during market panics, an ETF will often sell at a steep discount to the shares trading on the index. In this case, an AP can buy the ETF in the market and exchange it for the individual shares on the index from the provider that is trading at a higher price. The AP can then sell the individual shares on the open market. This process is called redemption, and it reduces the number of ETF units. However, this process has also exacerbated crashes in the past by adding more selling pressure on to the individual shares of the index, which in turn leads to more panic selling for the less liquid ETF market.
Who are these very few lucky and privileged Authorized Participants? You may have guessed it, large banks such as; JP Morgan, Goldman Sachs, and Morgan Stanley.This is just one more reason that validates the necessity of having a process that identifies when the epoch bear market begins before one occurs… because the next bear market should be one that makes the Great Recession of 2008 seem benign in comparison.
—
(Featured image by StockSnap from Pixabay)
DISCLAIMER: This article was written by a third party contributor and does not reflect the opinion of Born2Invest, its management, staff or its associates. Please review our disclaimer for more information.
This article may include forward-looking statements. These forward-looking statements generally are identified by the words “believe,” “project,” “estimate,” “become,” “plan,” “will,” and similar expressions. These forward-looking statements involve known and unknown risks as well as uncertainties, including those discussed in the following cautionary statements and elsewhere in this article and on this site. Although the Company may believe that its expectations are based on reasonable assumptions, the actual results that the Company may achieve may differ materially from any forward-looking statements, which reflect the opinions of the management of the Company only as of the date hereof. Additionally, please make sure to read these important disclosures.

-

 Impact Investing1 week ago
Vernazza Autogru Secures €5M Green Loan to Drive Sustainable Innovation in Heavy Transport
-

 Markets4 days ago
Rice Market Slips Amid USDA Revisions and Quality Concerns
-

 Business2 weeks ago
Legal Process for Dividing Real Estate Inheritance
-

 Fintech13 hours ago
JPMorgan’s Data Fees Shake Fintech: PayPal Takes a Hit


