Markets
Mortgages at Levels Last Seen in June 2001
With mortgage rates now at levels last seen in June 2001, I wonder how many “homeowners” who purchased a home in the past ten-years with a 30Yr mortgage, still have their home equity, above the balance of their mortgages? It could be that most homeowners who purchased their homes in the past ten years can’t sell even if they wanted to, as the proceeds from the sale cannot pay off their mortgages.

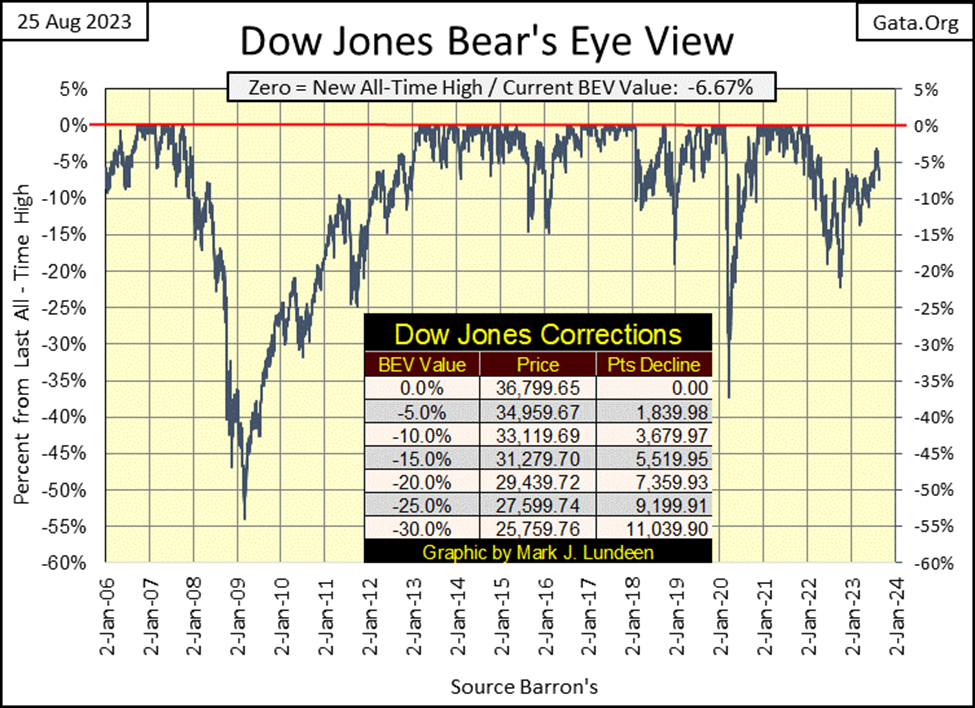
Considering everything, seeing the Dow Jones close the week at a BEV of -6.67%, while not in scoring position, it didn’t close below its BEV -10% line either, so that was pretty good. After fifteen months of the idiots “draining liquidity” from the financial system, and then Powell, Idiot Primate FOMC, speculating this week at Jackson Hole, he may have to raise rates still higher to slay his dragon-of-inflation, had the Dow Jones close below its BEV -10% in its BEV chart, it would be understandable. But it didn’t!
So Mark, are you saying, do you like the stock market? Nope, I really don’t. The stock market still has too much risk, and offers too little reward for assuming those risks. One market metric that has proven historic significance in gauging when returning to the stock market is a safe and profitable risk, is the dividend yield for the Dow Jones.
This week closed with the Dow Jones yielding 2.06%. Before Alan Greenspan became Idiot Primate FOMC in August 1987, a 2.06% yield in the Dow Jones would have triggered massive panic selling. However, since the early 1990s, seeing the Dow Jones yield below 3% became just how things are these days, but not historically normal, as seen in the chart below.
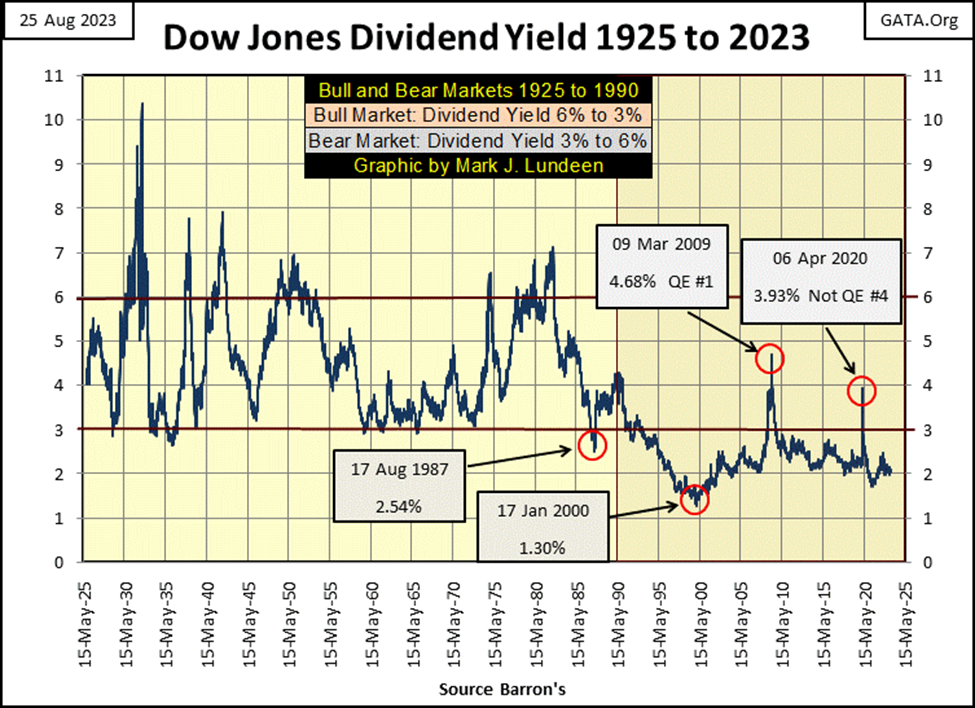
When the Dow Jones is yielding 6%, or more, historically that signifies the worst of the bear market has passed. However, as seen in the chart above, since the early 1990s, any time the Dow Jones is yielding something near, or over 4%, the idiots at the FOMC implement a massive QE to “stabilize market valuations.” Call it what it is; bear-market interruptus
What in the heck should that tell you? Maybe if we look to see what a 6% yield on the Dow Jones would do to its valuation today, we could answer that question. But I’ll give you a heads up; the stock market has been grossly overvalued for decades, and is due for a historic market decline.
A Dow Jones yielding 6%, with this week’s dividend payout of $707.55, would fix the Dow Jones at 11,792. That would be a 68% bear market decline from the Dow Jones’ last all-time high of 36,799.
But who is to say the Dow Jones couldn’t see a 7% dividend yield, after seeing its dividend payout slashed by 50%? Certainly not me! If someday in our grim future that comes to pass, that would take the Dow Jones down to 5,053.92, an 86% bear market decline from the Dow Jones last all-time high.
It could be worse. At the bottom of the Great Depression Bear Market, Mr Bear slashed the Dow Jones’ dividend payout by 77%, while deflating the Dow Jones until it yielded 10.38%. Apply a 77% reduction to the Dow Jones’ dividend payout, and a yield of 10.38%, and the Dow Jones closes at 2,249.43, a 93.88% bear market bottom.
Yeah, a 93.88% bear market bottom is enough to make any Wall-Street bull whimper, and cry out for their mommy! But is that possible? I think it’s accurate saying, that if asked to comment on the possibility of a 93.88% market decline in the Dow Jones, 100% of Wall Street’s economists and “market experts” would say no; that is not possible. Which tells me, I should not rule that possibility out.
But if that is our future, it is years and many “policy initiatives” from the FOMC from now. At the close of this week, it is good to see so many BEV values of the Major Market Indexes in the table below, NOT -60% or -80% from their last all-time highs.
However, I think that day is coming when we do see these indexes’ BEV values deep below where they closed this week. When that day comes, I believe that would be a good time to consider coming back into the stock market, as the risks have been greatly reduced, as the rewards for assuming those risks have risen to the sky.
But one rule on Wall Street will stand firm; on Wall Street they don’t ring a bell at a market top to tell retail investors when to sell, or at a market bottom to tell them when to buy.
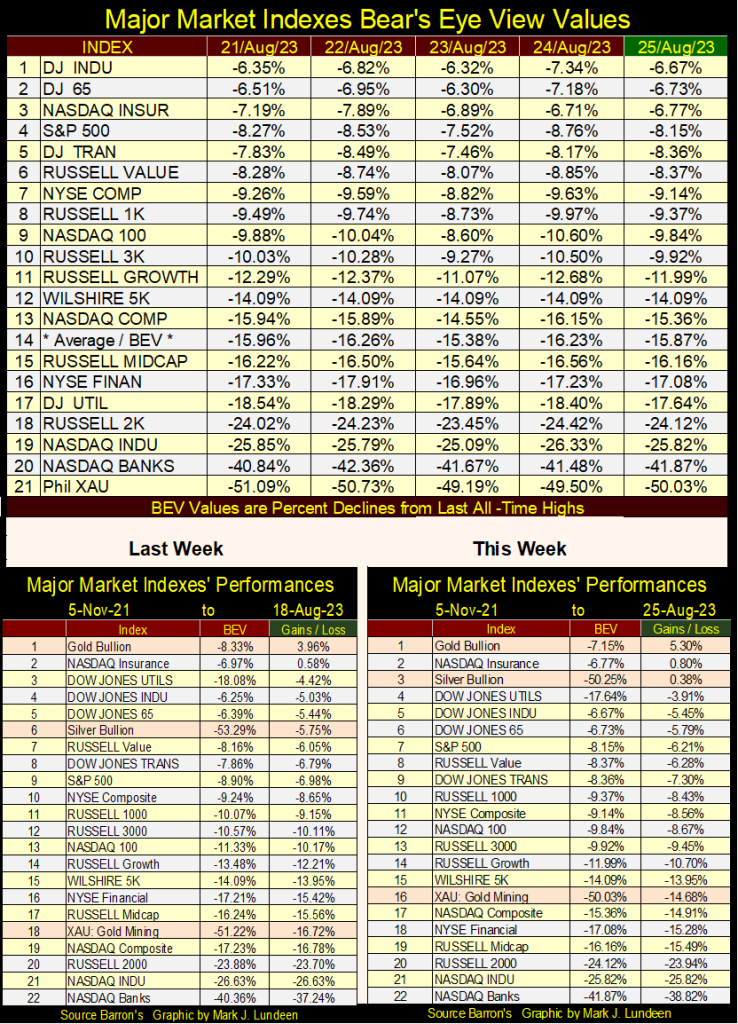
In the performance tables above, precious metal assets had a good week. If a bull market breakout in gold and silver are at hand, we should see the XAU begin making a move upward in this table, eventually rising above gold, now at #1.
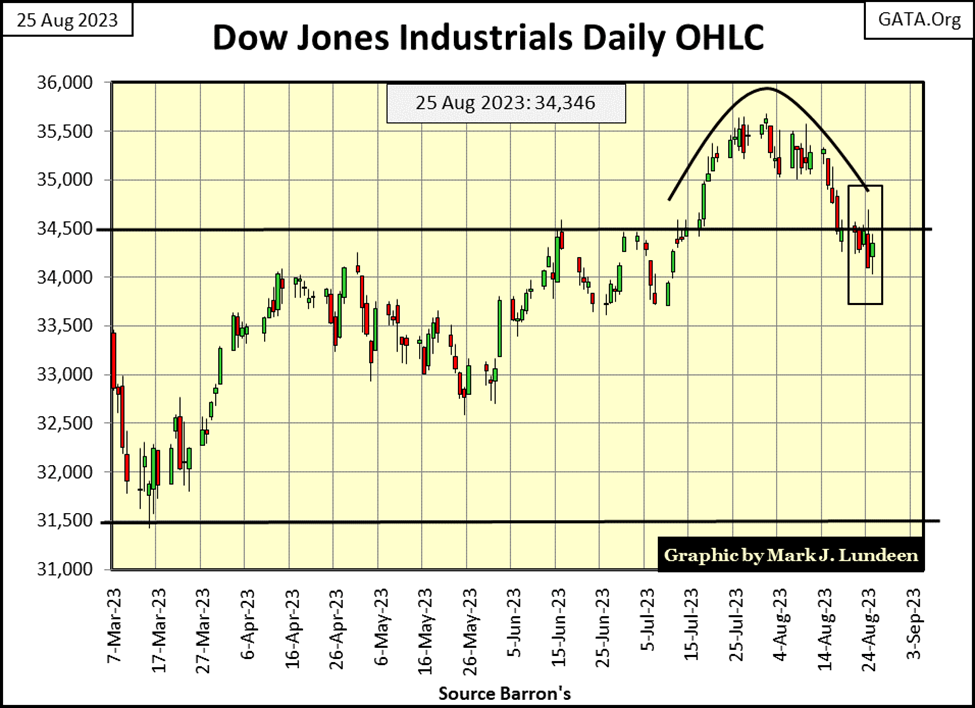
One more chart for the Dow Jones, its daily bar chart. This week saw a lot of churning in the Dow Jones. The big point to take away from this week’s trading is, the failure of the Dow Jones to close above 34,500. What’s next? Seeing Mr Bear claw back the Dow Jones towards its support level at 31,500, maybe.
Looking at the NYSE 52Wk Highs and Lows in the table below, it’s obvious the market is weak. The 52Wk H-L Nets were all positive (more 52Wk Highs than Lows) until August 11th. But in a good advance, we’d see some 52Wk H-L Nets in excess of +300. Something not seen at the NYSE since June 2021, over two years ago.
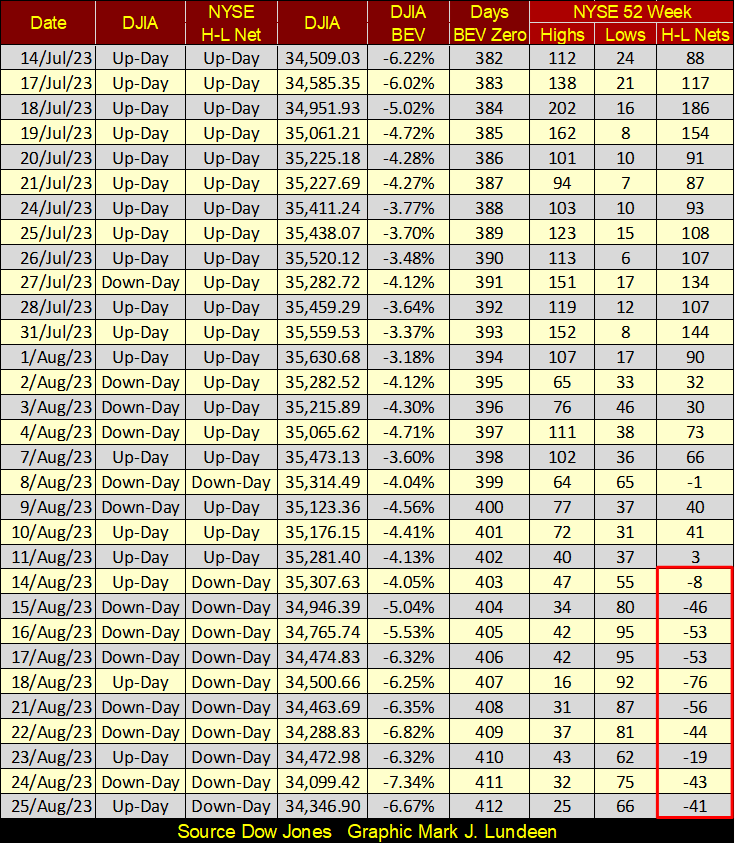
Since August 14th, the 52Wk H-L Nets have all been negative. If things become interesting in the weeks and months to come, NYSE 52Wk H-L Nets of -1,000, and greater can be expected.
Looks like the idiots are ready to jack their Fed Funds Rate up higher than previously believed. Powell, current Idiot Primate FOMC, said in the following article below.
This is how these idiots manage “monetary policy;”
- lower interest rates and bond yields until a huge bubble is inflated somewhere in the economy,
- raise them until they hear the “little piggies” squeal, and then raise rates some more, “if appropriate,” which it always is.
Am I being too cynical? No, I don’t believe I am, as it is as obvious to them, as it is to me how best to control inflation; stop manipulating the Federal Reserve’s balance sheet, fix CinC at current levels for as long as the sun shines, and the grass grows. Oh, one more step in controlling inflation; lock the door to all Federal Reserve Banks, cease all their research and “policy initiatives,” and allow the market to fix prices, bond yields, and interest rates.
The first thing that would happen should that news ever brake; would be all hell breaking loose on Wall Street, as market valuations crashed. The banking system would fail as yields and interest rates soared to historic highs. It would be a very ugly process. At the end of it, we’d once again have the free market regulating itself, as from 1789 to 1913, the free market is what made America great. But freedom isn’t always great for everyone, but it does provide the greatest benefit for the largest percentage of people within the economy freedom is allowed to operate.
The idiots this week pulled $32.02 billion dollars from the financial system. Draining “liquidity” from the market has become a weekly occurrence since May 2022, for the past fifteen months. A major reason the Dow Jones hasn’t seen a new all-time high since January 2022, that NYSE 52Wk Highs have become sparce. Looking at the QT below, it’s amazing the Dow Jones remains less than 10% from its last all-time high.
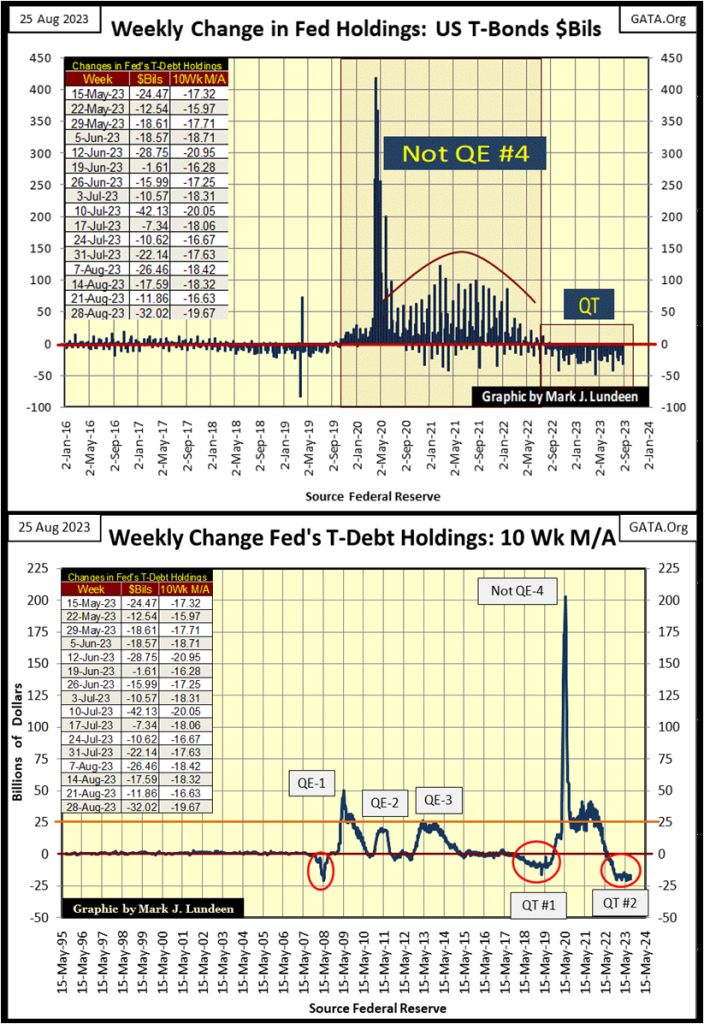
Let me draw your eyes to the “liquidity injections” before 2007 in the chart above. Alan Greenspan, then Idiot Primate FOMC, inflated a huge bubble in the stock market in the late 1990s, with “injections” of “liquidity” as small as $1 or $2 billion a week, many weeks saw “injections” less than that. Same with the 2002-2007, sub-prime mortgage real estate bubble.
But the bubble in sub-prime mortgages produced more financial-toxic waste than Wall Street could digest. The Red Circle in 2008, where the Fed’s Balance Sheet’s holding of US T-Debt dived down towards Zero, was from Doctor Bernanke, then Idiot Primate FOMC, swapping his AAA Rated Treasury-debt, for AAA Rated toxic mortgage waste from the big banks on Wall Street.
But the Federal Reserve’s 2007 balance sheet wasn’t large enough to swap all the toxic waste Wall Street needed to dump on the US dollar’s monetary reserves. The FOMC in early 2008 was running out of T-debt to swap with Wall Street. So came the QE#1, and the monetary mayhem that followed in the chart above.
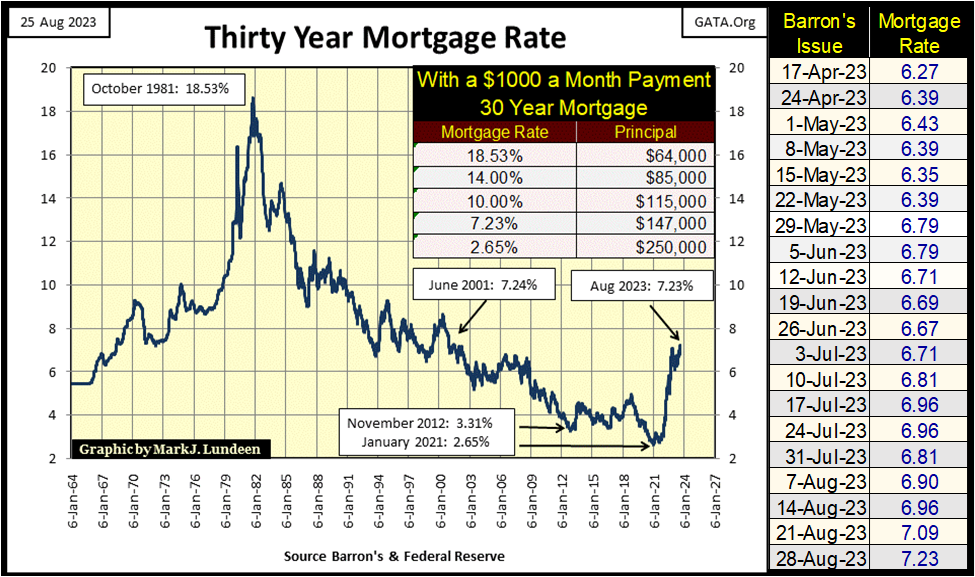
Speaking of mortgages, this week the St. Louis Federal Reserve Bank reported 30Yr mortgage rates increased from last week’s 7.09% to 7.23%. That is quite a jump in mortgage rates, and the latest reason why one doesn’t see many for-sale signs on lawns anymore.
With mortgage rates now at levels last seen in June 2001, I wonder how many “homeowners” who purchased a home in the past ten-years with a 30Yr mortgage, still have their home equity, above the balance of their mortgages? It could be that most homeowners who purchased their homes in the past ten years can’t sell even if they wanted to, as the proceeds from the sale cannot pay off their mortgages.
I saw an article on a major corporation fleeing California, relocating to Texas. I think it was Tesla; I could be wrong on that, but the story was that most of their employees chose to stay in California, and not relocate to Texas.
Who in their right mind would choose to stay in California, and not relocate to Texas with a good job waiting for them? I’ll tell you who; someone who the bank won’t let them move because their home in the San Francisco Bay area is worth several hundred thousand dollars less than the mortgage they took on sometime in the past ten years to buy the damn house. Welcome to serfdom in the 21st century.
Using my model in the chart above / table below; listing how large a 30yr mortgage, at a given mortgage rate, a $1,000 monthly payment could qualify for; this week’s 7.23% rate qualifies for only a $147,000 mortgage. Far from the $248,200 mortgage a $1,000 a month payment qualified for, when mortgage rates were 2.65% in January 2021.
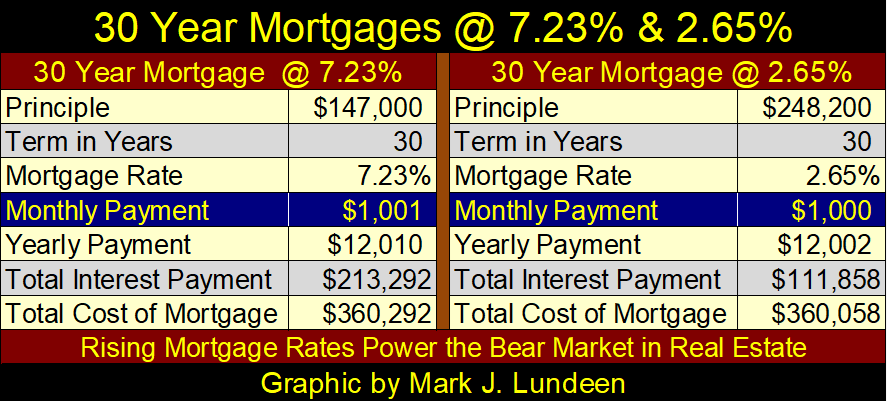
Keeping in mind each parcel of real estate is unique. Location, Location, Location is a primary driver in the real estate market. For example; the market value for an acre of land in the middle of the Nevada desert, or in California’s Malibu-Beach Community. But the table above isn’t looking at real estate, but how large a mortgage a $1,000 monthly payment would qualify for at two different rates.
Doing the math: (147,000 / 248,200)-1 = -0.4077, or a 41% reduction in the pool of credit available to the mortgage market, is the stuff bear markets in real estate are made from. This trend of rising mortgage rates isn’t going to change anytime soon. The math will only get more oppressive as this bear market goes on.
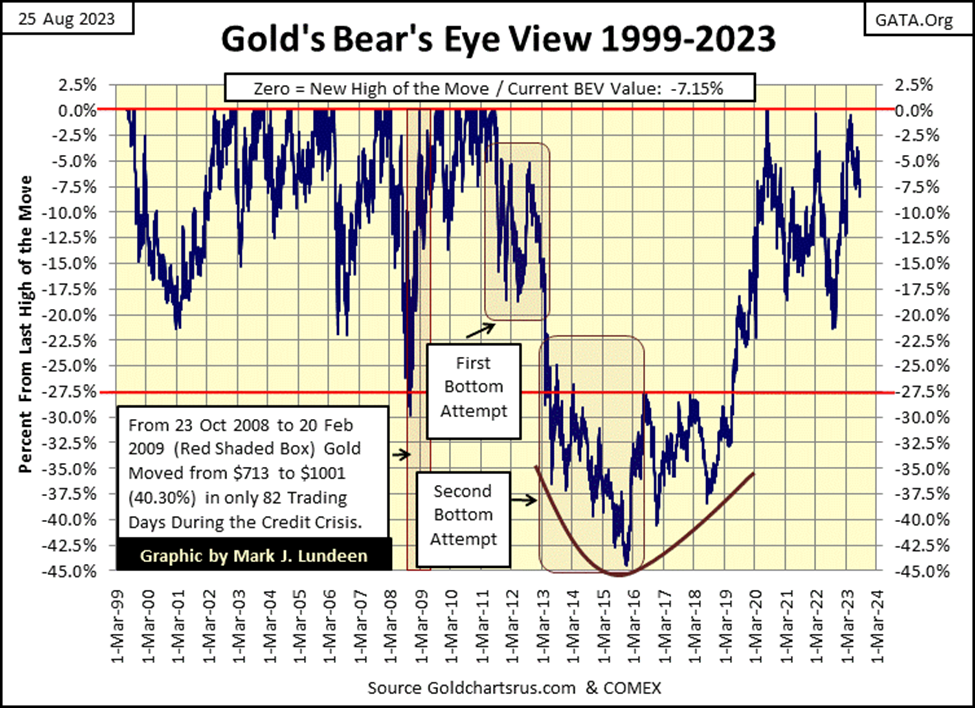
Let’s move on to gold’s BEV chart. This is actually a very positive chart for gold. Note the August 2020 BEV Zero, it was followed by a 17.5% clawback. The March 2022 almost BEV Zero was followed by a 21% claw back. On May 4th of this year, gold came within 0.5% of making a new all-time high in the BEV chart below, and now almost four months later, the bears have failed to claw back even 10% of that advance.
I can’t see into the future. Maybe a month from now gold’s BEV plot below may see a 30% clawback (BEV -30% = $1443). But I don’t believe that is likely to happen, so I’m anticipating this old monetary metal to rise above its last all-time high by a good margin by Christmas of this year.
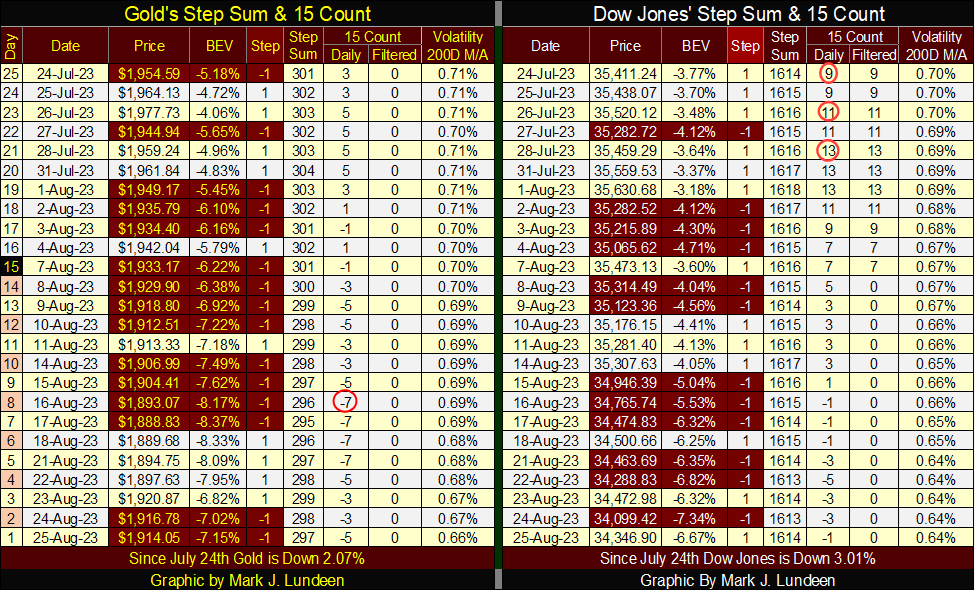
In gold’s step sum table below, it was closing below $1900 late last week and early this week. On Wednesday it then popped up to $1920, and stayed above $1910 for the rest of the week. What is going to happen next week?
I haven’t a clue, hopefully an explosion in volatility, to turn gold’s daily volatility’s 200D M/A back up towards 1%. That is what the gold market needs, a big uptick in volatility. But that most likely isn’t going to happen until we see volatility pick up for the Dow Jones too. What is the daily volatility for the Dow Jones at 0.64%. That happens during major market advances in the Dow Jones, but the Dow Jones hasn’t seen a new all-time high since 04 January 2020. This is strange market action.
__
(Featured image by nattanan23 via Pixabay)
DISCLAIMER: This article was written by a third party contributor and does not reflect the opinion of Born2Invest, its management, staff or its associates. Please review our disclaimer for more information.
This article may include forward-looking statements. These forward-looking statements generally are identified by the words “believe,” “project,” “estimate,” “become,” “plan,” “will,” and similar expressions. These forward-looking statements involve known and unknown risks as well as uncertainties, including those discussed in the following cautionary statements and elsewhere in this article and on this site. Although the Company may believe that its expectations are based on reasonable assumptions, the actual results that the Company may achieve may differ materially from any forward-looking statements, which reflect the opinions of the management of the Company only as of the date hereof. Additionally, please make sure to read these important disclosures.


Blockchain Evolves Toward AI, Finance and Quantum Security
Blockchain is evolving beyond crypto into finance, AI applications, and digital markets, while security and regulation remain challenges. Quantum threats...


The Italian Crowdinvesting Market Faces Sharp Decline in 2026
Italian crowdinvesting market continued to decline in 2026, with fundraising falling 36.8% year-on-year to €164.19 million. Platforms and active campaigns...


Sartorius Stedim Biotech Maintains Growth Momentum in H1 2026
Sartorius Stedim Biotech reported solid H1 2026 results, with revenue reaching €1.527 billion and EBITDA rising to €479 million. Growth...


Bank of Africa Launches BOA MDM Network to Boost Diaspora Investment in Morocco
Bank of Africa launched the BOA MDM Network to channel diaspora remittances into productive investment, aiming to raise their share...


Switzerland’s Medical Cannabis Reform Advances Access, But Barriers Remain
Switzerland’s 2022 medical cannabis reform improved patient access by removing federal approval requirements, but challenges remain. MEDCAN highlights barriers including...
 |
|
 |  |
 |
|
-

 Biotech1 week ago
Emily.AI: Personalized Oxygen Therapy Earns Global AI Recognition
-
 Business3 days ago
The $40 Trillion Trap: Disinflation Is Not Deliverance
-

 Cannabis2 weeks ago
Germany Tightens Cannabis Reimbursement Rules: Approved Medicines Must Come First
-
 Africa9 hours ago
Bank of Africa Launches BOA MDM Network to Boost Diaspora Investment in Morocco