Business
Will NYSE Margin Debt Once Again Make New All-Time Highs
The Dow Jones’ advance remains intact, despite fluctuations. It dipped below the BEV -5% line five times in April but hit new highs in mid-May. The market often oscillates between highs and minor declines. Until it breaks below BEV -5% significantly, the advance is likely ongoing. Major declines could trigger extreme measures like quantitative easing.

With the Dow Jones closing the week with a BEV value of -3.01%, the advance in the Dow Jones remains intact. Note below how the Dow Jones declined below its BEV -5% line, by just a bit, five times in April before it went on to two new BEV Zeros in mid-May. On May 30th, it closed just above its BEV -5% line (BEV -4.75%,) and is once again rising to its BEV 0.00% line (new all-time high line).
As it is, the Dow Jones hasn’t seen a new all-time high since May 17th, but I have faith before this advance concludes, it will see additional BEV Zeros. This is how advances work in a Bear’s Eye View Chart; the market metric being observed oscillates between its BEV 0.00% line (new all-time highs), then down into scoring position (BEV values of -0.01% to -4.99%), and sometimes below that, only to go on to new all-time highs.
Two excellent examples for an advance in the Dow Jones are the Trump, and Not QE#4 rallies seen below. During these rallies, not every day saw a new all-time high (BEV 0% = new all-time high). The majority of the days during these advances closed in scoring position, in the -0.0001% row of the frequency tables below.
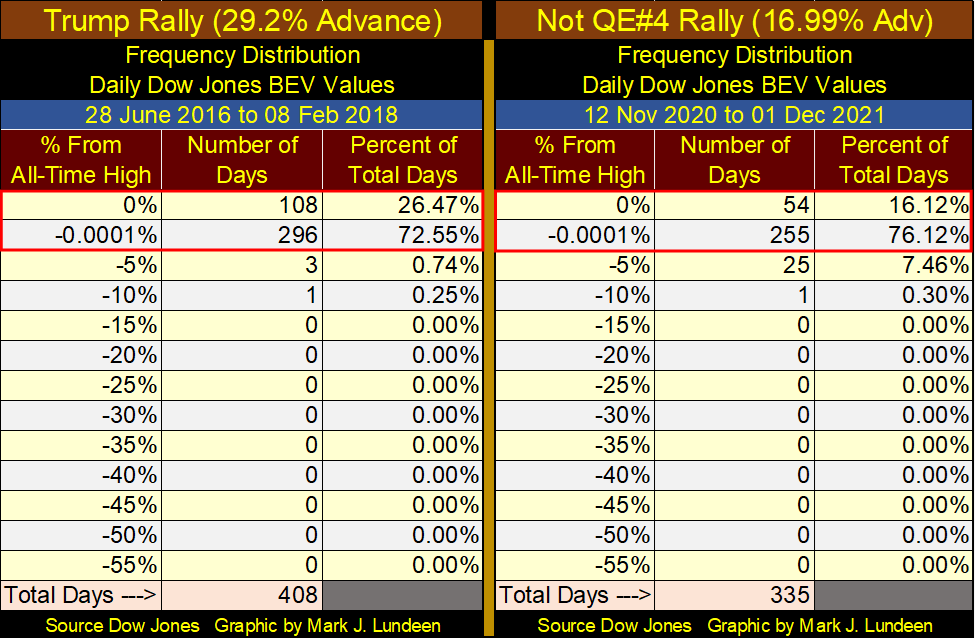
Until the Dow Jones breaks below its BEV -5% line, with authority in its BEV chart, it’s best assuming the advance has not peaked. So, I remain short-term bullish.
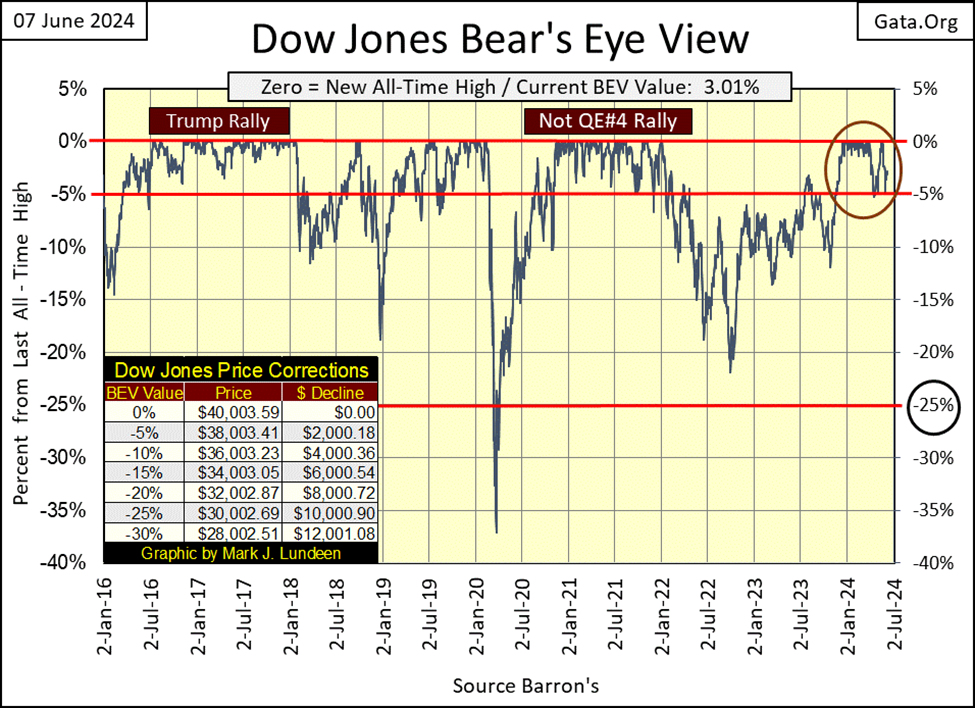
Of course, when the Dow Jones does breaks below its BEV -25% line above, and someday it will, I expect all hell will soon break loose. That or the idiots will once again implement another quantitative easing; their QE#5 to once again “stabilize market valuations,” as they did for the March 2020 Flash Crash seen above.
No one talks about this flash crash anymore, but from a new all-time high on 11 February 2020, the Dow Jones deflated by 37% in only twenty-eight NYSE trading sessions. Since 1885, that has never happened before.
The Great Depression Crash of autumn 1929, took forty-seven NYSE trading sessions for the Dow Jones to deflate as much as it did in February-March 2020. With the corporate bond market also melting down in March 2020, is it surprising the idiots at the FOMC began “injecting” trillions-of-dollars of monetary inflation into the financial system to “stabilize market valuations?”
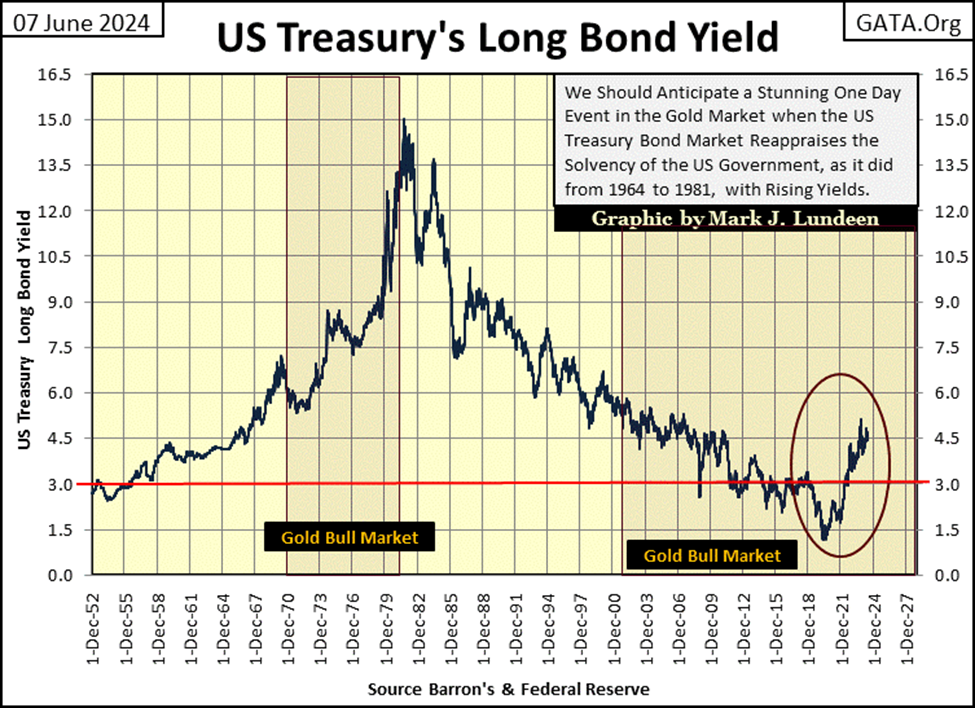
Will the global financial system allow another massive dose, additional trillions-of-dollars of monetary inflation, to be “injected” into the American financial system? I can’t say if it will, or will not. But with T-Bond Yields rising since August 2020, chart below, it’s becoming increasingly difficult for the idiots to do something idiotic, as another QE would certainly be.
So, should the Dow Jones deflate deep below its BEV -60% level in its BEV chart above, something not seen since the Great Depression, you Mark, would have the idiots from the FOMC do nothing to ease the pain from another Great Depression type crash in the markets?
Hey, I’m not the guy who manipulated the financial markets’ money supply, and interest rates since the end of WW1. The people controlling the global central-banking cartel, which includes the US Federal Reserve did that, to their, and their minions’ great gain.
When this historic bubble they’ve inflated begins collapsing, they will use all the means at their disposal to place their blame, and their losses, on to anyone else, but themselves. I’m not going to take responsibility for something I had nothing to do with, and it’s good that I point out who is responsible for this pending disaster before it happens.
Our current situation is the same President Jackson found himself in with the management of the Second Bank of the United States in 1832. Long ago, Mr Bear was going to present his bill to the nation. How big a bill, and to whom this bill was presented to was the issue before President Jackson, see quote below.

The United States of the 1830s had a massive market crash, in real estate and in share prices trading in New York, triggered when President Jackson terminated America’s second central bank. But the bear market did bottom. After the nation took its losses, it moved on.
Terminating the Second Bank of the United States didn’t eliminate all economic woes for the country, but those problems stemming from unchecked inflation from a central bank no longer happened. Many in Congress were upset with President Jackson, as the Second Bank of the United States used to kickback a little monetary inflation their way.
However, whatever the Congress lost in kick-backs and graft, nothing is so beneficial for a nation’s economy than a sound unit-of-currency, and solid balance sheets for its governments, corporations and citizens, something a central bank’s “monetary policy” ultimately make impossible.
History repeats itself. The United States of the 1930s again had a massive market crash for the same reason it had one in the 1830s; “monetary policy” dictated by a central bank. But unlike President Jackson in the 1830s, who hammered a wooded stake into the heart of his vampire, President Roosevelt in the 1930s, let the blood-suckers escape. Now in the 2020s, we once again find ourselves at the brink of a major economic catastrophe.
All this is true, not it matters at the close of this week. Not with 13 of the major market indexes closing the week in scoring position, with some BEV Zeros seen on Wednesday and Thursday.
They really whacked the XAU, down by almost four BEV points this week. But June has another three weeks to go before we see July. Up here in the peanut gallery, where I spend my time watching the markets, there is beer and hot dogs being wagered that the XAU’s BEV value will move above the NASDAQ Banking index in the table below. Something not seen for over a decade, before we see August. I’m feeling frisky, so I put down two hot dogs and a beer on that bet.
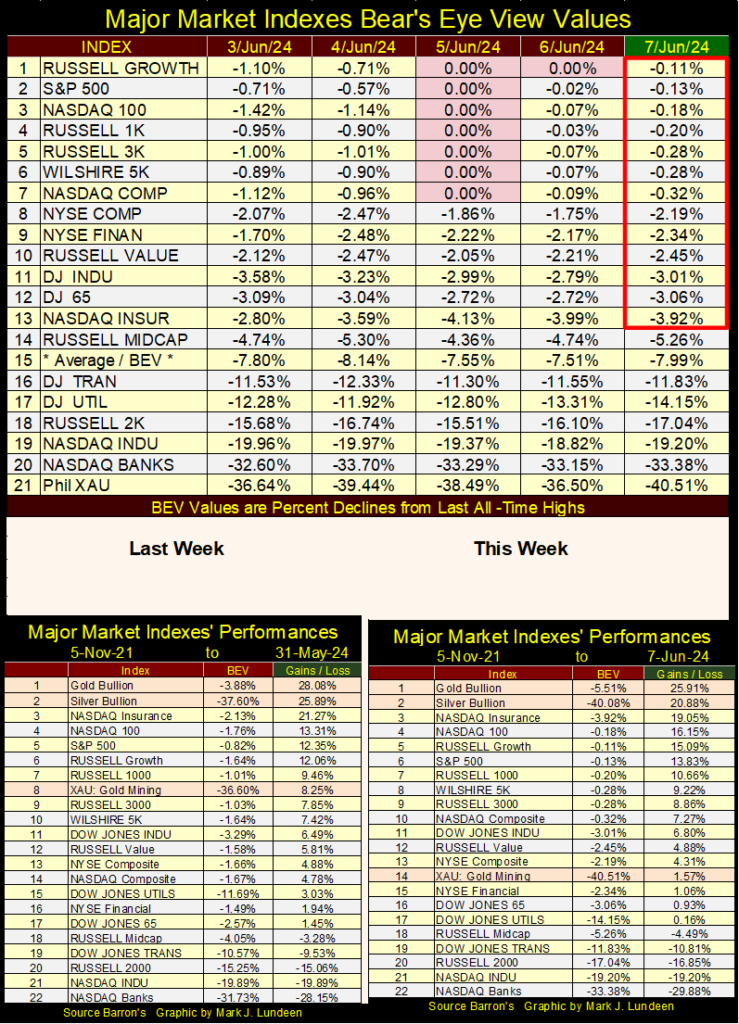
In the performance table above, gold and silver are keeping an iron-hand on their #1&2 spots, but the XAU fell from last week’s #8, to this week’s #14. The gains and losses (green tabs) in these tables are based on the close of 05 November 2021, a major market top from two and a half years ago, and 17 of these indexes are above their highs of November 2021.
A major market top from where the NASDAQ Banking index at the close of this week is down 29.88%. To my way of thinking about the market and economy, seeing the banks perform so poorly is not a good indication for the future.
I haven’t covered NYSE Margin Debt for a while, so let’s look at it in the chart below. Above I mentioned November 2021 was a major market top, which makes sense as margin debt at the NYSE (below) hit its last all-time high in October 2021.
It takes money to make a market go higher, and in the chart below we see money (margin debt) flowing into the market from the Flash Crash bottom of March 2020. This money came from the idiots’ Not QE#4, which, as you can see “stabilized market valuation.”
Since October 2021, margin debt decreased, as did the Dow Jones, but nothing significant. Since then, the Dow Jones was once again making new all-time highs, staring in December 2023, as NYSE margin debt flowed into the stock market.
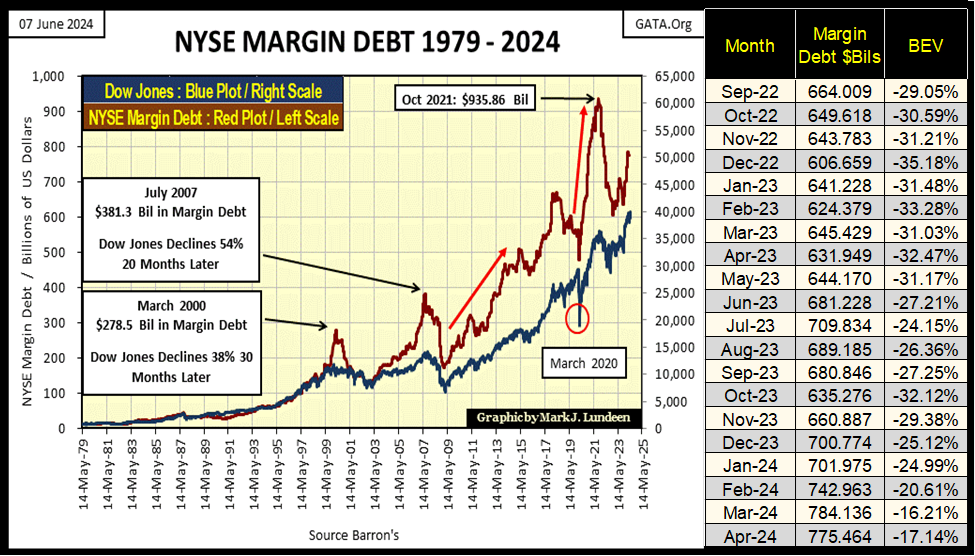
Question? Will NYSE margin debt once again make new all-time highs? If so, what will the Dow Jones do as it does. The answer to the first question is; I don’t know, but wouldn’t be surprised if it did. It’s just a fact, that as the market rises higher, the more willing the public is to leverage their bullish market positions at the top of a market. As far as what the Dow Jones will do; it will go up, until the bubble goes bust.
In May 1979, NYSE margin debt was only $11.13 billion dollars. In April 2024 it was $775.45 billion dollars, down 17.14% below its peak in October 2021. It’s all credit created by the FOMC, but margin debt increases only because investors ask their brokers to open a margin account for them, to purchase shares on margin, which is really stupid at a market top.
Let’s look at the NYSE margin debt plotted above in the BEV chart below, which is looking at margin debt in terms of all-time highs, and percentage claw backs from those all-time highs.
The BEV data seen below is another way of looking at bull and bear markets;
- Bull markets as credit flows into the stock market,
- Bear markets as credit flows from the stock market.
I’ve frequently pointed out our current bull market began in August 1982, the last time the Dow Jones traded below 800, as NYSE margin debt was clawed back by over 25% in the chart below. From this bottom in the Dow Jones and margin debt, the Dow Jones entered its first phase of this massive bull market; the merger and acquisition (M&A) bull market, made famous by the movie Wall Street.
Like all bull markets, credit flowing from the Federal Reserve System propelled market valuations to the sky. Insiders with access to credit flowing from the FOMC, funneled through the big banks on Wall Street, would raid companies trading on the stock market, or hostile takeovers as they were called back then.
These raiders would then plunder these captured companies’ pension funds, and sold anything else that could be quickly liquidated, so everybody who mattered made lots of money. That was until August 1987, when the boom in mergers and acquisition went bust, just when Alan Greenspan arrived as Idiot Primate FOMC, and bailed the banks and insiders out.
For this M&A bubble’s margin debt’s terminal zero (TZ = last all-time high of a bull market) was September 1987, it saw a 40% claw-back in March 1991. Then began the NASDAQ High-Tech bubble, as seen by margin debt beginning to rise towards new all-time highs.
The NASDAQ High-Tech bubble saw its TZ in margin debt on March 2000, from where the stock market’s margin debt was deleveraged by a whopping 53% by August 2002.
This was a big bear market. Some speculators in high tech were committing suicide at this bottom in this bear market, a fact commented on by the talking heads on CNBC. It’s one thing to lose all your money in the market. It’s another thing to lose all your money in the market, and still owe your broker a crushing sum thanks to speculating with margin debt at a market top.
Idiots, being idiots, couldn’t leave the market deleveraged, thus began their bubble of bubbles in the sub-prime mortgage market. A great movie to watch on how that bubble began and ended is The Big Short. After watching that movie (for free with commercials), you will appreciate how dangerous it is to have a bunch of idiots controlling finance. Here is a short, ten-minute clip from the movie.

NYSE margin debt’s TZ for the sub-prime mortgage bubble happened in July 2007. The Dow Jones peaked in October 2007. Both the Dow Jones and margin debt contracted until early 2009, both declining about 55% from their highs of 2007.
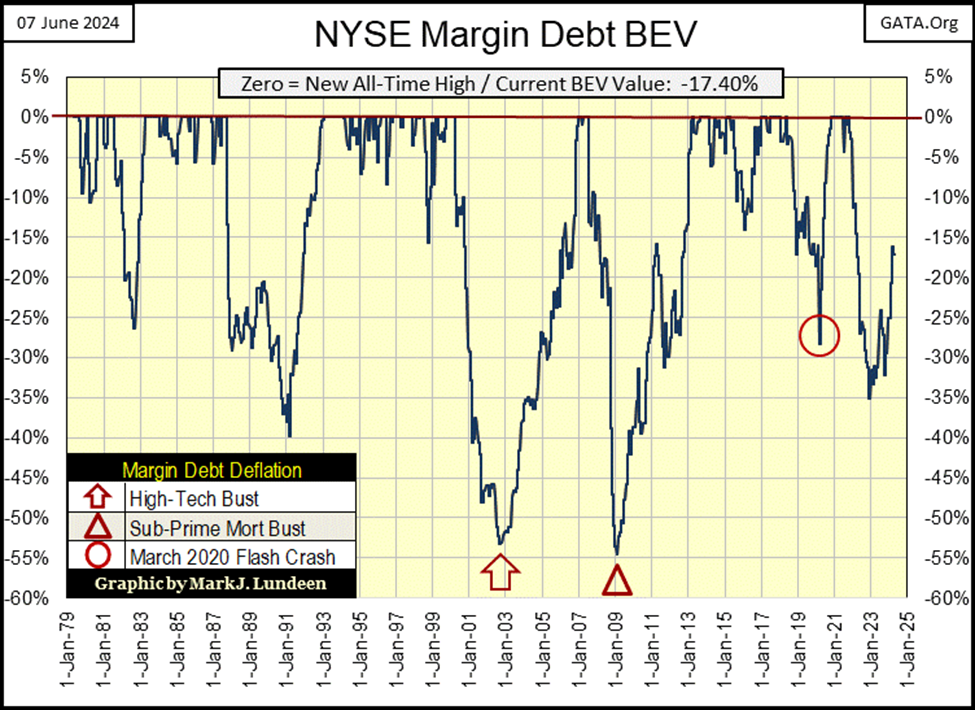
From early 2009, the idiots began three QEs, that took both the Dow Jones and NYSE margin debt to new all-time highs, BEV Zeros in the chart above. We’ve yet to have a serious deflationary market event since March 2009. We almost did in March 2020, but the idiots were quick to “stabilize market valuations” in the stock and debt markets with their Not QE#4.
It’s only a matter of time before Mr Bear once again pays Wall Street a visit, and when he does, I wonder if the old scam of flooding the markets with massive amounts of monetary inflation will work yet another time?
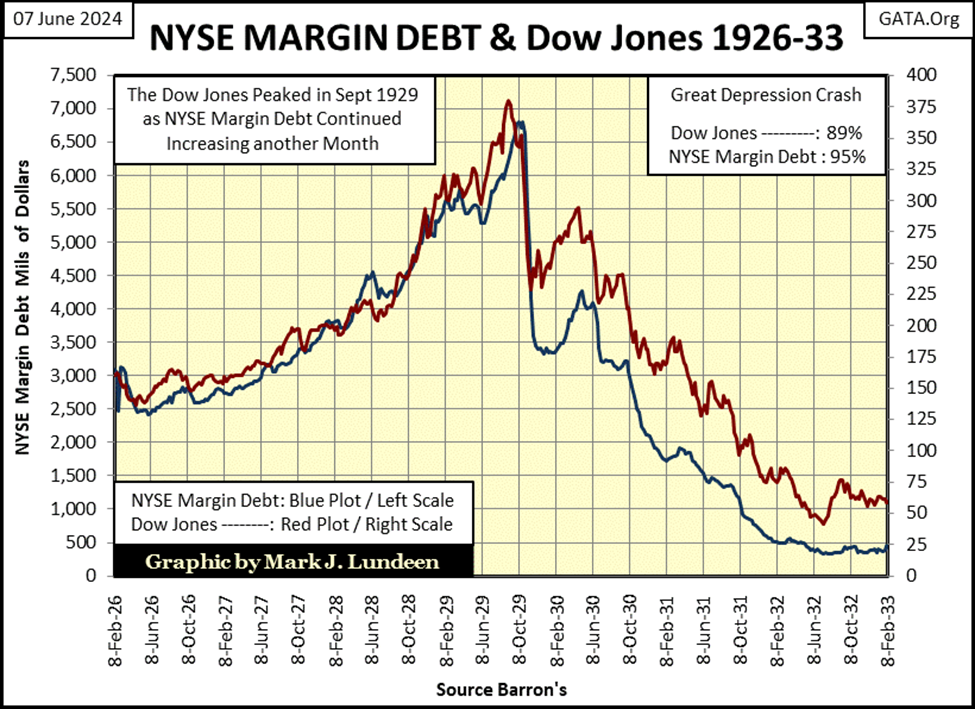
How bad could things get if the idiots can’t “stabilize market valuation” in the pending deflationary market event? I can make a case for the pending bear market to potentially be as bad as the Great Depression market crash. The chart below plots both the Dow Jones (Red Plot / Right Scale) and NYSE Margin Debt (Blue Plot / Left Scale) during the Roaring 1920s bull market, and the Depressing 1930s bear market.
Will this pending bear market be as bad as it was in the 1930s, with the Dow Jones down by 89%, and margin debt by 95%? Dear God, I pray it doesn’t get that bad. But if you’ve watched that movie I recommended; the Big Short, you’ll know how bad things can become, when idiots control a nation’s finances.
It’s not only finance where we find idiots in charge of “policy.” The “best and brightest” in “environmental policy” have been making a big push for electric vehicles to replace gas powered automobiles for personal transportation. The big problem with EVs is, the more the public learns about EVs, the less they want them, and for good reasons.
They can catch on fire, and what a fire they produce! The fire department can hose as much water as they can pump at an EV aflame, but its going to burn until its battery is fully discharge. I was in the Navy; I know what an arc welder looks like. You never look at an electric arc as you can go blind doing so. An EV on fire is a giant electric arc welder, emitting sufficient UV radiation to cause anything within a few yards (meters for my European reader) to also burst into flame.
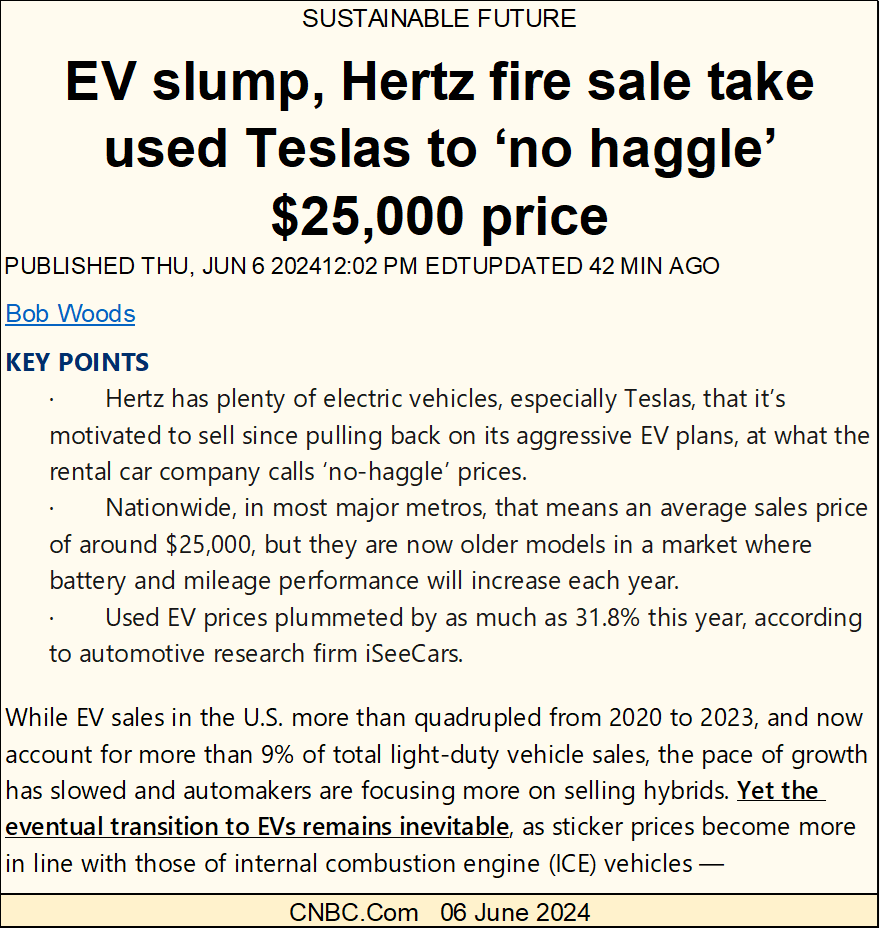
It’s not only that owners of EV may die in a blinding electric arc welder they paid the big bucks for, there are plenty of other damning technical issues too I’m not now going into. But seeing the “policy makers” attempting to force people to buy EVs, is right up with forcing people to take the Covid vaccine. At some point, people just have to say * NO * to these idiots!
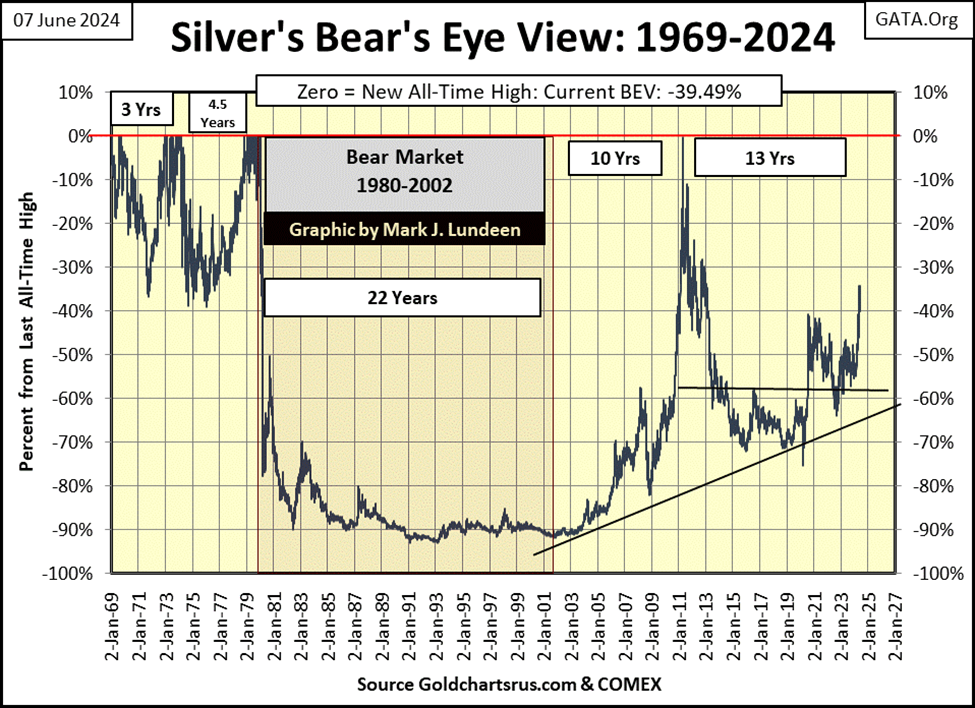
Here is a BEV chart for silver going back to 1970. It’s seldom mentioned, but silver’s last all-time high, its Terminal Zero (TZ) is still January 1980, forty-four years ago! During the 1980 to 2001 precious metals bear market, silver’s valuation deflated by 92%, a market decline greater than the Dow Jones saw in the Great Depression Crash.
Silver came short by pennies in April 2011 of making a new all-time high, (BEV Zero) in the BEV chart below. It then declined by 75% during the March 2020 Flash Crash, for no good reason. But in fits and starts, silver has been advancing for the past four years.
Looking at the chart below, at silver’s gap up in valuation in 2024, I get the feeling silver is making another run into the history books, somewhere far above its last all-time high of $48.70 seen many decades ago. Of course, a few corrections in price along the way should be expected.
But not necessarily. Looking at the chart below, from January 2011, to April 2011, only three months, silver bolted upwards from its BEV -60% line, to just short of its BEV Zero (0% = new all-time high) line, with almost no correction at all. In dollar per ounce terms, from $26.81 on January 25th to $48.54 on April 29th, a gain of $21.73 (81%) in only sixty-seven COMEX trading sessions.
When the bull market in gold and silver once again become hot markets, with significant managed money and public participation, this could happen again, and maybe even larger short-term gains in silver are possible, maybe in gold too.
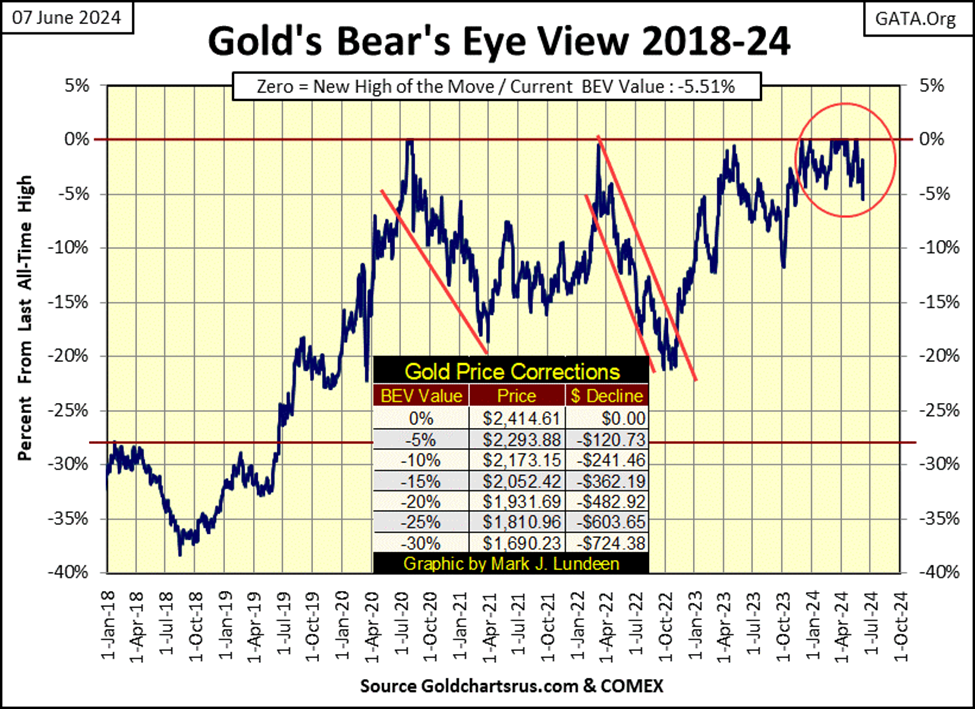
Here is gold’s BEV chart. This week gold closed with a BEV of -5.51%, below scoring position. This is the first time that has happened since 13 November 2023, seven months ago.
I’m not going to worry about that. And for gold, I wouldn’t panic even if gold broke below its BEV -10% line, because I know why something like that would happen; the goons at the COMEX exchange took it down by selling insincere paper promises to deliver many tons of gold that will never exist, or be delivered to the spot market.
When it comes to gold, and silver, I’m keeping an iron hand on the tiller, especially in rough seas.
Looking at gold’s side of the step sum table below, it’s pretty much the same old, same old, except I see gold’s daily volatility’s 200D M/A closing the week at 0.64%. This metric was pushed up to 0.64%, by Friday’s big -3.71% price decline in the price of gold.
This was gold’s first day of extreme volatility, a 3% day since last October. If gold is in a bull market, it will see an increase of these days of extreme volatility, with plenty of +3% days in the mix, as it rises to new all-time highs.
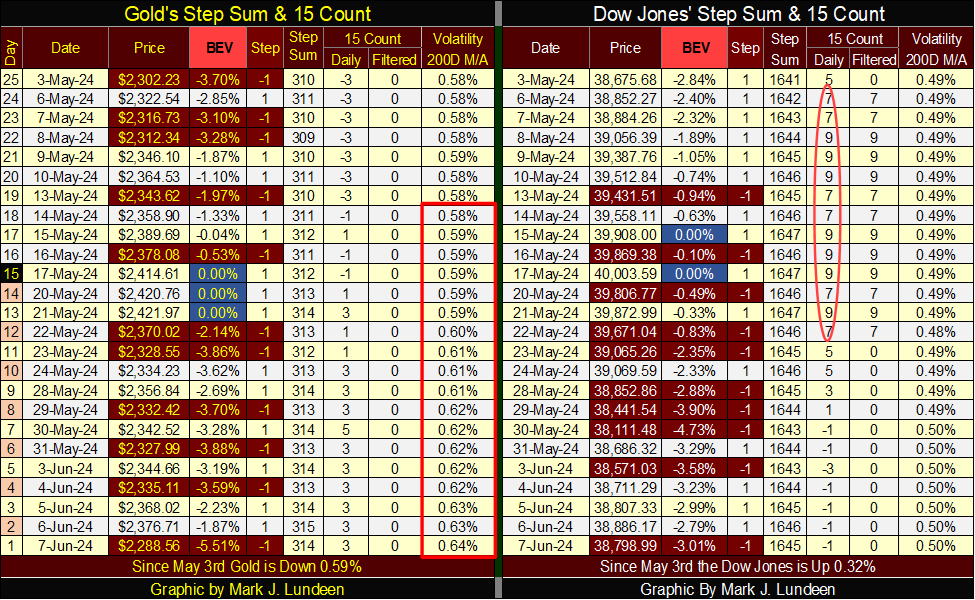
Daily volatility is also creeping up for the Dow Jones, as seen with its daily volatility’s 200D M/A rising up to 0.50%. Looking at this metric of Dow Jones’ daily volatility in the chart below going back to 1960, do you think it will reverse, and continue going down, or will the next big thing in daily volatility be a big increase in this indicator?
- If it continues going down, that would be bullish,
- If it reverses, and begins to rise, that would be bearish.
I believe a turn in the market is seen in the chart below, its daily volatility is no longer going down. If the Dow Jones isn’t at its absolute top, it’s very near it. In other words, this isn’t the time to leverage one’s positions with margin debt. Maybe, now is the time one should begin looking earnestly for reasons to sell, instead of reasons to buy what Wall Street is peddling to the public.
Mac Balkam of Eskay Mining sent me his latest press release, and I very happy to see what Mac has done for the shareholders of Eskay Mining.
Eskay Mining is going to buyout P2 Gold, while P2 Gold’s Management is going to take over operations at Eskay Mining, including an exploration program for 2024, which P2 expects to be pulling cores out of Eskay Mining’s property sometime in July.
I don’t know how this happened, but looking over the management team for P2 Gold, Mac apparently convinced much of the old senior management from Pretium Resources, to manage the combined operations of Eskay Mining, plus P2 Gold. Pretium has since been acquired by Newcrest Mining in a multi-billion-dollar deal. Pretium, before being acquired was a very successful precious-metal mining company, one that shared a border with Eskay Mining’s massive mining claim in British Columbia’s Golden Triangle.
These people know British Columbia’s Golden Triangle’s geology extremely well, as well as the pertinent mining regulators, and other important people in the area. They bring with them credibility and respect in the industry that will benefit Eskay Mining immensely. Obviously, they want another crack at finding something big in the Golden Triangle, this merger with Eskay Mining is giving them that opportunity.
P2 Gold’s CEO and President; Mr. Ovsenek was President and CEO of Pretium Resources Inc before he formed P2 Gold. While CEO of Pretium, he led the development of the high-grade gold Brucejack Mine, which has been in production since 2017. Before that, Mr. Ovsenek was a senior officer at Silver Standard Resources.
Other former senior personal from Pretium at P2 Gold are:
- Grant Bond (CFO),
- Ken McNaughton (CHIEF EXPLORATION OFFICER AND DIRECTOR),
- Michelle Romero (EXECUTIVE VICE PRESIDENT AND DIRECTOR).
I’ll let my readers go to P2 Gold’s management page for a more detailed history of these people. But given the choice of having Eskay Mining’s current CEO and President; Mac Balkam, who has single handedly carried a very heavy load for well over a decade, and is now getting up in years, or having Pretium Resources’ former management team now take over operations at Eskay Mining, I’m all for letting the new guys taking over the day-to-day management of Eskay.
Also, P2 Gold has exposure to an advanced staged gold and copper project in Nevada, that unlike the Rocky Mountains in British Columbia, can be worked on all year long, as well as other projects. So, P2 Gold is coming to the table with some chips of their own, and that is no small thing.
Keep in mind mineral exploration is a high-risk speculation, but one with great potential for profits, if successful. Also, this proposed agreement between Eskay Mining and P2 Gold still requires the support of these companies’ shareholders, and market regulators, which so far neither has happened. With P2 Gold committing to drill Eskay Mining’s property this summer, something I’d assume would be a small program, management of both companies must believe this deal will go through.
As a significant shareholder of Eskay Mining, they have my full support! Seeing Pretium’s former management taking over operation at Eskay Mining is a very exciting development.
So, for someone who desires exposure to gold and silver mining, having 5% to 10% of their position speculating in mineral exploration, with 95% to 90% exposure to mid-tier and major miners of gold and silver, is appropriate. Purchasing Eskay Mining as one’s speculation in mineral exploration is a prudent way to speculate in this exciting sector.
__
(Featured image by Dimitri Karastelev via Unsplash)
DISCLAIMER: This article was written by a third party contributor and does not reflect the opinion of Born2Invest, its management, staff or its associates. Please review our disclaimer for more information.
This article may include forward-looking statements. These forward-looking statements generally are identified by the words “believe,” “project,” “estimate,” “become,” “plan,” “will,” and similar expressions. These forward-looking statements involve known and unknown risks as well as uncertainties, including those discussed in the following cautionary statements and elsewhere in this article and on this site. Although the Company may believe that its expectations are based on reasonable assumptions, the actual results that the Company may achieve may differ materially from any forward-looking statements, which reflect the opinions of the management of the Company only as of the date hereof. Additionally, please make sure to read these important disclosures.


Snoop Dogg Launches Premium Cannabis Seed Line in the US
Snoop Dogg expands his cannabis brand in the US with Sensi Seeds, launching five carefully tested strains after a European...


Crypto Surges Amid Tensions as Bitcoin Tops $74K and Market Sentiment Turns Greedy
Bitcoin surged above $74,000 amid US military tensions, while Ethereum rose strongly past $2,350. Strategy expanded holdings with a $1...


Rice Market Weakens as Global Supplies Rise and Demand Softens
Rice prices fell last week as trends turned downward after failing at resistance, despite earlier war driven gains. Lower US...


Vexuvo Secures €7.4M to Boost Agrivoltaic and Storage Growth
Vexuvo and the Sella Group have reached 7.4 million euros in total funding to support renewable energy growth. A new...


CAR-T Cell Therapy Induces Remarkable Remission in Patient with Multiple Autoimmune Diseases
A 47-year-old woman with three severe autoimmune diseases received CAR-T cell therapy at a German hospital, achieving one-year remission without...
 |
|
 |  |
 |
|
-

 Crypto6 days ago
Bitcoin Leads Crypto Rally as Iran Ceasefire Boosts Markets
-

 Africa2 weeks ago
Casablanca Climbs the Global Financial Ranks
-
 Biotech2 days ago
CAR-T Cell Therapy Induces Remarkable Remission in Patient with Multiple Autoimmune Diseases
-

 Business1 week ago
Dow Jones Rebounds as Markets Shrug Off Iran Conflict