Markets
Oil Surge Sparks Market Turmoil and Shadow Banking Fears
Global markets remain volatile amid the Iran war, with the Strait of Hormuz effectively closed and oil prices surging. Economic strain is emerging as stocks near a breakdown. Precious metals struggle due to a strong dollar and rising yields. Meanwhile, stress in the shadow banking and private equity sector raises fears of another 2008-style crisis.
The war is just about complete. So says President Donald Trump. Then it isn’t. The war against Iran continues to roil markets. Vessels are being hit with a few oil tankers or cargo ships on fire. Apparently, mines have been laid in the straits.
Little is moving through the Straits of Hormuz. Even U.S. escort ships are reluctant to go through the straits. Workarounds are in progress with a focus on the Red Sea. But there are limitations to that as well and they must pass the Houthis.
It’s an oily mess
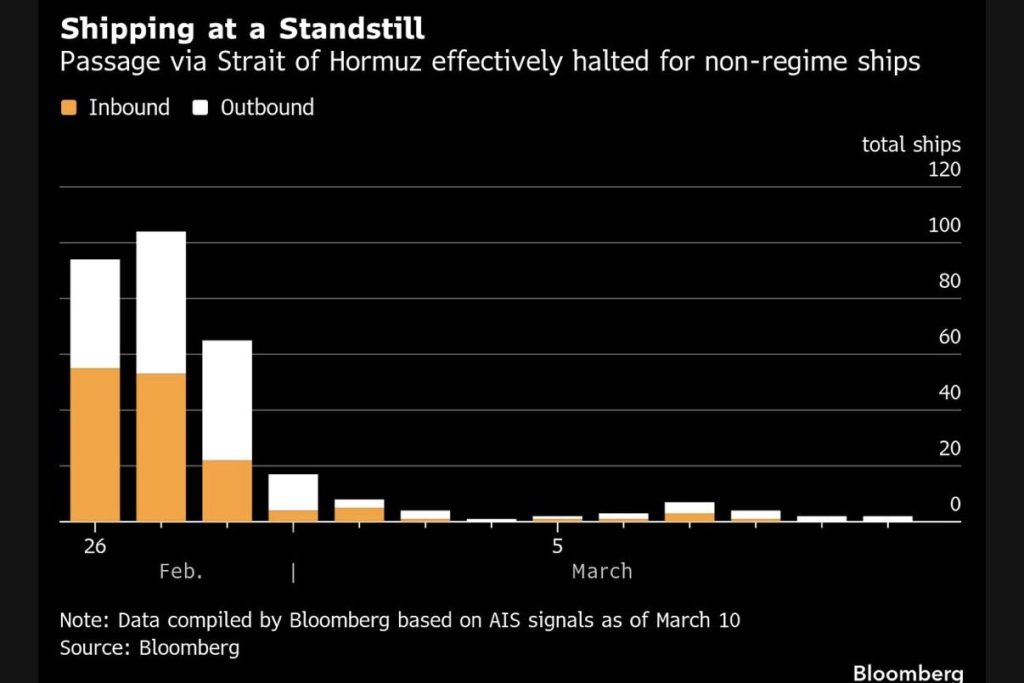
Approximately 20 million barrels of oil a day move through the straits. That’s roughly 20% of global demand. Overlooked is natural gas where also roughly 20% of global demand goes through the straits. Not only do oil and gas go through the straits but also fertilizers, chemicals, metals and minerals, food and agriculture products, and other manufactured products. The Straits of Hormuz are truly a global chokepoint. On a normal day, 100 to 150 ships pass through the straits. Not so much anymore. Oil is the lifeblood of the global economy.
All this puts the Jeffery Epstein scandals far on the back burner.
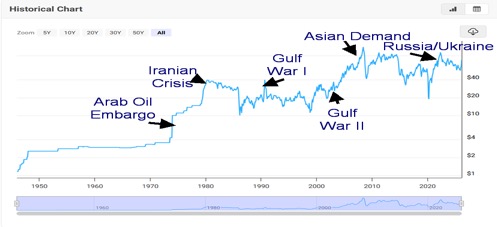
Since 1970 there have been six major oil crises:
- the 1973 Arab oil embargo following the Yom Kippur War
- the 1979 Iranian hostage crisis
- Iraq’s invasion of Kuwait and Gulf War I
- the 2003 invasion of Iraq Gulf War II
- the huge surge in demand from Asia, culminating in the 2008 high, and
- the 2022 Russia/Ukraine war
This is number seven and may prove to be the worst yet. Any prolonged shutdown of the Straits of Hormuz will have profound negative effects on the global economy, no matter how many rush to fill the void. And, lest we forget, global air travel has also been disrupted with hundreds of flights cancelled and many re-routed, given that airports have become targets for bombings.
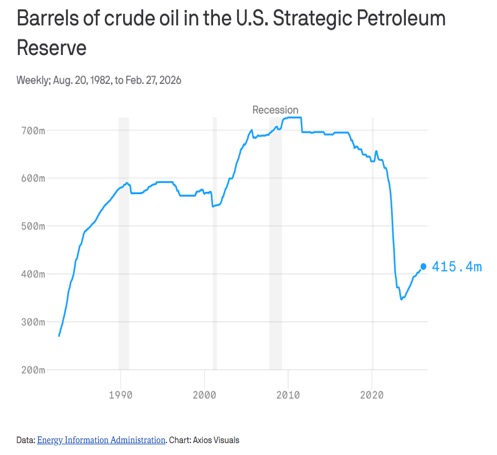
The International Energy Agency (IEA) has announced that 400 million barrels of oil will be released from strategic reserves. To put that in perspective, that is roughly four days’ supply for the world and/or 20 days’ supply for the U.S. Then what? The IEA says the Iran war has created the largest disruption in the history of oil markets. Despite the release of oil from strategic reserves, one can’t help but note that the U.S.’s strategic reserves are at a three-decade low. And, in a surprise move, the U.S. lifted some sanctions on Russia to be able to ship oil sanction-free, at least temporarily.
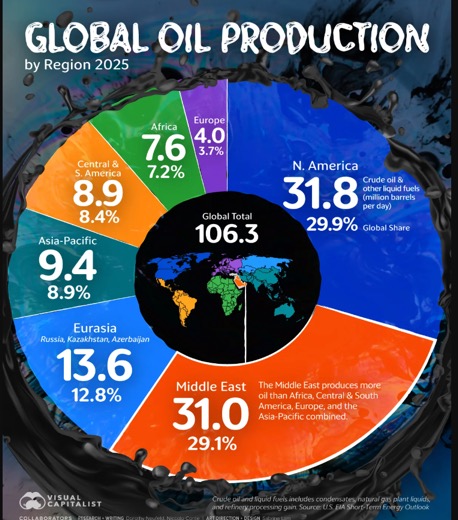
We follow with a series of charts. The first shows the oil crises that have developed since 1970, the second shows how shipments through the Straits of Hormuz have fallen sharply, the third how U.S. strategic reserves have fallen, and fourth global oil production, showing that the Middle East is responsible for 29.1% of global oil production. This is the world’s biggest nightmare as more countries could potentially get ensnared in the conflict on either side.
The outbreak of war has pressured stock prices to go lower, the US$ Index to rise, bond yields to rise, and gold/silver to waver. And need we add that the bombing of oil depots in Tehran has caused a potential environmental disaster? The cost of the war? Between $1 billion and $2 billion per day. The first week was reported to cost $11.5 billion. That cost will be added to the already astronomical U.S. debt.
Oil Crisis 1946–2026
Shipping Through the Straits of Hormuz 2026
Global Oil Production 2025
Private equity/credit jitters
Jamie Dimon, CEO of JPMorgan Chase, in an earnings call warned investors about the hidden risks in private credit. That gave rise to his “cockroach” analogy, whereby if there is one cockroach there are probably a lot more. Specifically, he referred to high-profile bankruptcies of two private credit companies, Tricolor Holdings (a subprime auto lender) and First Brands (an auto parts supplier). JPM lost $171 million on loans to Tricolor. Apparently, the collapse also included fraud.
The shadow banking system is massive. It is estimated to hold some $250 trillion in assets. It is a $2 to $4 trillion market capitalization. It is larger now than the traditional banking system, yet it is largely unregulated. It includes hedge funds, money market funds, private equity firms, and private credit firms. Private credit alone is estimated at $2 trillion. While it handles risks typically associated with banks, it lacks the regulation that governs banks.
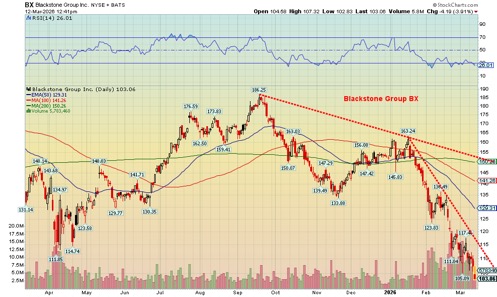
It uses leveraged buyouts (LBOs), growth capital, venture capital, and loans. Some examples of private equity firms include Blackstone Group (BX), KKR & Co (KKR), Apollo Capital Management (APO), Carlyle Group (CG), TPG Inc. (TPG), and Blackrock Inc. (BLK). Examples of private credit companies include Blackstone Private Credit Fund (BGB), Blue Owl Capital (OWL), Bain Capital, Rialto Capital Management and more.
Their big problem is that investors have become nervous and are asking to withdraw their funds. Due to the illiquidity of these firms, they either cap withdrawals or shut them down completely. Who are investors in these companies? Institutions, including pension funds and sovereign wealth funds, endowments, foundations, high net worth investors, family offices, alternative asset managers, and insurance companies. The average investor may be invested in these funds and not even know it, given they are handled through their brokerage firm or bank. Retail investors can access these funds through some private credit ETFs.
The rising problems have translated into huge losses on their stock. Blackstone is down 45% from its all-time high, Carlyle Group down 35%, Apollo down 35%, KKR down 46%, TPG down 44%, and Blackrock down 23%. Blackstone Private Credit is down 57%. But so far, with exceptions, they haven’t yet – with emphasis on “yet” – translated into a potential financial crisis on the scale of the 2008 financial crisis or worse. But could they? Banks themselves are exposed to private equity firms. Nervousness in the sector is growing, particularly given that investors are having trouble getting out of the funds. Could this be our next financial crisis?
Canada job numbers
Employment Change and Unemployment Rate 2021–2026
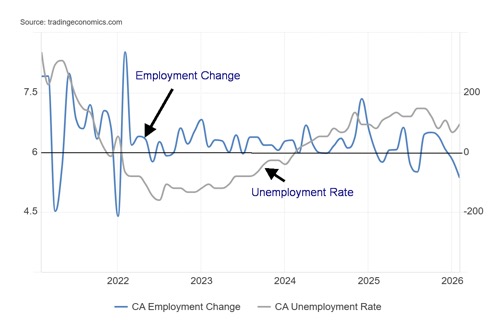
We suppose that after the U.S. reporting negative nonfarm numbers and a rise in unemployment it would have been quite a surprise to see that Canada added jobs. No such luck. The consensus was for a gain of 10,000, but instead Canada suffered a loss of 83,900 in February. The unemployment rate rose to 6.7% from 6.5%. In January, Canada reported a 25,000 loss. It was the biggest fall in jobs since January 2022. Quebec got hit the hardest, down 57,000 jobs. Job losses were spread about. 108,400 full-time jobs were lost while part-time jobs gained 24,500 after falling in January.
The R8 unemployment rate (plus discouraged searchers, waiting groups, portion of involuntary part-timers), the highest level reported by Statistics Canada, rose to 9.5% from 9.1%. Bloomberg described the report as “a pretty bad report.” Given the U.S. is also shedding jobs, this shouldn’t be a surprise, especially since we are also seeing the effects of tariffs. A looming CUSMA which may be killed by the Trump administration is also having a negative impact. The effects of higher oil prices have not even factored in – yet.
This coming week the Bank of Canada makes its interest rate decision, coinciding with the U.S. FOMC. Some are now expecting the BofC to cut rates further. Current expectations are unchanged. Given that the inflationary effect of oil is not yet here, the BofC may decide to stand pat. One piece of good news is that hourly wages grew unexpectedly by 4.2%, well above the expected 3.2%.
Trade uncertainty will continue. The war in Iran won’t be ending anytime soon (we expect). Falling jobs but rising inflation? Stagflation?
Chart of the Week
TSX Materials Index/TSX Financial Index Ratio 2016–2026
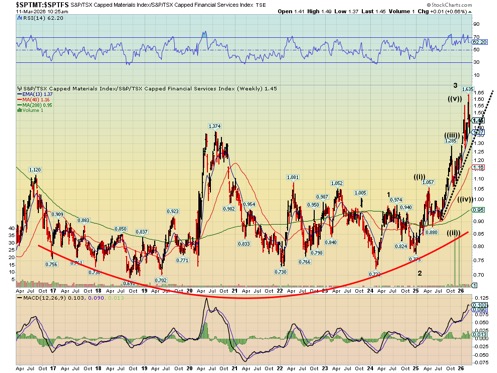
We’ve often shown the Dow Jones/Gold ratio to give us clues as to whether we should be in gold or stocks. Here’s another way of looking at it, with the TSX Capped Materials Index (TMT) as a ratio against the TSX Capped Financial Services Index (TFS). TFS is the largest component in the TSX Composite, followed by the TSX Energy Index (TEN). Together, TFS and TEN constitute about 49% of the index. Industrials (TIN) is in third place at around 13.6% while Materials (TMT) is fourth at about 12.5%. A look at the top 10 companies in the TSX Composite shows that no component of the TMT cracks the top 10.
Yet here we have TMT leading TFS in performance, even as both sub-indices have consistently been making new all-time highs (although not recently). The message is to hold material stocks (golds, metals, along with
fertilizers, chemicals, and forestry). But the heavy leaning is for golds and metals. Nine of the top ten holdings of TMT are gold/silver/metals/streaming companies like Franco Nevada. Only Nutrien (NTR/TSX), a fertilizer company, cracks the top 10.
The chart appears to show that we made an important low in early 2024. Since then, we see three distinct waves to the upside. That suggests to us that the current corrective wave should result in another rise to new highs in favour of material stocks. Naturally, the concentration should be on gold/silver/metals as they dominate the TMT sub-index.
Here is a list of the top ten holdings in the TSX Materials Index:
- Agnico Eagle Mines Limited (AEM) – gold
- Barrick Mining Corporation (ABX) – gold/copper
- Wheaton Precious Metals Corp. (WPM) – streaming
- Franco-Nevada Corporation (FNV) – royalty/streaming
- Kinross Gold Corporation (K) – gold
- Nutrien Ltd. (NTR) – fertilizer
- Pan American Silver Corp. (PAAS) – silver/gold
- Teck Resources Limited (TECK.B) – base metals (copper/zinc)
- Lundin Mining Corporation (LUN) – base metals
- Alamos Gold Inc. (AGI) – gold
Source: www.tmxmoney.com
So far in 2026 the Materials Index is up 12.0% while Financials have fallen 4.6%.
Stocks
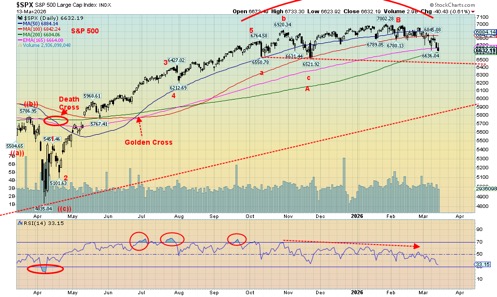
Are the stock markets finally cracking? For the third week in a row, stock markets fell. They are down, but they are not out – yet. Nonetheless, they are now showing concern that a more pronounced drop could be underway. This past week the S&P 500 fell 1.6%, the Dow Jones Industrials (DJI) was off 2.0%, the Dow Jones Transportations (DJT) fell 4.0%, while the NASDAQ dropped 1.3%. The NASDAQ held in as the MAG7 also held in. Two out of the seven, Google and Nvidia, were up on the week. The S&P 400 (Mid) fell 2.0% while the S&P 600 (Small) dropped 2.3%. Bitcoin has been making a bit of a recovery, gaining 4.5% this past week but still down 18.7% on the year.
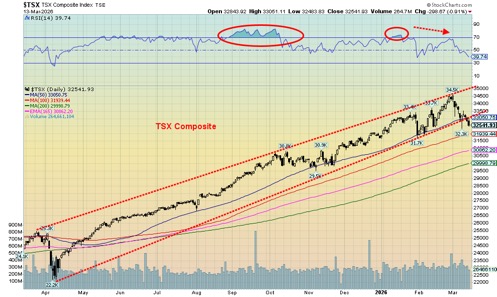
In Canada, the TSX Composite dropped 1.6% as the golds and metals were both down as was most everything else except energy. Energy (TEN) gained 4.8% on the week to new 52-week highs. Of the remaining 13, only Consumer Staples (TCS) and Utilities (TUT) gained on the week. Golds (TGD) led the way down, off 6.2%, but Information Technology (TTK) fell 4.9%. Metals (TGM) fell 4.5%. The TSX Venture Exchange (CDNX) wasn’t spared, falling 3.7%. Both the TSX and the CDNX remain up on the year, but they are fading.
In the EU, the story was no different. The London FTSE fell 0.2%, the EuroNext gained a small 0.6%, the Paris CAC 40 dropped 1.0%, while the German DAX fell 0.6%. Asia fared worse with China’s Shanghai Index (SSEC) off 0.7%, the Tokyo Nikkei Dow (TKN) down 3.2%, Hong Kong’s Hang Seng (HSI) off 1.1%, and India’s Nifty Fifty faring the worst, down 5.3%. The MSCI World Index ex U.S. fell 1.7%.
A key area for the S&P 500 cracked this week because we were under 6,800/6,700. Next up and more important are 6,600 and 6,500, even 6,400. A break of 6,500 could target 6,200 next. Under 6,500 we are breaking the 200-day MA. Only regaining above 6,800 and especially above 6,900 would suggest a low might be in.
The TSX Composite has the same dilemma. A break under 31,700 could spell lower prices ahead. At minimum we need to regain 33,000 to suggest a low. Above 34,000 a low is in. It should be no surprise that markets are reacting negatively to the outbreak of war on Iran. Shut off the global oil supply and things might deteriorate. The outbreak of war is often negative for stocks, but sometimes it has the opposite effect.
When the Russia/Ukraine war broke out in 2022, we saw stock markets fall, ultimately losing over 20%. At a minimum we are probably headed for another 20% + fall. However, there are other potential triggers – for example, a financial meltdown – that could turn this decline into a crash.
Buying the dip may no longer be a wise idea until the dust clears.
Bonds
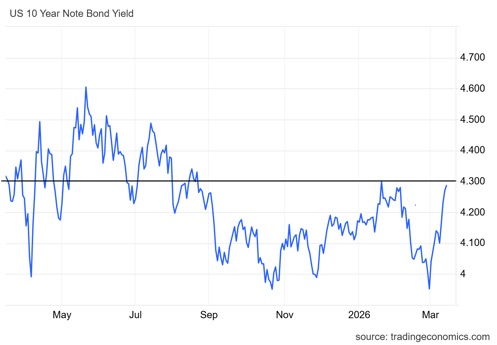
Up, up, and away. Thanks to the potential rise in inflation and the ongoing Iran war, bond yields jumped this past week. The U.S. 10-year Treasury note leaped to 4.29% from 4.15%. In Canada, the 10-year Government of Canada bond (CGB) rose to 3.51% from 3.41%. A rise above 4.30% could trigger further increases towards potential targets up to 4.65%.
Given the U.S.’s massive debt of $38.9 trillion and interest payments that have soared past $1 trillion annually, the U.S. can ill afford another big hike in interest rates. The Fed controls the short end of the market, but the bond market controls the long end. And so far, the long end is not cooperating.
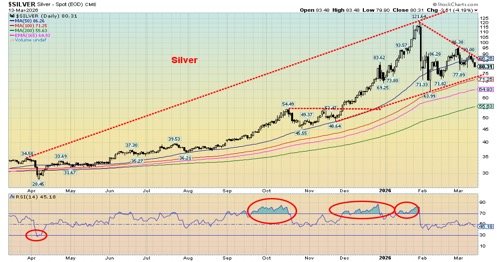
Gold and Silver
With all the turmoil going on, you’d think that gold and silver should be soaring. Except they’re not. A rising US$ Index and rising bond yields are sending gold and silver down, not up. Both are negative for gold and silver prices. With oil prices rising above $100 it underpins global inflationary pressures. That’s going to make things interesting at this week’s FOMC. Will the Fed hike rates, lower rates, or stand pat? The consensus is they will stand pat. But there are pressures for a hike (inflation) and pressures for a lowering (job numbers). In other words, stagflation: rising or sticky inflation coupled with a slowing, even recessionary economy.
This past week gold fell 2.8%, silver dropped 4.4%, and platinum fell 5.5%. Near precious metals saw palladium down 5.8% and copper off 2.8%. The gold stock indices weren’t spared as the Gold Bugs Index (HUI) fell 7.3% while the TSX Gold Index (TGD) dropped 6.2%. Despite the drop, the two remain up on the year: HUI +14.2% and TGD +11.6%. One area that saw a jump thanks to energy prices rising was the CRB Index, which gained 8.7%. The CRB Index is up 21.2% in 2026. Since the outbreak of war, the CRB is up 17%.
The most dramatic reason for gold to falter is the rising US$ Index that gained 1.6% this past week, closing over the key level of 100 (close 100.47). That could signal more price increases ahead. Currencies fell with the euro down 1.7%, the Swiss franc off 1.9%, the pound sterling dropping 1.3%, and the Japanese yen falling to 52-week lows, down 1.2%. A rising US$ Index is not good for gold prices.
What’s key for gold prices coming up is the FOMC meeting on March 17–18. The real surprise would be for a rate cut, which could spur gold prices higher. We’d put greater odds on that happening than a hike in rates. Pressure is still emanating from the White House to cut interest rates. But Warsh doesn’t take over until June 2026. Note Warsh has still not been confirmed by the Senate.
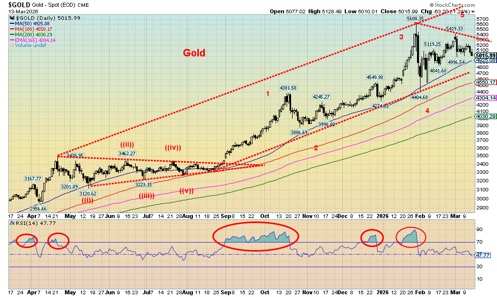
Despite the setback, both gold and silver and the gold stocks remain in bull markets. Gold has some support at $4,900, but what’s key is the recent low near $4,400. Silver has support between $69 to $75, but a drop under $69 suggests a possible test of the major breakout level of $50. That could also spell the end of the bull market. We doubt it could happen, but it can’t be ruled out. To the upside, gold needs to regain $5,325 and silver above $108 to potentially see new highs. Ditto for the gold stocks.
The HUI has support at 765, but a drop under there could target 680. The HUI needs to regain above 934. It’s the same for the TGD; it has support at 880 but under that level a drop to 800 is possible. The TGD needs to regain 1,060 to suggest new highs. Not only have the major gold stock indices been hit but the junior market is also suffering, where many bids seem to have just walked away. Nonetheless, the gold stocks have been undervalued for quite some time and today they are still undervalued.
What’s encouraging is that gold is still above $5,000. But will it last? Gold needs some calming from the US$ Index. In any case, the real focus this week is on the FOMC.
Oil and Gas
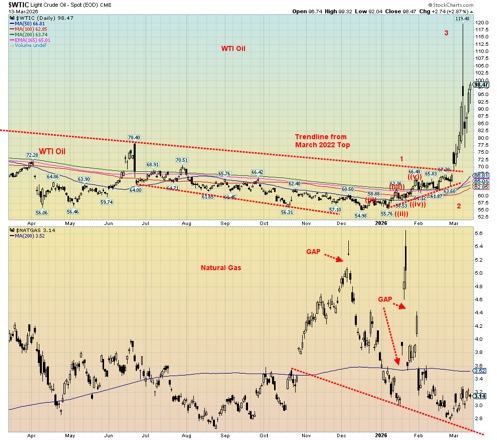
There is very little to say about oil and gas prices, other than one word: “Iran.” The war against Iran has accomplished the one thing that everyone feared but somehow failed to fully realize – that yes, Iran has the capability to shut down the Straits of Hormuz. Oil, natural gas (NG), and now even fertilizers, through nutrients such as sulfur, urea, ammonia, phosphates, and nitrogen, are trapped in the Gulf as well. Many are crucial to global food production. Anywhere from 20% to 40% of these products are effectively trapped. Add in
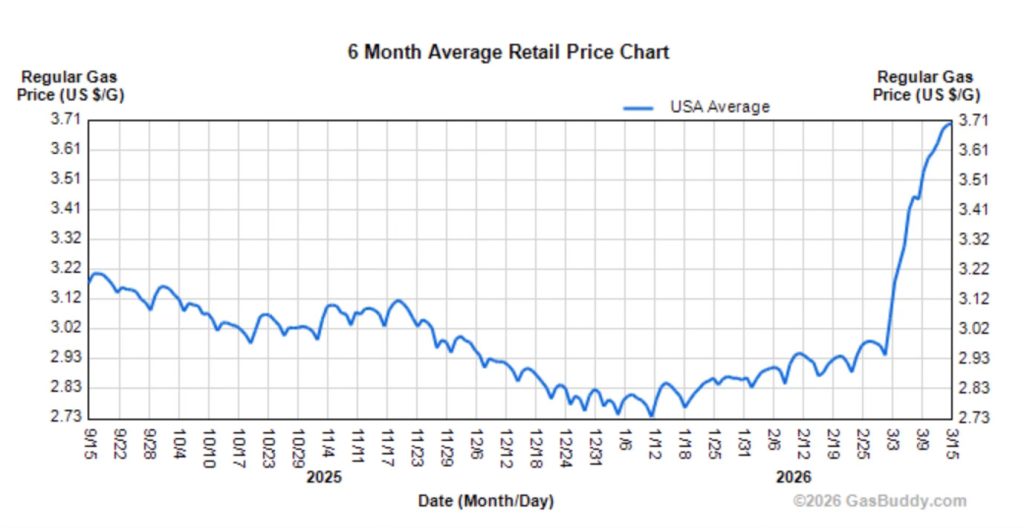
trapped helium, sulfur, LNG, and aluminum – all needed in the production of semiconductors and even AI. Many of these products were destined for Taiwan and South Korea, key manufacturers in the production of semiconductors. It has only been two weeks since the war began and already, we are seeing the negative impacts. Checked gas at the pump’s prices lately? Rising gas prices are shown below. For the record locally we’ve seen gas prices rise from $1.30/litre to $1.65/litre in two weeks.
Rising Gas Prices (U.S.)
WTI oil is up 48%, Brent crude up 43%, EU natural gas up 58%, Henry Hub NG up 9%, aluminum up 9%, sulfur up 23%, and urea up 29% since the war got underway on February 28. Not all commodities are exchange-traded. Worse, we might only be getting underway. After two weeks there are few signs that this will come to an end soon. Instead, more players are getting involved in some manner, including Russia and Ukraine. There are also rumours that China is also involved behind the scenes.
The surrounding Middle East countries (Saudi Arabia, UAE, Qatar, Oman, Kuwait, and Iraq) are involved, whether they want to be or not since many of them host U.S. military bases that are targets. Oil and gas facilities are also targets. Iraq is on both sides: militias in Iraq are favourable towards Iran, but Iraq also has the huge U.S. embassy in Baghdad, along with military bases. Few ships are getting through the Straits of Hormuz, except for some Iranian ships bound for China. But those too may be stopped.
Higher oil prices translate into higher gas prices at the pump. Higher NG prices translate into higher energy costs, affecting everyone from consumers to AI firms who use an unheard-of amount of energy. Diesel costs have soared, translating into higher airplane prices. Many products will also see higher prices because of the war. There was a brief respite when President Trump declared the war was over. It wasn’t, but it sparked a temporary pullback.
On the week, WTI oil rose 9.1%, Brent was up 12.1%, NG fell slightly off 1.3%, while EU NG at the Dutch Hub also pulled back, down 4.1%. The energy stocks didn’t. The ARCA Oil and Gas Index (XOI) rose 3.1% while the TSX Energy Index (TEN) was up 4.8%. Both indices made 52-week highs.
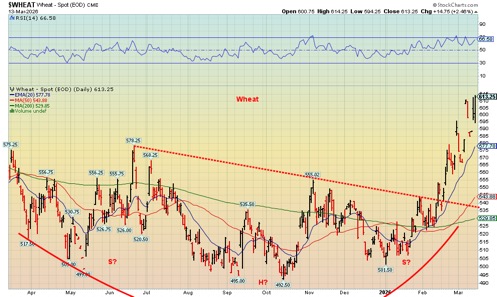
Speaking of fertilizers being blocked in the Gulf, we couldn’t help but notice that wheat prices have soared as a result. Wheat prices have soared out of what appears as a double head and shoulders bottom pattern. Targets could be as high as $625.75, a level almost achieved. If we successfully break through that level, then the next target could be $678. Wheat is up only 3.7% since the war started, but it broke out of the possible double head and shoulders pattern on February 12, 2026. Since the October 2025 low we are up 24.5%. If wheat prices are soaring, food prices are not far behind.
There are no technical signs that this is over. Yes, we are overbought, but that can last as long as this war lasts. Volatility has jumped both to the upside and downside. As long as the war continues this will be the case. Right now, we’d have to break back under $80 to suggest a top might be in. We see no sign that will happen. Be prepared for higher prices and more volatility, depending on the whims of the president who has shown some panic about higher oil and gas prices and a falling stock market.
A temporary shutdown of the Straits of Hormuz – i.e., days, which has already happened – could see WTI oil at $120 to $150 a barrel. That it isn’t there yet doesn’t mean it won’t get there. A prolonged closure is the real nightmare and oil at $150 to $200 a barrel. A dilemma for the Fed.
Source: www.tradingeconomics.com,
Markets and Trends
| % Gains (Losses) Trends | ||||||||
| Close Dec 31/25 | Close Mar 13/26 | Week | YTD | Daily (Short Term) | Weekly (Intermediate) | Monthly (Long Term) | ||
| S&P 500 | 6,845.50 | 6,632.26 | (1.6)% | (3.1)% | down | neutral | up | |
| Dow Jones Industrials | 48,063.29 | 46,559.83 | (2.0)% | (3.1)% | down | neutral | up | |
| Dow Jones Transport | 17,357.19 | 17,731.84 | (4.0)% | 2.2% | down | up | up | |
| NASDAQ | 23,241.99 | 22,105.36 | (1.3)% | (4.9)% | down | neutral | up | |
| S&P/TSX Composite | 31,712.76 | 32,541.93 | (1.6)% | 2.6% | down | up | up | |
| S&P/TSX Venture (CDNX) | 987.74 | 1,018.11 | (3.7)% | 3.1% | down | up | up | |
| S&P 600 (small) | 1,467.76 | 1,485.86 | (2.3)% | 1.2% | up | up (weak) | up | |
| ACWX MSCI World x US | 67.18 | 68.16 | (1.7)% | 1.5% | down | up | up | |
| Bitcoin | 87,576.98 | 71,206.84 | 4.5% | (18.7)% | up | down | neutral | |
| Gold Mining Stock Indices | ||||||||
| Gold Bugs Index (HUI) | 701.49 | 800.86 | (7.3)% | 14.2% | down | up | up | |
| TSX Gold Index (TGD) | 817.76 | 912.75 | (6.2)% | 11.6% | down | up | up | |
| % | ||||||||
| U.S. 10-Year Treasury Bond yield | 4.17% | 4.29% | 3.4% | 2.9% | ||||
| 3.3Cdn. 10-Year Bond CGB yield | 3.44% | 3.51% | 2.9% | 2.0% | ||||
| Recession Watch Spreads | ||||||||
| U.S. 2-year 10-year Treasury spread | 0.69% | 0.55% | (5.2)% | (20.3)% | ||||
| Cdn 2-year 10-year CGB spread | 0.85% | 0.72% | (6.5)% | (15.3)% | ||||
| Currencies | ||||||||
| US$ Index | 98.26 | 100.47 | 1.6% | 2.3% | up | up | down | |
| Canadian $ | 72.87 | 0.7283 | (1.1)% | (0.1)% | down (weak) | up | neutral | |
| Euro | 117.48 | 114.22 | (1.7)% | (2.8)% | down | down | up | |
| Swiss Franc | 126.21 | 126.42 | (1.9)% | 0.2% | down | up | up | |
| British Pound | 134.78 | 132.24 | (1.3)% | (1.9)% | down | down | up | |
| Japanese Yen | 63.83 | 62.64 (new lows) | (1.2)% | (1.9)% | down | down | down | |
| Precious Metals | ||||||||
| Gold | 4,311.97 | 5,022.11 | (2.8)% | 16.5% | neutral | up | up | |
| Silver | 71.16 | 80.60 | (4.4)% | 13.3% | down | up | up | |
| Platinum | 124.81 | 2,024.50 | (5.5)% | (1.1)% | down | up | up | |
| Base Metals | ||||||||
| Palladium | 1,619.50 | 1,561.00 | (5.8)% | (3.6)% | down | up | up | |
| Copper | 5.64 | 5.63 | (2.8)% | (0.2)% | down | up | up | |
| Energy | ||||||||
| WTI Oil | 57.44 | 99.31 | 9.1% | 72.9% | up | up | up | |
| Nat Gas | 3.71 | 3.13 | (1.3)% | (15.6)% | down (weak) | down | neutral | |
__
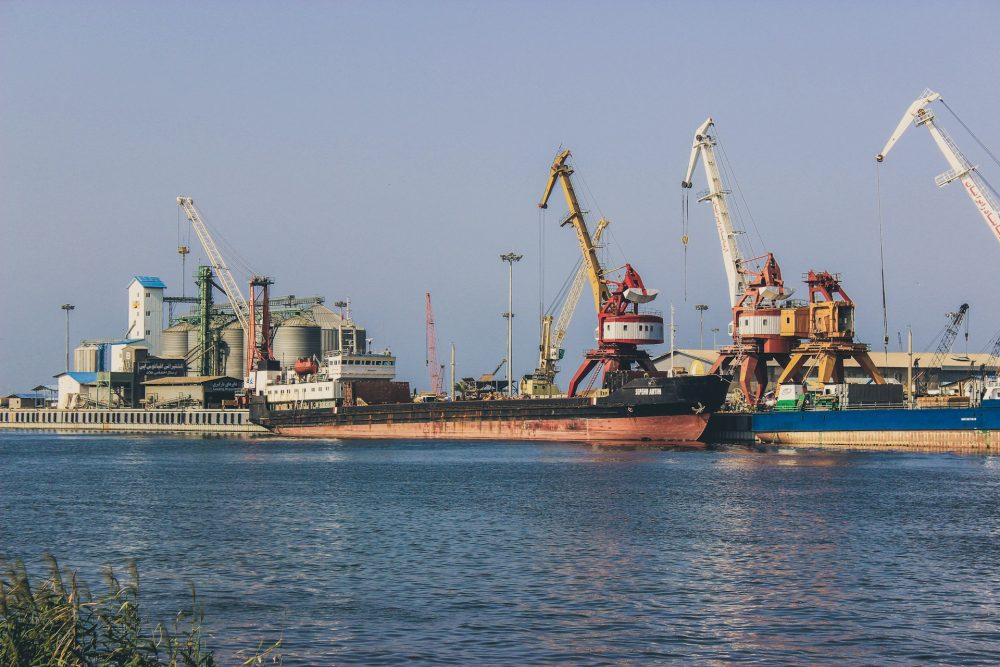
(Featured image by amir Nik via Unsplash)
DISCLAIMER: This article was written by a third party contributor and does not reflect the opinion of Born2Invest, its management, staff or its associates. Please review our disclaimer for more information.
This article may include forward-looking statements. These forward-looking statements generally are identified by the words “believe,” “project,” “estimate,” “become,” “plan,” “will,” and similar expressions, including with regards to potential earnings in the Empire Flippers affiliate program. These forward-looking statements involve known and unknown risks as well as uncertainties, including those discussed in the following cautionary statements and elsewhere in this article and on this site. Although the Company may believe that its expectations are based on reasonable assumptions, the actual results that the Company may achieve may differ materially from any forward-looking statements, which reflect the opinions of the management of the Company only as of the date hereof. Additionally, please make sure to read these important disclosures.
Copyright David Chapman 2026
David Chapman is not a registered advisory service and is not an exempt market dealer (EMD) nor a licensed financial advisor. He does not and cannot give individualised market advice. David Chapman has worked in the financial industry for over 40 years including large financial corporations, banks, and investment dealers. The information in this newsletter is intended only for informational and educational purposes. It should not be construed as an offer, a solicitation of an offer or sale of any security. Every effort is made to provide accurate and complete information.
However, we cannot guarantee that there will be no errors. We make no claims, promises or guarantees about the accuracy, completeness, or adequacy of the contents of this commentary and expressly disclaim liability for errors and omissions in the contents of this commentary. David Chapman will always use his best efforts to ensure the accuracy and timeliness of all information. The reader assumes all risk when trading in securities and David Chapman advises consulting a licensed professional financial advisor or portfolio manager such as Enriched Investing Incorporated before proceeding with any trade or idea presented in this newsletter.
David Chapman may own shares in companies mentioned in this newsletter. Before making an investment, prospective investors should review each security’s offering documents which summarize the objectives, fees, expenses and associated risks. Although Artificial Intelligence (AI) may be deployed from time to time, AI output is monitored and adjusted, if necessary, for accuracy.David Chapman shares his ideas and opinions for informational and educational purposes only and expects the reader to perform due diligence before considering a position in any security. That includes consulting with your own licensed professional financial advisor such as Enriched Investing Incorporated. Performance is not guaranteed, values change frequently, and past performance may not be repeated.


Oil Surge and Iran War Lift Bitcoin as Crypto Sentiment Improves
Bitcoin and crypto markets start the week higher, with Bitcoin near $74,000 after a 3.5 percent gain and strong ETF...


Oil Surge Sparks Market Turmoil and Shadow Banking Fears
Global markets remain volatile amid the Iran war, with the Strait of Hormuz effectively closed and oil prices surging. Economic...


The TopRanked.io Weekly Digest: What’s Hot in Affiliate Marketing [PureVPN Affiliate Program Review]
This week, we're going to look at monetizing American freedom as affiliates. Specifically, we'll be looking at selling VPNs to...


Novo Nordisk: Stable Growth and Defensive Biotech Stock for DACH Investors in 2026
Novo Nordisk A/S (ISIN: DK0062498333) is a stable, growth-oriented biotech stock in 2026, driven by blockbuster drugs Ozempic and Wegovy....

Italian Banks’ Green Asset Ratio Reaches €50 Billion in 2024 Amid Growing Sustainable Lending
Italian banks’ green assets surpassed €50 billion in 2024, raising the Green Asset Ratio (GAR) to 2.8%. Results vary widely...
 |
|
 |  |
 |
|
-

 Crowdfunding1 week ago
Crowdfunding for Mobility: Wheelchair User Seeks Accessible Car
-
 Crypto6 days ago
Crypto Markets React as Trump Signals Iran War End
-

 Fintech2 weeks ago
Pomelo Raises $160 Million to Power AI-Driven Digital Payments Across Latin America
-
 Biotech3 days ago
Novo Nordisk: Stable Growth and Defensive Biotech Stock for DACH Investors in 2026