Markets
Powell’s Jackson Hole Speech Sparks Market Rally Amid Fed Uncertainty and Political Turmoil
At Jackson Hole, Fed Chair Jerome Powell signaled a dovish stance, hinting at possible September rate cuts due to labor market risks, though inflation pressures persist. Markets soared on his remarks. Powell reaffirmed the Fed’s dual mandate and 2% inflation goal. Meanwhile, Trump’s unprecedented attempt to oust Fed Governor Lisa Cook sparked legal and political turmoil.

Last week was the annual Jackson Hole gin-up where the world’s central bankers gather together in the shadow of the Grand Teton Mountains, Wyoming to pontificate on the state of the world’s economics and monetary policy. Oh yes, they might get in a little fly-fishing in as well.
The keynote speaker on August 22nd was Jerome Powell, the Chair of the Board of Governors of the Federal Reserve.
The Federal Reserve is not only the central bank of the U.S., but many consider it to be the central bank of the world (with apologies to the Bank for International Settlements (BIS) the central bank of central banks) because of its influence on global monetary policy. Jerome Powell was appointed by President Donald Trump in 2018 and his mandate was renewed by President Joe Biden in 2022. His term ends in May 2026.
The world sat on edge to hear Powell’s speech at Jackson Hole and whether he would give any clues as to what the Fed might do going forward. His words have been parsed by many. Nonetheless, the highlights of Powell’s speech are worth looking at.
Here are the highlights:
- The outlook is for a more dovish monetary policy, hinting at rate cuts for the September 17–18 FOMC. Powell cites the rising risks to the labour market. However, those are offset by the ongoing risk of rising inflation.
- Labour risks remain. While the market appears to be in balance and the unemployment rate (U3) remains low at 4.2%, there is rising risk for sudden deterioration. The next job numbers release is September 5. What’s not known is the potential impact of the next release, in light of Trump’s firing of the head of the Bureau of Labour Statistics (BLS).
- While inflation has moderated from its post-pandemic high, risks are rising as the full impact of the tariffs has not as yet been seen. The recent PPI numbers showed a larger than expected jump. That in turn could feed into the CPI.
- Powell re-affirmed the Fed’s dual mandate of maximum employment and stable interest rates. He also re-affirmed the Fed inflation target rate of 2%. Currently, the Fed rate is 4.25%–4.50% vs. inflation at 2.7%. The inflation rate remains elevated with upside risk because of the tariffs.
Markets reacted with the stock market soaring, bond yields easing, the US$ Index falling, and gold rising. The odds of a rate cut in September rose to 80%–87%. The speech was widely seen as risk averse and Fed decisions will continue to be data-driven.
Fed Funds Rate vs. Inflation 1950–2025
For years the Fed rate was kept, with exceptions, above the rate of inflation. That was the case throughout the 1950s and 1960s and into the early part of the 1970s. Then came the steep 1974–1975 recession where the Fed rate fell below the rate of inflation. It mostly remained that way until Fed Chair Paul Volcker hiked rates to an unprecedented 19.0% to bring down the huge inflation of the late 1970s.
Throughout the 1980s and 1990s, the Fed rate remained above the rate of inflation. Then came the next crisis in the form of the 2000 dot.com/high-tech peak and crash. Interest rates were lowered sharply. Since then, the Fed rate with exceptions remained below the rate of inflation through the 2008 financial crisis and the 2020 pandemic crisis.
The resultant inflation from the pandemic crisis finally brought the Fed to start hiking interest rates in 2022. The Russian invasion of Ukraine also helped spur the Fed to hike rates as oil prices soared. It wasn’t until 2023 that the Fed rate climbed above the rate of inflation. It has been that way ever since.
A normal curve would have the Fed rate above the inflation, which gives rise to a positive yield curve and favours savers. A negative yield curve is seen when the Fed rate is below the rate of inflation giving rise to a negative rate of return as it favours borrowers. These periods of lower interest rates contributed to the housing bubble in the 2000s and AI and the housing bubble of the 2010s and into the 2020s, especially after the pandemic crisis.
The Grand Tetons at Jackson Hole

The Firing of Lisa Cook
In an unprecedented move, President Trump is attempting to fire Fed Governor Lisa Cook for cause. At no time in the 112-year history of the Federal Reserve has there been an attempt to fire a member of the Board of Governors. The alleged cause? Mortgage fraud. This has not been proven in court. The alleged event took place before Lisa Cook became a Federal Reserve board member.
This story too has been parsed endlessly. Nonetheless, Cook has vowed to sue, arguing Trump lacks the authority as her Senate-confirmed position is protected under the Federal Reserve Act. The Fed supports her actions. Cook’s tenure ends in 2038 as Fed board governors are appointed for terms of 14 years. This dispute is likely headed to the Supreme Court where the court has previously given conflicting signals on the President’s power.
What many are concerned about is not only this attempt to fire Cook but also Trump’s relentless attacks on Fed Chair Jerome Powell to lower interest rates. This raises alarms from economists, lawmakers, and financial analysts. Their concerns are this could have a severe negative impact on inflation and market stability and result in a loss of trust in Fed policymaking. It also breaks with norms of central bank independence and threatens Fed credibility. The move to fire Cook has also been criticized by civil rights groups, given that Cook is black and the first black woman on the Federal Reserve.
A question that has been raised is: is the Fed really independent? This is not the first time there have been feuds between the president and the head of the Federal Reserve. Famous feuds include Harry Truman/Thomas McKay, Lyndon Johnson/William McChesney Martin, Richard Nixon/Arthur Burns, Ronald Reagan/Paul Volcker, George H. W. Bush/Alan Greenspan, and, of course, the latest: Donald Trump/Jerome Powell. But never has there been an attempt to fire a Fed governor.
The Fed is a hybrid institution. It’s public because it is a government agency and the president appoints the governors who are Senate approved. The Federal Reserve banks (there are 12) have their own president and governors. Governors serve for 14 years while the Fed chair serves for four. The Fed pays their salaries, not Congress. They are not to be removed just because the president doesn’t like their policies. The Fed is quasi-private because member banks own shares in the institution. The shares can only be held, not sold, and they are paid interest (currently 6%) on the shares. The member banks have no voting privilege.
When the Fed makes profits, they are remitted to the U.S. Treasury. The Fed is an independent entity created by Congress and can only be dismantled by Congress. Its mandates are set by law. It reports to Congress and provides financial statements. While the Fed is independent in managing its mandates, its structure and appointments are political.
So, is the Fed truly independent? Yes and no. Yes, it can set rates, decide on monetary policy, and influence markets. But it is political by nature as appointments depend on the president. The Fed long ago abandoned sound money. Money used to be backed by gold. The Fed is a central planner for the economy via market interventions (see quantitative easing or QE following the 2008 financial crisis and pandemic) and monetary policy. It is a kind of price-fixing entity as it sets the price of money and can bail out markets when no one else can.
The President wants lower rates. Even Wall Street wants lower rates. Housing bubbles and stock market bubbles are beneficial to the Wall Street banks and lower interest rates help achieve that goal. With over $37 trillion in debt, lower interest rates are beneficial when interest payments have soared past $1 trillion annually. Add in the current budget deficits which are sure to increase the pressure on interest payments.
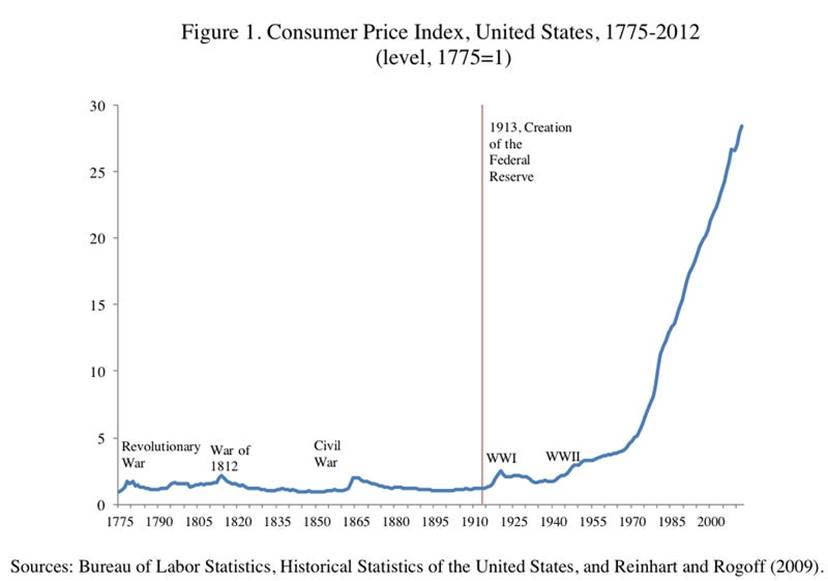
Before the creation of the Federal Reserve in 1913, inflation was low. This was the period of the gold standard when a U.S. dollar was expressed as a weight in gold. The following chart shows the consumer price index (CPI) from 1775–2012. Of course, it is higher today. Inflation really took off after the creation of the Federal Reserve in 1913. Initially impacting inflation were World War I and World War II. The post-war booms unleashed inflation and, when Bretton Woods and the gold standard ended in 1971, inflation became a constant reality.
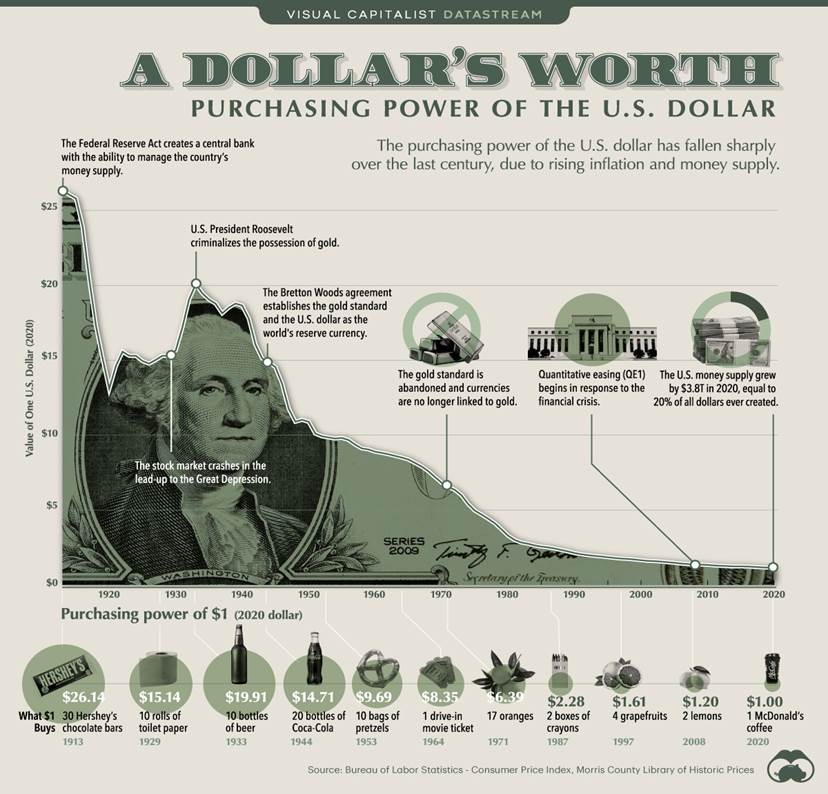
Not only has inflation become a reality, but the purchasing power of the U.S. dollar has collapsed since the creation of the Fed. The value of the currency has collapsed 99%. The following chart shows the long-term decline of the purchasing power of the U.S. dollar. In 1913, a U.S. dollar had the purchasing power of $26 today. The chart shows key events since 1913, including the 1934 criminalizing of possession of gold and, in 1971, the end of Bretton Woods and the gold standard. Add in the period of QE.
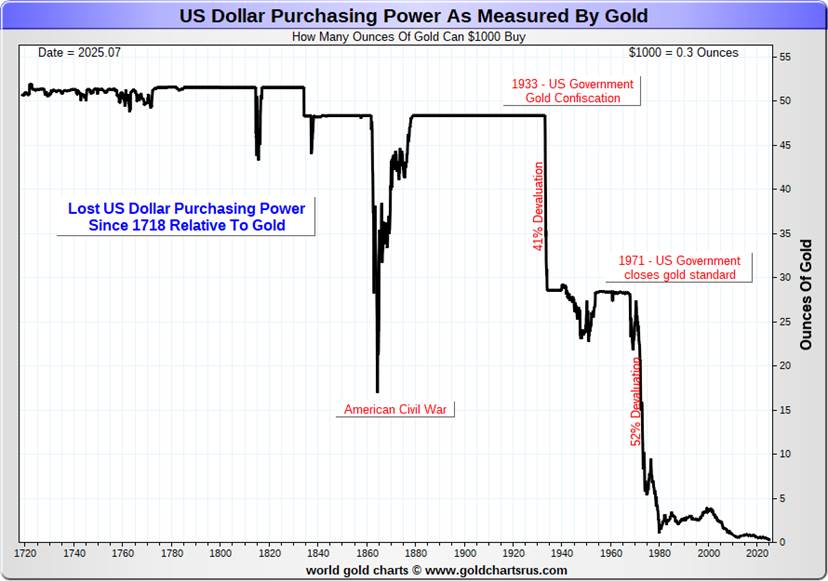
Another way to look at the decline in purchasing power is the U.S. dollar purchasing power as measured by gold. In 1913, $1,000 would purchase 48.4 ounces of gold. Today $1,000 would purchase only 0.3 ounces of gold. That is a real loss of purchasing power.
As the CPI, debt, and money supply rise, so does the price of gold. Since August 1971, when President Nixon ended the gold standard, gold is up 9,714%, U.S. debt is up 9,044%, the CPI is up 791%, and money supply (M1) is up 8,360%. Lowering interest rates below the rate of inflation is a recipe for disaster. Negative real interest rates will be, as some say, rocket fuel for gold. Maybe the President shouldn’t mess with the Federal Reserve, but it won’t stop him from trying to doing so. This case is probably headed to the Supreme Court. The outcome could have real consequences for both the U.S. and world economy.
Currently Stephen Miran, the most recent nominee by Trump, is set for his Senate hearing. Given that the Republicans have a slim majority on the Senate Banking Committee, it is expected that Miran will be confirmed. If, somehow, Cook is forced out and Trump can appoint someone else, Trump appointees will have a majority on the Fed Board of Governors. Given that Cook will launch a lawsuit, this process could be long and messy.
That’s confusion for the market. If Cook loses, the Fed’s independence, such as it is, is most likely gone. Not an assuring outcome. But a note of caution for Trump. As Ambrose Evan-Pritchard of GATA (www.gata.org) noted, Trump might be able to bully the Fed but he can’t bully the bond market. And, we should add, nor gold.
Chart(s) of the Week
U.S. GDP Annual Growth Rate vs. Quarterly Growth Rate 2015–2025
The U.S. Q2 GDP (second estimate) came in up 3.3%, which was somewhat better than expected. Seems that upward revisions to investments and consumer spending offset downward revisions to government spending. But that is just one quarter. Also helping was a roughly 30% plunge in imports that are subtracted from GDP. Exports add; imports subtract.
Average Q1 and Q2 and the growth rate is only 1.4%, thanks to the negative 0.5% growth of Q1. That growth rate is roughly on target for the 1.3% forecast growth for 2025, according to The Economist (www.economist.com). Most other forecasts are in that range as well. Over time the two—quarterly growth rates and annual growth rates—tend to converge.
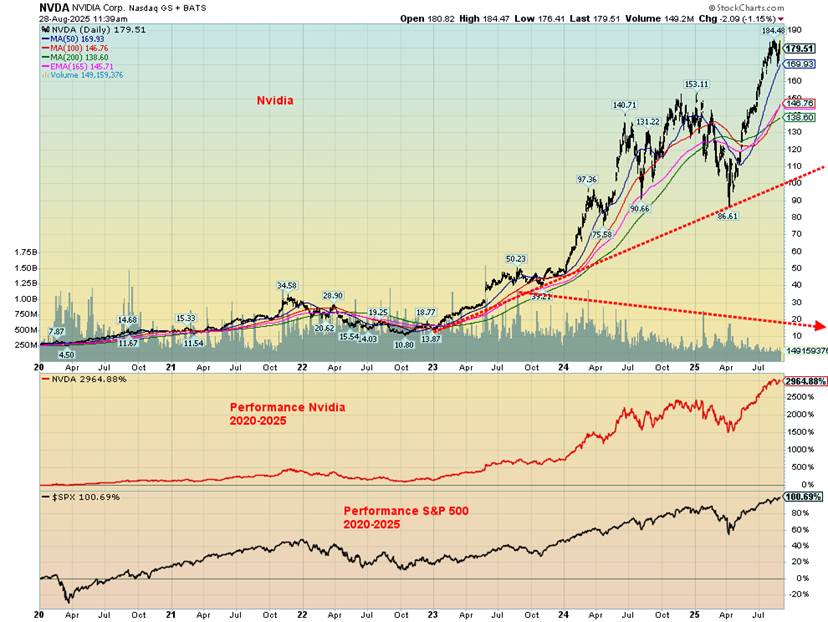
We also saw Nvidia’s profits at the same time and they were a blowout. Add in the note that they are going to spend $2–$3 trillion on data centres over the next five years and one would expect Nvidia to be soaring in the market. Not so fast. Nvidia closed down on the week. Buy the rumour, sell the news? Nvidia has been the best-performing MAG7 stock since 2020. It’s up 2,968% since then. The S&P 500 is up only 100%.
Yes, wouldn’t you have liked to have bought Nvidia at $10.80 in October 2022 or $4.50 in April 2020. Since April 2025 the move has been straight up. But massive negative divergences are emerging and volume has been plunging—none of it a good sign.
Need we add that Nvidia is the largest company in the world, according to Forbes (www.forbes.com), with a market cap of $4.2 trillion. That leaves Nvidia as the fourth largest economy in the world, behind only the U.S. ($30.5 trillion), China ($19.2 trillion), and Germany ($4.7 trillion). India ($4.2 trillion) and Japan ($4.2 trillion) fall to fifth and sixth.
But back to GDP. Nvidia’s results may show up in GDP but they are not noticeable. The main components of GDP are consumer spending, investments, government spending, and imports/exports. When one looks at the array of economic indicators, GDP ranks in importance with inflation and the employment/unemployment rate. These are the big three. A secondary tier includes GDP/capita, productivity growth, and debt/GDP. Go another rank lower and we have trade balance, inequality/poverty, and demographics/labour force. That’s why we put even more emphasis on the main three: inflation, GDP growth, and employment/unemployment.
How does the U.S. GDP projected growth compare to others in the G7? The U.S. has consistently led the G7 in growth and it’s no surprise to find that, in terms of projected growth in 2025 for the G7 countries, the U.S. leads with a projected rise in GDP of 1.3%. Next best is both Canada and the U.K. with projected 2025 growth of 1%. It seems that 2025 is not expected to see strong growth. Even China is slipping. Trade wars do have consequences.
On the surface, the Q2 results look good. But overall, for 2025 we are basically on target. Employment has held up so far. The August job numbers are out on September 5. Currently, the forecast is calling for a nonfarm payroll gain of 50,000 jobs. Watch for revisions. That number is below the 73,000 July nonfarm payrolls. The unemployment rate (U3) is expected to remain steady at 4.2%. But what’s unknown is the impact, if any, the firing of the head of the BLS will have on the numbers. Inflation is down but remains elevated and the most recent PPI indicates a potential rise for inflation. All this could have a negative impact on GDP growth.
It is interesting to note that household debt has jumped $185 billion in Q2. That includes mortgages, lines of credit, credit cards, auto loans, and student loans. But the main cause for the jump in GDP in Q2 was the huge 29.8% decline in imports. Many inventoried up before Trump’s tariffs kicked in. As a result, Q2 imports plunged.
We’d be remiss if we left Canada out. Canada also released its GDP numbers for Q2. Canada’s GDP fell 0.4% in Q2, reversing the 0.5% gain in Q1. Annualized, this is a potential gain of 0.6% for 2025. The Economist has been forecasting a gain of 1%. However, the annualized GDP was negative 1.6%, reflecting the challenges of Trump’s tariffs. That is bringing calls that Canada is falling into a recession.
We should note that the EU is sliding into recession as well in Germany, France, and the U.K. Is the U.S. far behind? Canada’s Q2 drop was largely the result of lower business investment, given the uncertainty surrounding tariffs. Stronger household spending and inventory accumulation helped offset the fall in business investment.
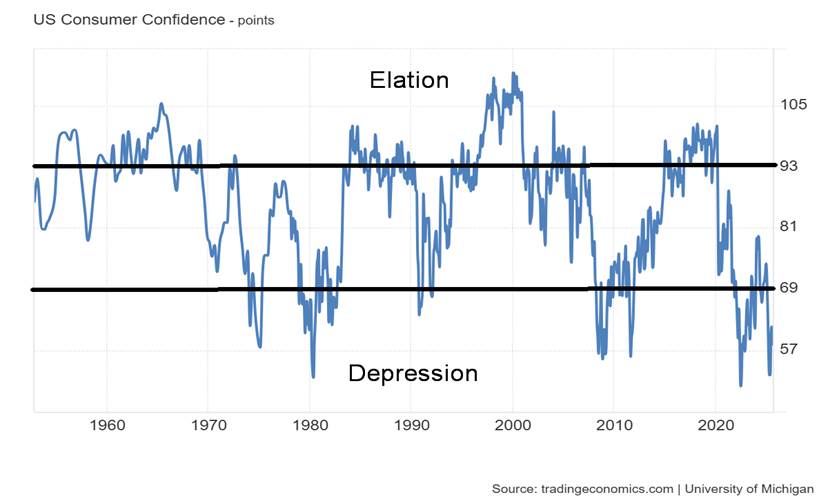
We can’t ignore some other economic numbers that came out this week in the U.S. Personal Income rose 0.4% in July but personal spending rose 0.5%. The U.S. posted a $103.6 billion trade deficit for July ($1.2 trillion annualized). The Chicago PMI came in at 41.5, well below the expected 46 and last month’s 47.1. Those are recessionary numbers. Finally, the Michigan Consumer Sentiment Index for August fell to 58.2, below the expected 58.6 and last month’s 61.7.
The Michigan Consumer Sentiment Index continues to hover in deep recession levels seen during the 1980–1982 recession, the 2008 financial crisis, and the 2020 pandemic. All this and we are not even in an official recession yet. Things are unravelling.
Canada GDP Growth Rate annualized vs. GDP Annual Growth Rate vs. Quarterly Growth Rate 2015–2025
S&P 500
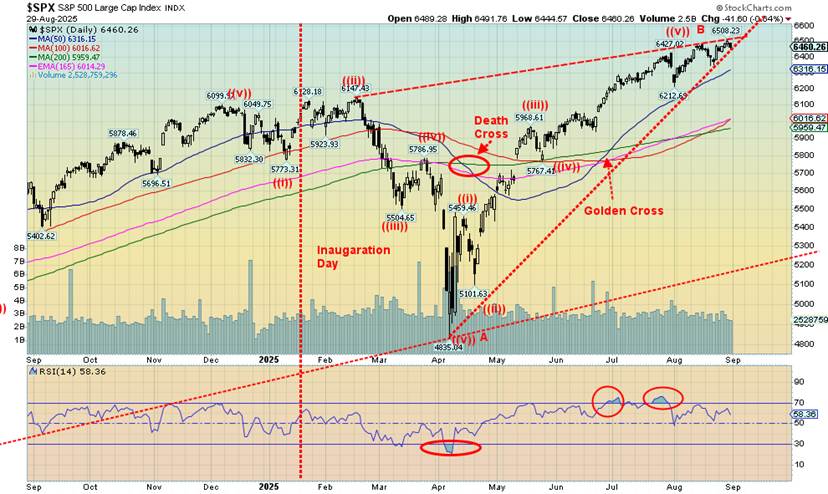
The records keep on falling. Yes, once again the S&P 500 (SPX) made all-time highs. So did the S&P 500 Equal Weight Index, the NY FANG Index, the S&P 100, the AMEX (hard to believe), the Value Line, and the Russell 1000 and 3000. But notably not the NASDAQ nor the Dow Jones Industrials (DJI). A divergence? The question is, when will this market fall? We are moving into September, the worst month of the year followed by crashes and lows into October. So far, nothing has triggered an avalanche of selling, even as divergences multiply. In this environment investors should think about profit-taking, not buying.
On the week, the S&P 500 fell 0.1%, the DJI was down 0.2%, the Dow Jones Transportations (DJT) lost 1.2%, while the NASDAQ was off 0.2%. The S&P 400 (Mid) was off 0.1% while the S&P 600 (Small) dropped 0.4%. Bitcoin was clobbered, down 7.7%. A harbinger? For the SPX, that uptrend line is on the verge of being broken. However, we can’t help but notice what appears to be a huge ascending wedge triangle. Those patterns are bearish. A break of 6,300 would be concerning; a break of 6,200 could be fatal. New highs will end any discussion of the market falling, even as the greed grows.
In Canada, the TSX Composite didn’t hesitate to make new all-time highs, up 0.8%, while the TSX Venture Exchange (CDNX) made 52-week highs, up 3.2%. The CDNX is up 38.8% this year but is still under a high seen in 2021 at 1,113, still off 25%. The TSX was led by Golds (TGD) +3.6%, Metals & Mining (TGM) +2.2%, and Materials (TMT) +2.9%. All three made all-time highs. So did the Financials (TFS) +1.6%. Banks as a safe haven?
Lots of room for the CDNX to move higher.
In the EU, things are faltering a bit as both the U.K. and France are suffering political problems. We even read a story that both might need an IMF bailout. Hard to believe. The London FTSE fell 1.4% after making all-time highs, the EuroNext was down 2.0%, the Paris CAC 40 was off 3.3%, and the German DAX dropped 1.9%. Are the EU markets a harbinger for North America? The MSCI World Index (ex USA) fell 1.2% after making new all-time highs the week before.
Asia was mostly the opposite as China’s Shanghai Index (SSEC) was up 0.8% to new 52-week highs, the Tokyo Nikkei Dow (TKN) was up 0.2% but Hong Kong’s Hang Seng (HSI) faltered, down 1.0%. Most observers are questioning the rise in the SSEC. Caution should be exercised.
We don’t like that huge ascending wedge triangle. If we break to the downside, potential downside targets could be all the way back from where they started at 4,835. But conditions are deteriorating and it’s September.
NYAD Line NYSE
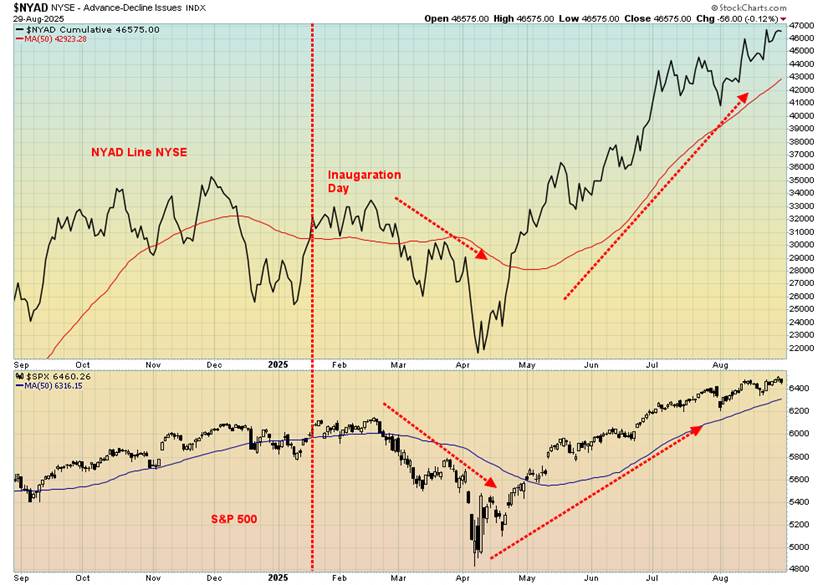
In a seeming anomaly, the NYSE advance/decline line NYAD continues to rise, not giving off the divergences being seen in other indicators. This is mostly because small cap stocks in the NYSE have been outpacing of late. Or, as we call it, it’s the end of the cycle rush, thinking you were left behind. Over at the NASDAQ, the A/D line is lagging and diverging with lower highs vs. the NASDAQ’s higher highs.
Some of the Russell indices are displaying the same. Nonetheless, we thought it worthy to point out. The CNN Fear/Greed Indices are for the most part continuing to register greed and extreme greed, confirming our thoughts that one should not be buying right now. Profit-taking means you won’t go broke.
The Scorecard
It’s no surprise that with gold making a record high close this past week (but not a record high), it continues to be number one since Inauguration Day. The MSCI World Index (x USA) continues right behind. WTI oil continues to be the worst performer, while the US$ Index remains the only other one in negative territory. If gold has done well, then the gold stocks have been golden, with the Gold Bugs Index (HUI) and TSX Gold Index (TGD) both up over 80% in 2025. Yet the sector is still under-owned and undervalued.
Bitcoin NASDAQ
Bitcoin, NASDAQ comparison 2015–2025
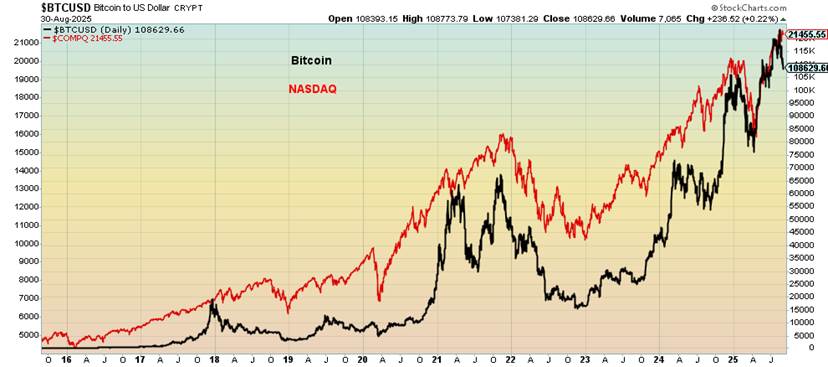
Is it mere coincidence or is this the way it really is? My colleague Mike Ballanger of GGM Advisory (WhatsApp: Miningjunkie) recently noted that Bitcoin and the NASDAQ appear to be perfectly correlated. We thought this worthy of noting. Nothing is perfect, of course, but the ups and downs of the two appear to make them joined at the hip. Yes, there are leads and lags and sometimes one has a steeper rise or fall than the other, but generally the two follow each other.
What’s really interesting is that this past week Bitcoin fell 7.7% while the NASDAQ was down only 0.2%. Bitcoin is now down roughly 13% from its all-time high. The NASDAQ is off only about 2%. On the year, the NASDAQ is up 11.1% vs. 15.4% for Bitcoin. More remarkable is that over that 10-year period Bitcoin is up a whopping 48,662% vs. only 346% for the NASDAQ. Okay, not everything is correlated. Nonetheless, we expect that the NASDAQ will soon follow Bitcoin down.
U.S. Bonds
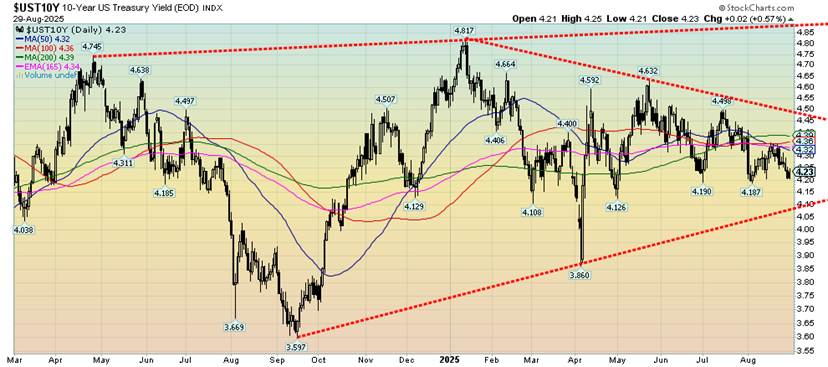
Are bond yields poised to fall sharply? There are, of course, signs of weakening in the U.S. economy, with the President wanting interest rates lower and Fed Chair Jerome Powell hinting at rate cuts at the September FOMC. The U.S. 10-year treasury note closed at 4.23% this past week, down from 4.26% the previous week. Weaker economic numbers and the looming fight between Trump and Lisa Cook helped. Noteworthy, however, is that the 2–10 spread widened further to 61 bp vs. 55 bp the previous week.
That reflects that short rates are falling faster in anticipation of the Fed rate cut. It’s also a sign of an impending recession, even if the numbers are not showing that yet. Bond yield action usually precedes weakening in the economy. There is still room to fall towards 4.10% where the up trendline comes in. Under that level and especially under 4% targets would be much lower towards that September 2024 low of 3.60%. On the other hand, a breakout to the upside above 4.50% could target up to 5.40%. We’ll watch the breakout, up or down.
Gold
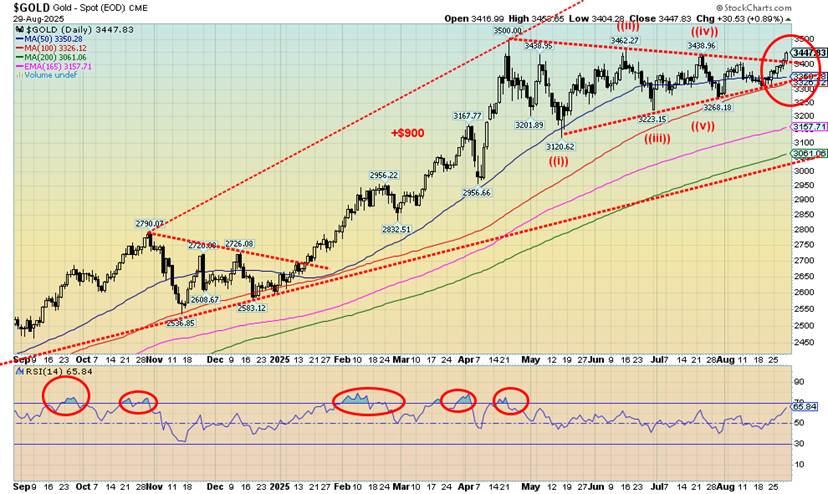
Is this it? The long-awaited breakout for gold? This past week gold made a record high weekly close but remains just under its all-time high of $3,500. Our expectation is that this level could soon fall. The best part is that the breakout projects up to around $3,800. Gold’s seasonals remain positive, although a dip into mid-month would not surprise us. After that, there is usually a sharp rise into October/November before another dip into December. Once the December low (or thereabouts) is in, we usually experience a good rise into February before another correction gets underway.
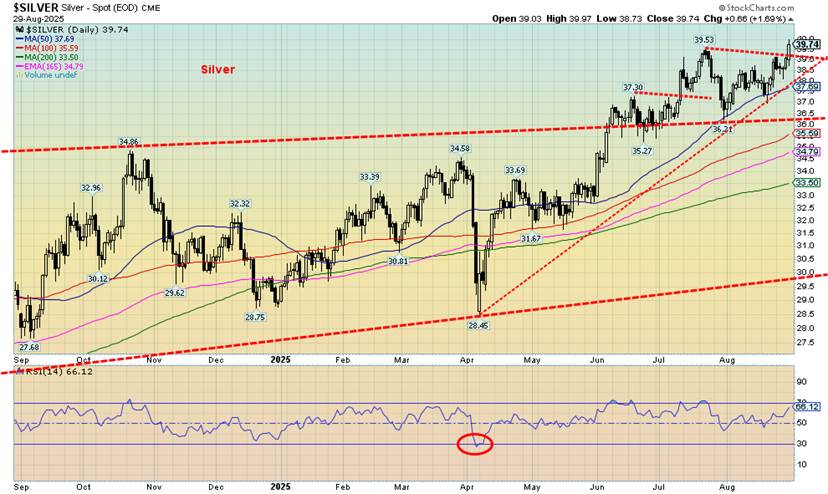
Silver is also breaking out and this week we made new 52-week highs. With this breakout, the projection for silver is a rise to $42.50/$43.00. Meanwhile, the gold stocks just keep on rising, even as the mainstream still appears to not recognize that run-up. As we’ve noted, gold is the safe haven in time of geopolitical stress, domestic political stress, and economic stress. Right now, we have all three in spades. But what it all points to is the potential for a runaway move to the upside. Even the junior stocks are showing more signs of life.
The TSX Venture Exchange (CDNX) made 52-week highs but remains down 75% from its all-time high seen in 2008, while the VanEck Junior Gold Miners (GDXJ) remains down 40% from its all-time high in 2011. Lots of room to move higher. If that happens, the gold bugs will be euphoric.
On the week, gold rose 2.3%, silver was up, as noted, to new 52-week highs, up 2.2%, while platinum gained 1.2%. Of the near precious metals, palladium fell 0.9% while copper was up 1.6%. But the real excitement has been with the gold stocks where the Gold Bugs Index (HUI) rose 5.3% to new 52-week highs and the TSX Gold Index (TGD) was up 3.6% to record highs. Both have been on fire in 2025 with the HUI up 87.1% and the TGD up 81.0%.
Yet they still feel unnoticed against the backdrop of the MAG7, AI, and Bitcoin. But MAGS, which represents the MAG7, is up only 9.9% in 2025 while Bitcoin is up 15.4%. High tech and AI still dazzle, but the gold stocks have been golden.
Gold is moving higher as the geopolitical stresses continue with Russia/Ukraine and Israel/Gaza, along with domestic political stresses, a slowing economy, rate cuts, and the President’s ongoing feuds with the Fed and just about everyone else who disagrees with him. The trouble is, the President is turning those feuds into potentially dictatorial leanings with troops in Washington and constant attacks on the Fed and others who disagree with him.
Meanwhile, the House and Senate (Republican controlled) rubber stamp him, even as court rulings are often against him. That doesn’t seem to bother him as many rulings are going unheeded. Then what?
The currencies were quiet this past week with the US$ Index up a small 0.1%, the euro falling 0.3%, the Swiss franc up 0.2%, the pound sterling off 0.1%, and the Japanese yen flat. The Cdn$ was the star, up 0.8%.
Oil prices were up again on the growing realization that the Russia/Ukraine war is not going to be resolved. Add in the U.S. 50% tariffs on India over their buying oil from Russia. The biggest buyers of Russian oil, besides India, are China and Turkey. WTI oil rose 0.4% this past week although Brent crude fell 0.6%. Natural gas (NG) gained 11.9% although NG at the EU Dutch Hub fell 5.1%. The ARCA Oil & Gas Index (XOI) rose 2.9% while the TSX Energy Index (TEN) was up 1.2%. Energy stocks appear to be anticipating higher prices.
For gold, we await the breakout to new all-time highs above $3,500. It could occur this week. We would absolutely want gold to remain above $3,300. With an RSI at 65 we have lots of room to move higher. The gold stock indices are getting extended, but in a bull market it can remain that way for some time. And we believe that the full attention to gold is still not being given.
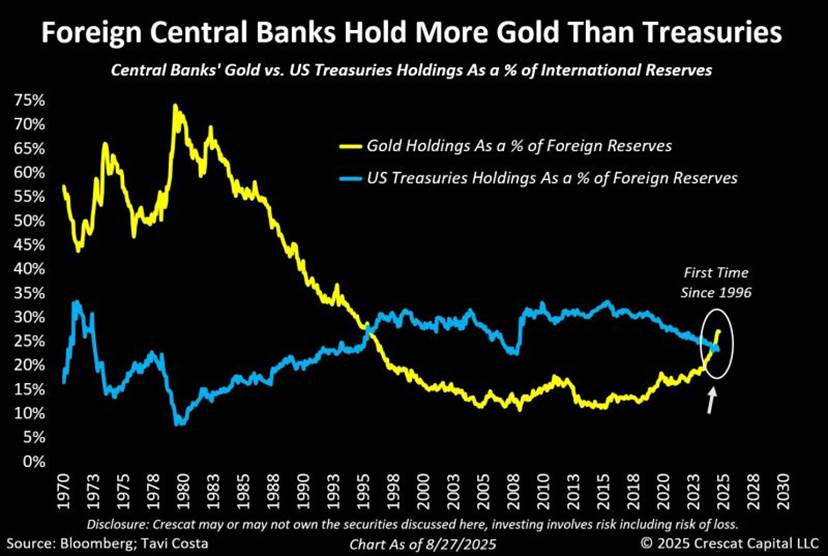
We thought this worthy of noting. For the first time 1996 gold holding as a % of foreign reserves exceeds holdings of U.S. treasuries. During the 1970s this helped lead to a huge rally in gold prices culminating in the 1980 high. For the next twenty years gold prices were mostly repressed as treasuries began to exceed gold holdings as central banks reduced their gold foreign reserves.
That continued until central banks started adding to their gold reserves especially as a result of the 2008 financial crisis. As things deepened buying of gold really got underway following the 2020 pandemic. China and Russia were two primary buyers of gold in order to strengthen the yuan and ruble. This should be carefully heeded.
Copyright David Chapman 2025
Markets & Trends
| % Gains (Losses) Trends | ||||||||
| Close Dec 31/24 | Close Aug 29/25 | Week | YTD | Daily (Short Term) | Weekly (Intermediate) | Monthly (Long Term) | ||
| S&P 500 | 5,881.63 | 6,460.26 (new highs) * | (0.1)% | 9.8% | up | up | up | |
| Dow Jones Industrials | 42,544.22 | 45,544.48 | (0.2)% | 7.1% | up | up | up | |
| Dow Jones Transport | 16,030.66 | 15,904.55 | (1.2)% | 0.1% | neutral | neutral | up | |
| NASDAQ | 19,310.79 | 21,455.55 | (0.2)% | 11.1% | up | up | up | |
| S&P/TSX Composite | 24,796.40 | 28,564.45 (new highs) * | 0.8% | 15.5% | up | up | up | |
| S&P/TSX Venture (CDNX) | 597.87 | 829.57 (new highs) | 3.2% | 38.7% | up | up | up | |
| S&P 600 (small) | 1,408.17 | 1,437.77 | (0.4)% | 2.1% | up | up | up | |
| MSCI World | 2,304.50 | 2,765.89 | (1.2)% | 20.0% | up | up | up | |
| Bitcoin | 93,467.13 | 107,875.55 | (7.7)% | 15.4% | down | up | up | |
| Gold Mining Stock Indices | ||||||||
| Gold Bugs Index (HUI) | 275.58 | 515.57 (new highs) | 5.3% | 87.1% | up | up | up | |
| TSX Gold Index (TGD) | 336.87 | 609.68 (new highs) * | 3.6% | 81.0% | up | up | up | |
| % | ||||||||
| U.S. 10-Year Treasury Bond yield | 4.58% | 4.23% | (0.7)% | (7.6)% | ||||
| Cdn. 10-Year Bond CGB yield | 3.25% | 3.38% | (1.5)% | 4.0% | ||||
| Recession Watch Spreads | ||||||||
| U.S. 2-year 10-year Treasury spread | 0.33% | 0.61% | 10.9% | 84.9% | ||||
| Cdn 2-year 10-year CGB spread | 0.30% | 0.74% | flat | 146.7% | ||||
| Currencies | ||||||||
| US$ Index | 108.44 | 97.79 | 0.1% | (9.8)% | down | down | down | |
| Canadian $ | 69.49 | 0.7277 | 0.8% | 4.7% | up | up | neutral | |
| Euro | 103.54 | 116.92 | (0.3)% | 12.9% | up | up | up | |
| Swiss Franc | 110.16 | 124.91 | 0.2% | 13.4% | up | up | up | |
| British Pound | 125.11 | 135.07 | (0.1)% | 8.0% | up | up | up | |
| Japanese Yen | 63.57 | 68.01 | flat | 6.9% | up | neutral | down (weak) | |
| Precious Metals | ||||||||
| Gold | 2,641.00 | 3,447.33 | 2.3% | 30.5% | up | up | up | |
| Silver | 29.24 | 39.74 (new highs) | 2.1% | 35.9% | up | up | up | |
| Platinum | 910.50 | 1,367.40 | 1.2% | 50.2% | up | up | up | |
| Base Metals | ||||||||
| Palladium | 909.80 | 1,109.00 | (0.9)% | 21.9% | up | up | neutral | |
| Copper | 4.03 | 4.52 | 1.6% | 12.2% | down | down (weak) | up | |
| Energy | ||||||||
| WTI Oil | 71.72 | 64.05 | 0.4% | (10.7)% | down | down | down | |
| Nat Gas | 3.63 | 3.01 | 11.9% | (17.1)% | down (weak) | down | down (weak) | |
__
(Featured image by Ian Krukau via Pexels)
DISCLAIMER: This article was written by a third party contributor and does not reflect the opinion of Born2Invest, its management, staff or its associates. Please review our disclaimer for more information.
This article may include forward-looking statements. These forward-looking statements generally are identified by the words “believe,” “project,” “estimate,” “become,” “plan,” “will,” and similar expressions, including with regards to potential earnings in the Empire Flippers affiliate program. These forward-looking statements involve known and unknown risks as well as uncertainties, including those discussed in the following cautionary statements and elsewhere in this article and on this site. Although the Company may believe that its expectations are based on reasonable assumptions, the actual results that the Company may achieve may differ materially from any forward-looking statements, which reflect the opinions of the management of the Company only as of the date hereof. Additionally, please make sure to read these important disclosures.
David Chapman is not a registered advisory service and is not an exempt market dealer (EMD) nor a licensed financial advisor. He does not and cannot give individualised market advice. David Chapman has worked in the financial industry for over 40 years including large financial corporations, banks, and investment dealers. The information in this newsletter is intended only for informational and educational purposes. It should not be construed as an offer, a solicitation of an offer or sale of any security. Every effort is made to provide accurate and complete information.
However, we cannot guarantee that there will be no errors. We make no claims, promises or guarantees about the accuracy, completeness, or adequacy of the contents of this commentary and expressly disclaim liability for errors and omissions in the contents of this commentary. David Chapman will always use his best efforts to ensure the accuracy and timeliness of all information. The reader assumes all risk when trading in securities and David Chapman advises consulting a licensed professional financial advisor or portfolio manager such as Enriched Investing Incorporated before proceeding with any trade or idea presented in this newsletter.
David Chapman may own shares in companies mentioned in this newsletter. Before making an investment, prospective investors should review each security’s offering documents which summarize the objectives, fees, expenses and associated risks. David Chapman shares his ideas and opinions for informational and educational purposes only and expects the reader to perform due diligence before considering a position in any security. That includes consulting with your own licensed professional financial advisor such as Enriched Investing Incorporated. Performance is not guaranteed, values change frequently, and past performance may not be repeated.


TopRanked.io Weekly Affiliate Digest: What’s Hot in Affiliate Marketing [1xBet Affiliate Program]
If you thought nobody liked cricket, then this week, we're proving you wrong. And by the time we're done, you'll...


Tether Seeks Big Four Audit to Boost USDT Transparency
Tether, issuer of USDT, plans a full audit by a Big Four firm to address transparency concerns over its $184...


H&M Advances Sustainability and Cuts Emissions by 2025
H&M Group reported that by 2025, 91% of materials were recycled or sustainably sourced, with recycled content reaching 32%. Emissions...


NHS Funds Breakthrough CAR-T Therapy Breyanzi for Lymphoma Treatment in Spain
Bristol Myers Squibb announced NHS funding for CAR-T therapy Breyanzi, enabling its use from April 1st in Spain for lymphoma...


Crypto Markets Volatile as Bitcoin Hovers, Solana Eyes AI Integration
Crypto markets remain volatile amid the Iran war, with Bitcoin near $70,000 and ETF inflows improving outlook. Ethereum faces declines...
 |
|
 |  |
 |
|
-

 Markets2 weeks ago
Global Sugar Market Steady Amid Oil Price Surge and Iran Conflict
-

 Africa1 week ago
Fes-Meknes Drives Investment Growth with Diversified Sectors and Industrial Expansion
-

 Africa3 days ago
Bank Al-Maghrib Launches Reforms to Boost Credit via Non-Performing Loan Market
-

 Africa1 week ago
Modernizing Traditional Commerce in Fes-Meknes Through Financial Inclusion