Markets
The President, The Fed, and the Fragile Foundations of Economic Trust
Tensions between President Trump and key economic institutions are raising concerns over U.S. institutional independence as trade wars escalate with sweeping tariffs on over 70 countries. With inflation risks and global backlash now the order of the day, gold stocks are hitting record highs amid geopolitical and economic unease, although the S&P 500 and NASDAQ still remain elevated.

“It was the best of times, it was the worst of times…….”. Charles Dickens’ words still resonate today. This past week we had a continuing of the brawl between president Donald Trump and Fed Chair Jerome Powell, the firing of the head of the BLS because the president called the job numbers rigged, and tariffs, tariffs and more tariffs. The TACO man strikes. Oh yes, and Canada reported its July job numbers and no surprise we are falling just like everyone else is.
A big winner this past week was the gold stocks. The TSX Gold Index (TGD) is featured as our chart of the week. Records fell once again. Thanks to golds, metals and materials the TSX once again made all-time highs but nobody else did. At least not as yet but since that big reversal day on July 31 markets spent the past week trying to bounce back. Are more new highs coming despite the deteriorating background? The markets continue to deteriorate even if they have moved higher.
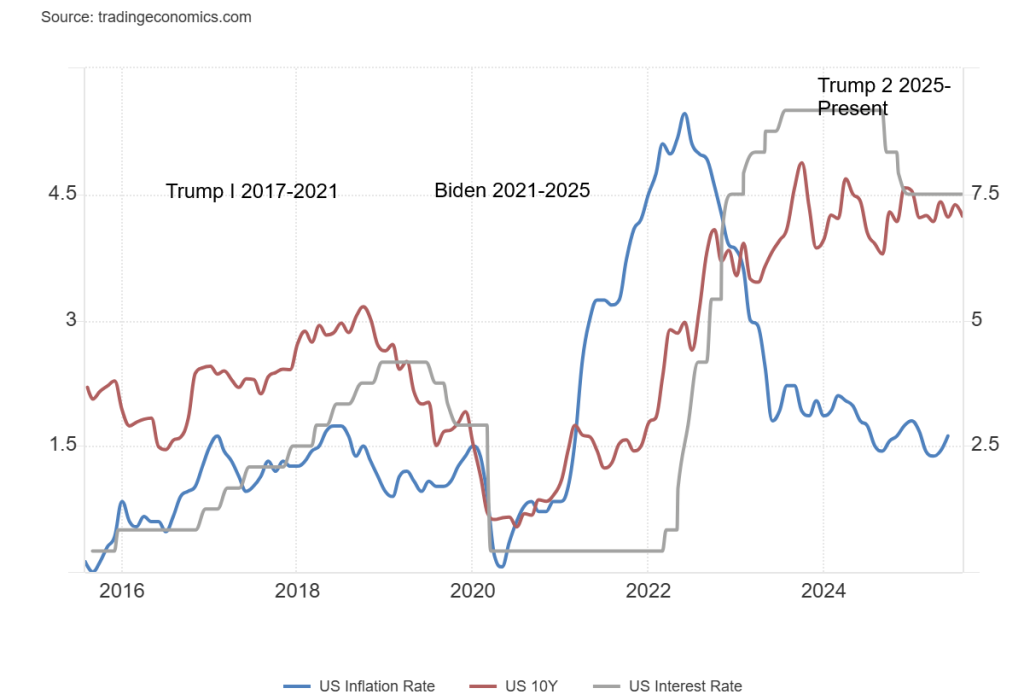
This week promises more action as we await the release of the July inflation numbers. We also get retail sales and the preliminary Michigan Sentiment Index. Early indications suggest inflation could be ticking higher. Could it be the tariffs? Possible yield increases that could accompany higher inflation may benefit the balance sheets of insurance companies such as Great-West Lifeco Inc., that reported increased base earnings, higher base ROE, pays a dividend, and is held in the Enriched Capital Conservative Growth Strategy.* We also get a meeting between Trump and Putin to supposedly resolve the Russia/Ukraine war. Odds of success – zero.
It’s been a hot muggy summer. It’s no surprise to discover that the sales of ACs and fans have jumped sharply globally this year. Portability and convenience have been paramount.
The Fed Chair and the President
The recent fights between U.S. President Trump and Fed Chair Jerome Powell exemplify some of that disorder, along with rising authoritarianism. Add in the recent firing of the head of the Bureau of Labour Statistics (BLS) by President Trump because he didn’t like the latest job numbers reported by the BLS.
The Federal Reserve’s independence is paramount. Monetary policy is made based on economic data, not short-term political pressures. While it doesn’t appear that Trump is prepared to fire Fed Chair Jerome Powell, Powell faces a constant barrage of criticism. Trump is also naming potential replacements long before Powell’s term is up in May 2026. Trump appointed Powell in 2017 to replace Janet Yellen. Trump is proposing Stephen Miran, the chair of the Council of Economic Advisors, to take the open position on the Fed. Miran is a known dove on interest rates and the U.S. dollar, which is potentially good for gold. He still needs Senate approval to be considered as the replacement Fed chair.
The Fed is led by economists and financial experts, not political-messaging appointees who may bend the Fed to the wishes of the president rather than basing their decisions on economic data. No, they are not always right. The Fed risks losing credibility and trust in the U.S. dollar as the world’s reserve currency. That in turn could see a pullback from the U.S., particularly in investment, the stock market, and most importantly the bond market where the U.S.’s $37 trillion debt load is by far the largest in the world. The bond market cannot be politically controlled, given its international nature. Over 25% of the U.S. debt is held by foreign countries, either as international reserves or investments. Some 20% is held by the Fed and over 20% is held by intragovernmental departments such as Medicare/Medicaid. The remainder is held by banks, insurance companies, and others.
A Fed without independence could result in a rise in inflation, the creation of asset bubbles, and even crashes as a result of manipulated interest rates. One of the biggest mistakes during the pandemic was flooding the financial system with liquidity (money) and lowering interest rates to near zero in order to prevent a recession or worse. The problem was, as is usual in these situations, they acted late at both ends—meaning, they held rates low for too long and added to liquidity beyond what was needed in the end. This led to the rise in inflation in 2022–2023, although other factors also contributed to that rise.
Ever since the 2008 financial crisis, the Fed and other central banks have consistently used quantitative easing (QE) and low interest rates to help prevent a potentially steep recession. The result has been a massive rise in the amount of debt outstanding by governments, corporations, and households and the rise of asset bubbles in AI, housing, and more. That in turn leads to financial crises where the unwinding of the period of low interest rates and QE becomes painful. No, monetary inflation is not the only reason we have inflation because we also have supply disruptions, sanctions, climate disasters, and more that also contribute significantly.
However, holding rates under the rate of inflation is a losing proposition in the long run–eventually one has to raise rates to choke off the inflation, which in turn could lead to the pricking of the asset bubbles.
It’s not an easy balancing act. However, if the Fed were to be politicised, we could see a collapse in global trust for the U.S. and its financial leadership. That in turn could be negative for the bond market, which is the ultimate judge of the management of finances of the U.S. The bond market can be unforgiving.
The BLS and the President
After the release of the recent job numbers, the president fired the head of the Bureau of Labour Statistics (BLS) for allegedly releasing rigged numbers. Agencies such as the BLS, the Bureau of Economic Analysis (BEA), the Federal Reserve, the Census Bureau, plus others are all independent, data-driven agencies. Their role is to provide data and statistics, although clearly the Federal Reserve is also responsible for a lot more. The BLS provides core economic data and statistics on unemployment, inflation (CPI), wage growth, productivity, etc.
Firing its head for purely political reasons—just because you don’t like the data—sets a dangerous precedent. It puts into question that all future data could be manipulated or influenced, thus undermining not just the financial market, but also the Federal Reserve, business investment, consumer sentiment, and legislation. Many depend on these numbers including economists, U.S. states, business, investors, analysts, researchers, academics in think tanks, universities, media, workers, labour unions, and statistical organizations. While the BLS is under the Department of Labour, it, like many other agencies, operates with considerable independence. For Canadians, comparable agencies would be Statistics Canada and the Bank of Canada. There are, of course numerous other agencies or, as they are called in Canada, Crown corporations.
“In my opinion, today’s Jobs Numbers were RIGGED in order to make the Republicans, and ME, look bad.” —President Donald Trump, August 1, 2025
Yes, there are problems with the data regularly collected by the BLS and other agencies. But U.S. data is one of the most renowned in the world. There were huge downward revisions of the labour data for May and June that helped trigger the president’s tirade. But revisions are a fact of life, particularly with labour statistics. In an excellent article by economist David Rosenberg of Rosenberg Research (The Globe and Mail, August 4, 2025), he outlines the flaws of data-gathering for the monthly labour statistics: www.theglobeandmail.com/investing/markets/inside-the-market/article-the-real-reason-behind-the-stunning-us-job-revisions-and-why-trumps/.
As we have often noted, there are two surveys published each month on labour: the establishment survey and the household survey. The establishment survey posts the monthly nonfarm payrolls plus examines industry from goods producing companies through to government. The household survey is far more extensive, covering everything from the size of the labour force to the unemployment numbers. The problem with the establishment survey is it depends on businesses filling out monthly surveys. The BLS has to deal with the responses, whether they come in or not. The response rate is not what is needed for totally accurate reports so the BLS is left to its own devices and the numbers are subject to revisions. The labour market is up to 170 million and the total population 16 years and older is over 270 million. That’s a lot to survey. And the population level excludes prison inmates and those in the armed forces.
If the market perceives that the numbers could be manipulated, volatility could increase and the many who rely on these numbers—from economists, to business, to the Federal Reserve—would no longer be able to make decisions and create policy. Data would become unreliable and as a result global trust in the statistics could collapse. That in turn could have a negative impact on the U.S. currency as the world’s reserve currency and on the bond market.
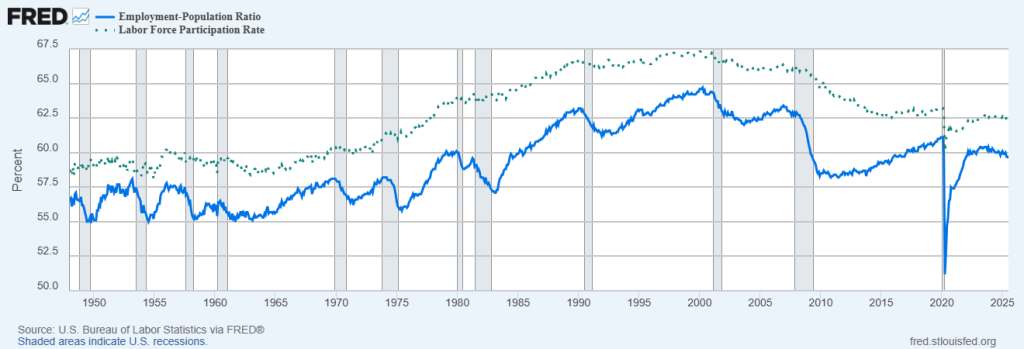
The U.S. employment population ratio and the labour force participation rate rose steadily from about 1970 onwards as the baby boomers and women entering the labour force helped to push up the numbers. But, since peaking in 2000 at the height of the dot.com boom/bubble, we have been in steady although irregular decline. The peak was 2000 with the employment population ratio peaking at 64.7% while the labour force participation rate peaked at 67.3%. Today they sit at 59.6% and 62.2% respectively, a steep decline. No surprise to learn that the “not in the labour force” category has soared during this period. This represents people unemployed for a longer period of time such that they are no longer considered a part of the labour force.
There are many reasons for the decline, including baby boomers retiring, manufacturing falling, mid-level skilled jobs being automated or offshored, while at the other end many students are staying in school longer. Add in rising disability and health issues, plus the high cost of childcare which forces many women to drop out of the workforce. Many laid off just don’t get work or don’t have the skills and the result is they drop out, relying on other benefits to survive. Homelessness has risen sharply in the U.S. and elsewhere. The Great Recession (2007–2009) along with the COVID pandemic also played an important role in pushing people out of the labour market.
Nonetheless, these numbers are important and if we can’t rely on the numbers going forward, the credibility of the report collapses. We also note as we were writing this that Trump is removing the head of the IRS. It would be the fifth time in the past year. Maybe he didn’t like his tax results.
Trade Wars and the President
August has marked the escalation of President Trump’s trade wars. Sweeping tariffs on over 70 countries ranging from 10% to 50% have kicked in. Some stand out, such as India at 50% with a base of 25% plus another 25% for buying Russian oil. Brazil also faces 50% with a 10% base plus another 40% because of charges being laid at the
former President Jair Bolsonaro. Bolosonaro and Trump were close, so Trump is using pressure to attack Brazil. Brazil has indicated they are not budging. Others hit include Switzerland at 39%, Canada at 35% unless it is CUSMA compliant, while the EU, South Korea, Japan, U.K., and Southeast Asia have lower rates from 10% to 15%.
Canada’s CUSMA-compliant trade covers some 90% of trade between the U.S. and Canada. However, notably, Ontario Premier Doug Ford believes the U.S. will tear up the CUSMA before its time is officially up on June 30, 2026. There are provisions for huge investments in the U.S. from the EU, Japan, and Korea, but they insist they are loans, not investments. As well, the EU in particular has met with stiff resistance from member countries because they believe the EU gave away too much. Overall, some countries caved to U.S. demands but others (Brazil, India, and even Canada) have not and will resist. In some instances, steep counter tariffs are being announced, particularly in India.
One interesting tariff is a tariff on gold bars from Switzerland. Switzerland is the world’s biggest refiner of gold. The tariffs are on 1-kilo and 100-ounce bars. The tariff on Switzerland is 39%. Notably, the COMEX (Commodity Exchange) also competes with Valcambi of Switzerland for the refinement of gold bars, but Valcambi is the biggest. The initial reaction was for gold prices (December futures) to reach new all-time highs over $3,500. However, the White House said they needed to clarify these tariffs. As a result, gold fell. We await.
Additionally, tariffs of 100% will be placed on foreign-made semiconductors to boost domestic supply. Taiwan is huge manufacturer of semiconductors. All these tariffs could eventually be passed on to consumers (inflationary) unless the companies wish to take a hit to their profits. Market volatility will grow and global trade tensions could escalate.
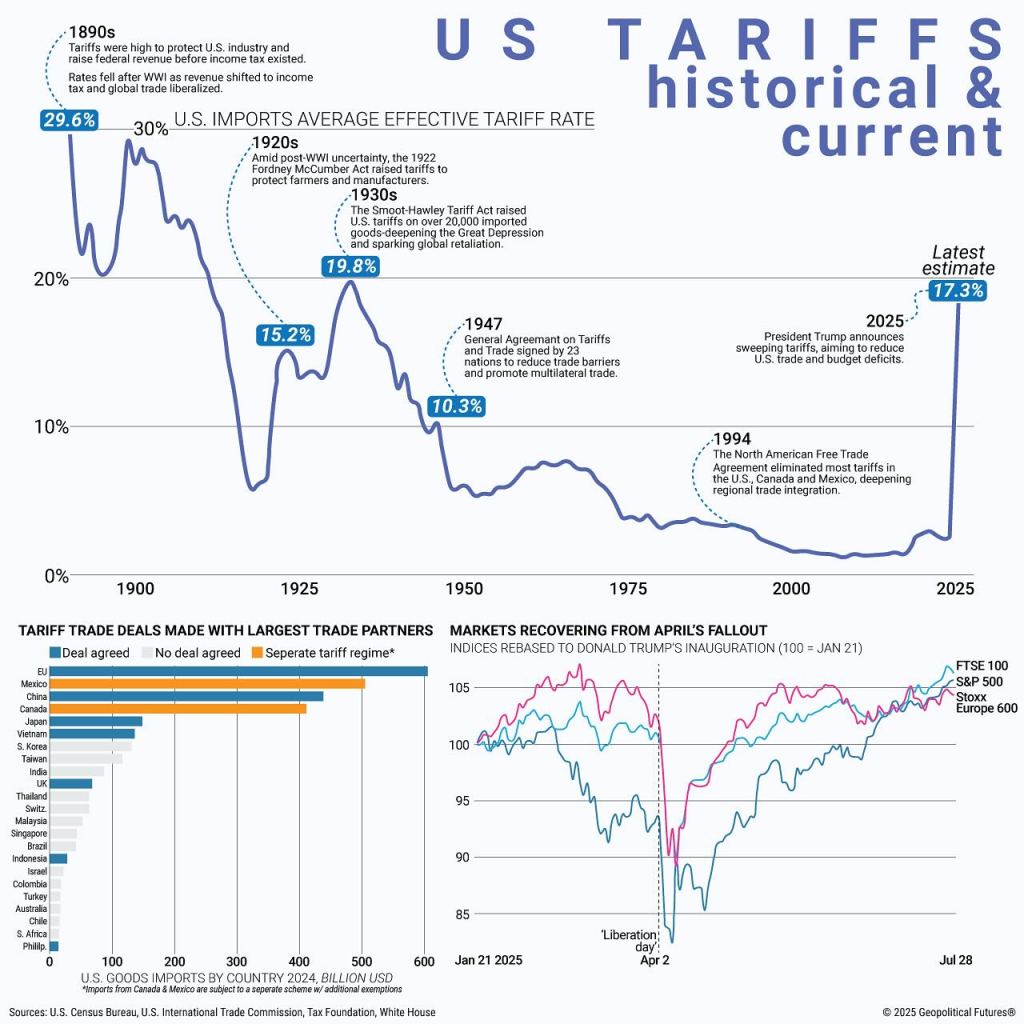
The tariffs are unprecedented and are now higher than they were following the Smoot-Hawley Tariff Act of 1930. For years after World War II, the world moved towards freer trade, first with GATT and then with the World Trade Organization (WTO) and free trade agreements (CUSMA). However, this is no longer the case. In response, particularly from the rise of global trade tensions, gold is threatening to break out while the stock market rally is fading.
The following chart from Geopolitical Futures indicates that the latest estimate is 17.3% for the current average tariff. Some note it is higher, over 18%. The tariff wars of the 1930s resulted in the Great Depression, followed by global war. Will history repeat itself or just rhyme?
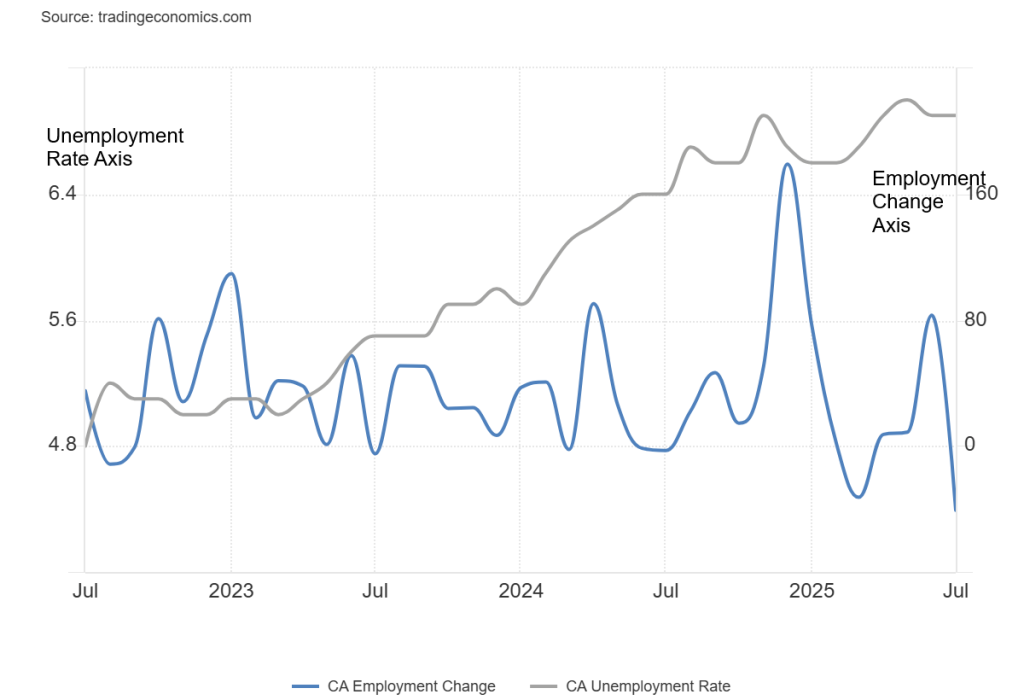
Canada’s employment fell 40,800 in July after a huge up of 83,100 in June. Volatile, but not unusual. The unemployment rate was unchanged at 6.9% while the R8 unemployment rate (plus discouraged searchers, waiting group, portion of involuntary part-timers), the highest level reported by Statistics Canada www.statcan.gc.ca), jumped to 9.9% from 8.6%. In many ways, given tariffs, etc., it is not surprising to see a shakedown in the employment numbers. However, note that Canada’s employment change (comparable to the U.S. nonfarm payrolls) averaged 34,600/month over the past year. Proportionally, that’s a factor of 2.2 times better than the U.S., despite the drop in July. Full-time employment fell 51,000 while part-time employment rose 10,300. The biggest losses were in information and culture/recreation as well as in construction, which is odd given the need to build houses.
The number of employed persons fell by 100,000 while the number of unemployed persons rose by 10,000. The employment population ratio fell to 60.7% from 60.9% while the labour force participation rate fell to 65.2% from 65.5%. That helped keep the unemployment rate steady at 6.9%.
Analysts had expected employment to rise by 13,500 jobs while the unemployment rate ticked up to 7.0%. However, in many ways, a loss was not really a surprise, given the big gain in June. Like the U.S., StatsCan does have smoothing out to do with the job numbers, although Canada’s do not show as dramatic a change as the numbers in the U.S. Canada also calculates its unemployment rate differently. If it is calculated the same as the U.S., Canada’s unemployment rate is 6%.
Contributing to the rising unemployment has been the steep tariffs being put on Canada, particularly on steel, aluminum, and automobiles. Overall, though, the impact is still small compared to what it could be. Young people took the bulk of the job losses. What will the BofC do? They left rates unchanged at the last interest rate meeting. The next one is on September 17, with the odds favouring a rate cut. Average hourly wages actually grew, up 3.5% year over year (y-o-y) vs. up 3.2% in June.
An interesting aspect of the jobs report was that despite the loss of jobs in July Canada had a huge gain in June. Add the two together and average it is 40,000 jobs over June and July. For 2025 Canada has averaged 11,400 jobs each month. Yes it has slowed from 2024 but considering all that is happening growth continues.
Chart of the Week
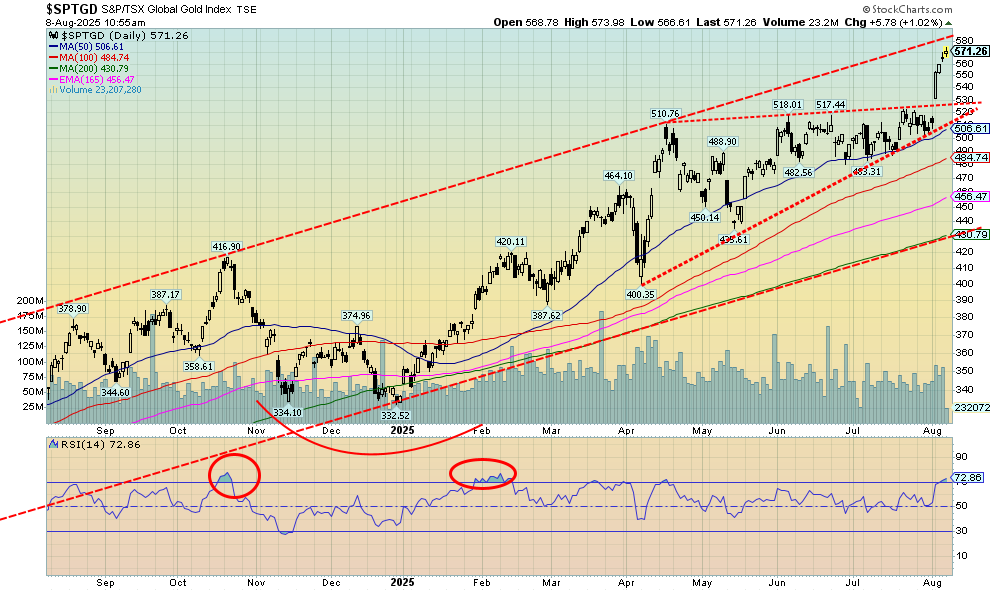
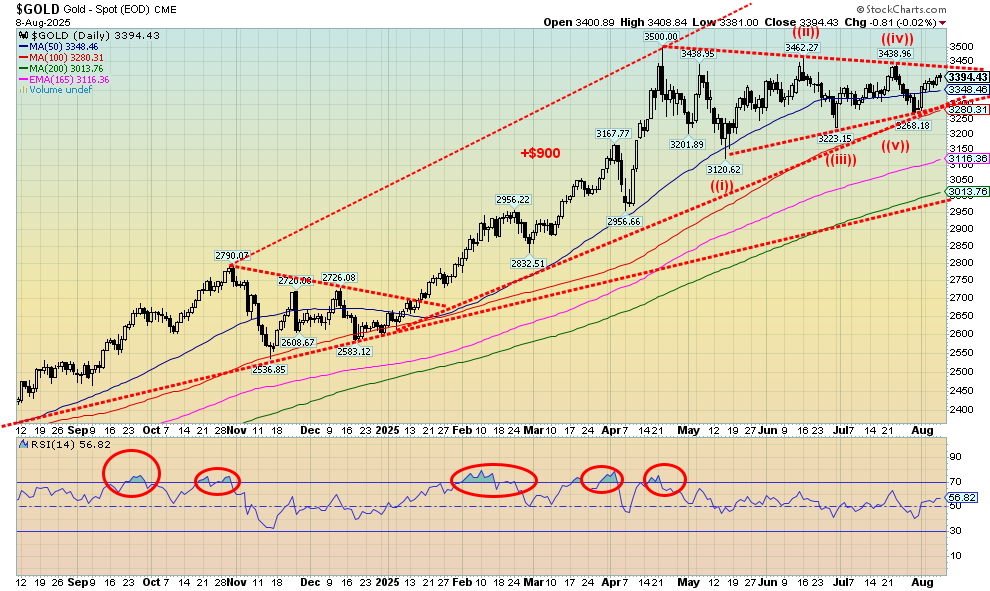
Gold and silver are threatening to break out to new highs. Gold has (Dec futures but not cash); we await silver. The gold stocks already have. Some might argue that the TSX Gold Index (TGD) was forming an ascending wedge triangle. Others interpret it as just an ascending triangle. The difference is the former is bearish and the latter bullish. We broke out to the upside, suggesting that it was an ascending triangle. The triangle has potential measuring to around 635. That’s another 12% away. The TGD has been making new all-time highs.
Not so much the Gold Bugs Index (HUI). While the HUI has broken out to the upside, it remains a fair distance from its all-time high at 639 set in 2011. The HUI’s potential target is 543, still a long way from that 2011 high. Nonetheless, the HUI is making fresh 52-week highs.
Both indices are now seeing their RSI rise above 70, which indicates overbought. Profit-taking would not be a surprise, especially when we hit the top of that bull channel, which is currently near 585. The breakout suggests that pullbacks could be bought, but now with an RSI overbought and approaching that channel top, one might be wise to await a pullback. For the TGD, a breakdown under 500 would be negative and could see further declines to 480 and 450. Profit-taking as we move higher is a wise idea in a market that can be volatile.
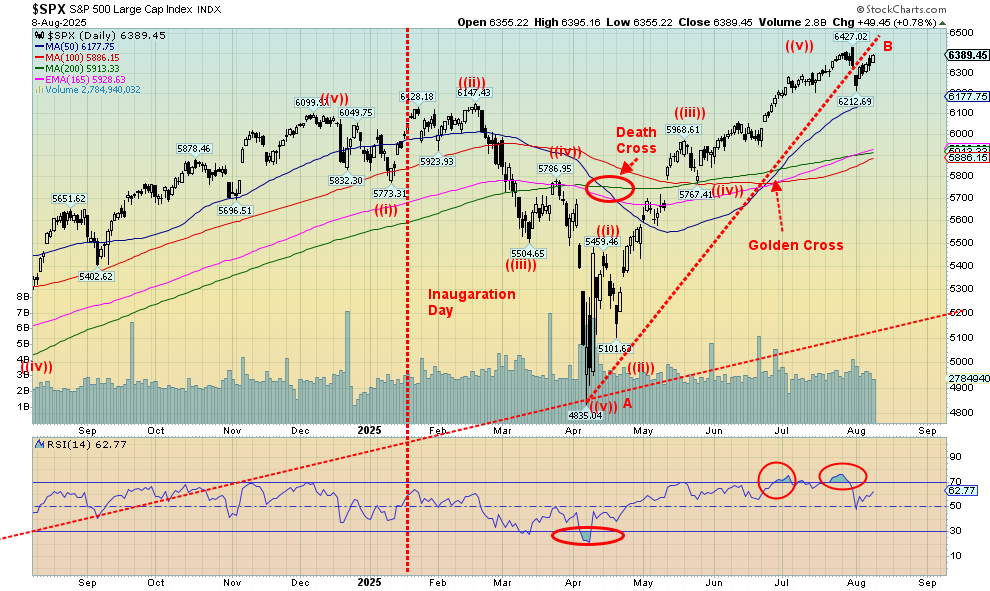
When, oh when will this market top? It’s August, the second worst month of the year. Coming up is September, the worst month of the year. October usually brings lows. We reversed off the highs on July 31 (all-time for SPX and NASDAQ), but so far the follow-through has been feeble and we are starting to rise again, suggesting we could yet see another all-time high. Nonetheless, we would not want to follow it. Divergences with the Dow Jones Industrials (DJI) and Dow Jones Transportations (DJT) tell us the indices are not confirming each other. Dow Theory suggests when that happens a trend reversal is coming. Unfortunately, it doesn’t say when.
Other indicators are not great. Divergences are being seen with the advance/decline line, the new highs/new lows line, the percentage of stocks above their 50-day MA and 200-day MA, the NYSE McLellan oscillator, bullish percent indicators, bullish/bearish indicators, put/call indicators, and the Volatility Index (VIX). None of them are confirming this rally. The RSI has been above 70, but currently it is not at 62.8. So far, nothing has triggered the stock market lower: no financial crisis, no major geopolitical crisis, and no domestic crisis. Oh, there are crises but they are one-offs or the stock market isn’t concerned about them. They are concerned about earnings, which are wobbling but not cracking. The economy is slowing, but not falling out of bed. And
deficits, which help provide liquidity, help keep the market rising. Trump’s Big Beautiful Bill promises more tax cuts, mostly for wealthy investors. Everyone else spends. A reminder, however, that the Big Beautiful Bill is still hung up in the Senate.
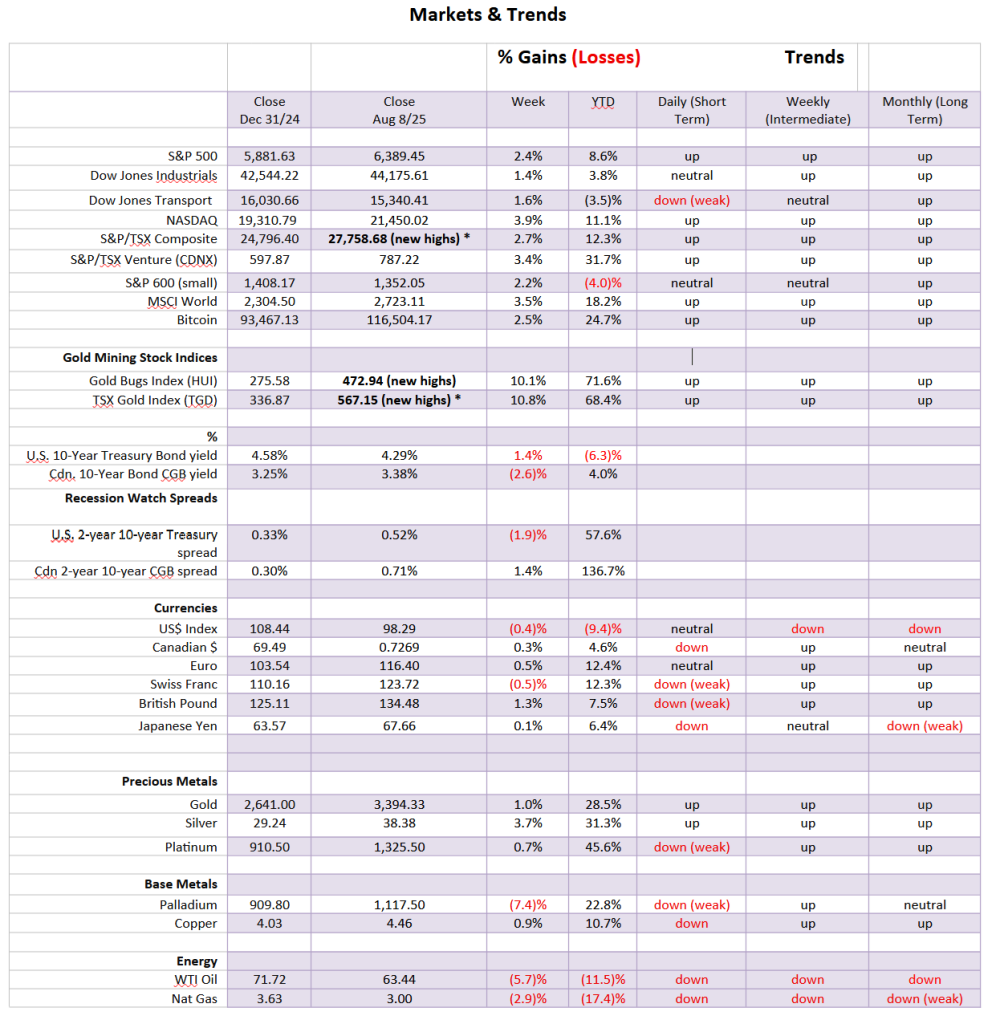
On the week, the S&P 500 (SPX) rose 2.4%, the DJI was up 1.4%, the DJT up 1.6%, and the NASDAQ gained 3.9%. Yes, the NASDAQ is close and it did close at a record high, but the absolute high remains intact for the moment. The S&P 400 (Mid) rose 0.5% while the S&P 600 (Small) was up 2.2%. Bitcoin was up 2.5% but remains shy of its all-time high.
In Canada, the TSX did make a new all-time high, gaining 2.7%, while the TSX Venture Index (CDNX) was up 3.4%. Helping the TSX make news were Golds (TGD), Metals (TGM), and Materials (TMT) as all were up sharply this past week. Information Technology (TTK) gained 7.5%, also adding to the rush to new highs. All-time highs were seen for the TGD, TGM, TMT, TTK, and Utilities (TUT).
In the EU, the London FTSE made all-time highs, up 0.3%, the Paris CAC 40 was up 2.6%, the German DAX was up 2.8%, and the EuroNext gained 2.5%. In Asia, China’s Shanghai Index (SSEC) was up 2.6%, the Tokyo Nikkei Dow (TKN) gained 2.5%, and Hong Kong’s Hang Seng (HSI) gained 1.4%. The MSCI World Index (ex USA) gained 3.5%. All in all, a good week for stock indices. But September is coming. Is there a beware the Ides of September?
New highs remain possible for the SPX and NASDAQ. A break back down that takes out 6,200 spells trouble. Under 6,100 there’s more trouble. Major support for the moment is down around 5,900. This is not the time to be buying. It’s the time to batten down the hatches and take profits. Storm clouds are gathering.
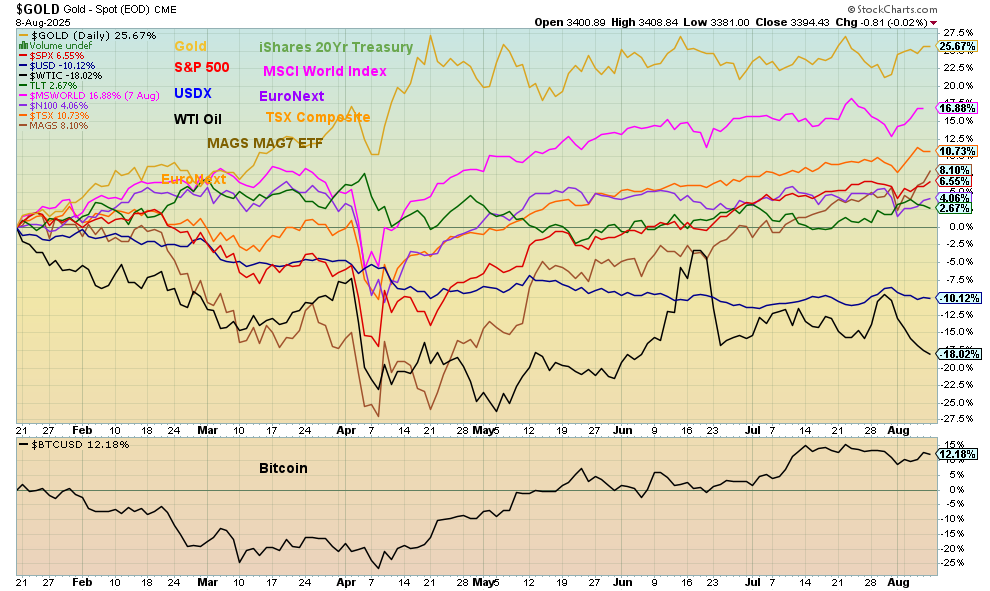
Another week and gold remains firmly in the lead since January 20, 2025, up 25.7%. The MSCI World Index (ex USA) is second, up 16.9%. WTI is still the worst performer, down 18%, while the US$ Index is second to last, down 10.1%. Gold hasn’t moved much since April but continues to suggest it should break out to the upside.
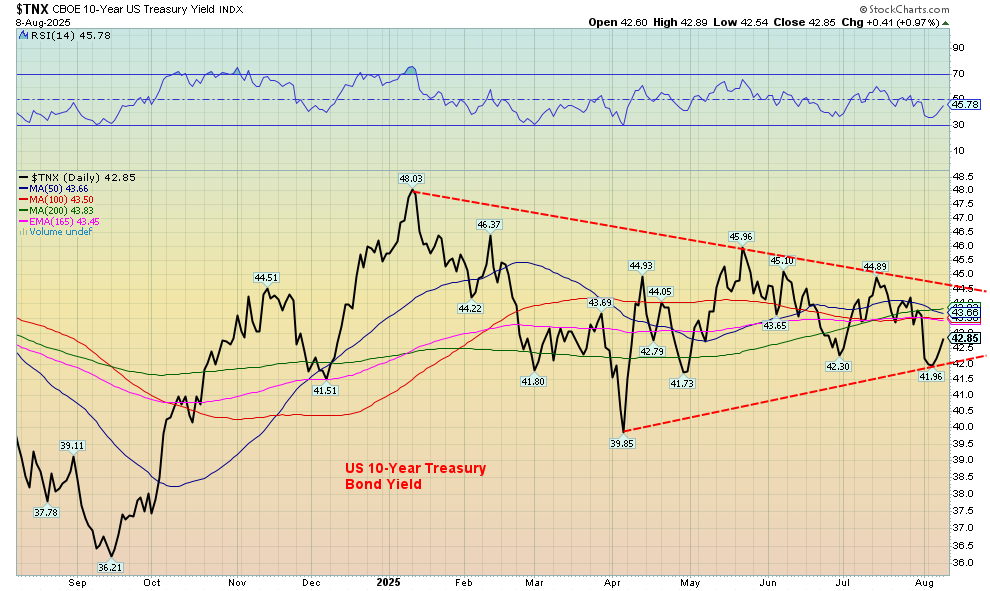
Symmetrical triangles can either be a consolidation pattern or a topping pattern. It is rare to see one as a bottom pattern, but it happens. Here we have the quandary of interpreting the clearly forming symmetrical triangle. Bond yields ticked higher this past week with the U.S. 10-year Treasury note up to 4.29% from 4.23%. Kept us within the triangle that is forming. We now have a clear demarcation for the triangle. A breakout over 4.45% suggests higher while a breakdown under 4.20% suggests lower. As with all breakouts or breakdowns, we normally prefer a close under the breakout/breakdown and then staying over/under for at least a couple of days. Measuring implications suggests for a breakout, the target could be up to 5.25%, while a breakdown suggests a decline to 3.40%. We continue to favour the breakout but can’t rule out a breakdown. As well, the triangle may not yet be complete. As we have noted, the bond market is the authenticator of the actions of the president and what he does. The bond market does not respond to threats, as it’s too big and too international.
Did gold make all-time highs this past week? The December futures did spring past $3,500 and hit a high of $3,534. All that was in response to the news that Swiss 1-kilo and 100-ounce bars were to be tariffed. The U.S. placed a blanket 39% tariff on Swiss imports. Then, later, the White House wished to issue a statement to clarify the tariffs on gold bars. As far as we are concerned, we have yet to see it. Following that news, gold rapidly sold off again. December gold futures closed at $3,491.
However, this chart doesn’t show that as it uses the rolling near futures which, in this case, are the August futures. They mature or settle later this month on August 27. As a result, the August futures which are more tied to cash gold did not respond the same way as the December futures. We closed at $3,394, still well short of a new record high over $3,500. As a result, the divergence with silver and platinum continues.
On the week, gold did rise 1.0%, silver was up 3.7%, while platinum managed a gain of 0.8%. Of the near precious metals, palladium fell 7.4% while copper continues to struggle but did gain 0.9%. The gold stock indices fared quite well with the Gold Bugs Index (HUI) up 10.1% to new 52-week highs while the TSX Gold Index (TGD) gained 10.8% to new all-time highs. Are the gold stocks leading? When we see gold break over $3,500, silver over $39.50, and platinum over $1,492 we’ll know we are on our way. Until then we remain
vulnerable to a downside break. We say this, even though the fundamentals for gold remain very strong and the underlying geopolitical, domestic-political, and economic conditions continue to help gold remain a safe haven. You can’t print more gold; you need to dig and hope you find some.
Over in the oil market, the on-again, off-again of a potential deal with Russia over Ukraine keeps some downward pressure on the price. However, it’s OPEC hiking production for market share that sparked a sell-off in oil. WTI oil fell 5.7%, Brent crude was down 4.7%, natural gas (NG) was off 2.9%, and the EU NG was down 4.9%. The energy stocks saw the ARCA Oil & Gas Index (XOI) down 0.7% and the TSX Energy Index (TEN) off 0.6%.
The US$ Index fell 0.4% this past week, throwing into question that earlier breakout. Breaking 97 would end any discussion of the breakout continuing. The recent high was 100.25 so we have to take that point out. As for the currencies, they were mixed this past week. The pound sterling gained 1.3%, the Cdn$ was up 0.3%, and the euro was up 0.5% while the Japanese yen gained 0.1%. The Swiss franc was the only loser, down 0.5%.
Gold is our safe haven of choice. It is no one else’s liability. You can’t print it. Gold responds positively to geopolitical, domestic-political, and economic tensions, for which we have all three. If gold were to break out of that triangle that has been forming, targets are $3,825. We are treating the triangle as a consolidation symmetrical triangle, but as we have warned, they can also be tops. The background suggests that the breakout should be to the upside.
__
(Featured image by RDNE Stock project via Pexels)
DISCLAIMER: This article was written by a third party contributor and does not reflect the opinion of Born2Invest, its management, staff or its associates. Please review our disclaimer for more information.
This article may include forward-looking statements. These forward-looking statements generally are identified by the words “believe,” “project,” “estimate,” “become,” “plan,” “will,” and similar expressions, including with regards to potential earnings in the Empire Flippers affiliate program. These forward-looking statements involve known and unknown risks as well as uncertainties, including those discussed in the following cautionary statements and elsewhere in this article and on this site. Although the Company may believe that its expectations are based on reasonable assumptions, the actual results that the Company may achieve may differ materially from any forward-looking statements, which reflect the opinions of the management of the Company only as of the date hereof. Additionally, please make sure to read these important disclosures.


TopRanked.io Weekly Affiliate Digest: What’s Hot in Affiliate Marketing [Bovada Affiliate Program]
This week, we're mashing up 80s tech with 2020s private messaging apps. Why? Because Big Tech just dropped a big...


Euro Stablecoins Struggle to Compete with Dollar Dominance in Crypto Markets
Euro stablecoins remain marginal despite the euro’s global importance, with minimal trading volume compared to dollar rivals like USDT and...


Gilead Sciences Advances Growth Strategy with Focus on HIV, Oncology, and Innovation
Gilead Sciences focuses on developing treatments for HIV, cancer, and inflammatory diseases, driven by blockbuster drugs like Biktarvy. Growth relies...


Casablanca Stock Exchange Profits Surge in 2025 as Growth Momentum Strengthens
In 2025, Casablanca Stock Exchange profits rose 40% to MAD 50.9 billion. Net income grew 22.3%, driven by strong industrial...


Credibur Scales Rapidly: €2 Billion in Structured Debt Facilities in Six Months
Infrastructure fintech Credibur has added over two billion euros in structured debt facilities within six months. Its platform connects lenders,...
 |
|
 |  |
 |
|
-

 Biotech2 weeks ago
Italy’s Pharmaceutical Sector Drives Innovation, Sustainability, and European Leadership
-
 Biotech2 days ago
Gilead Sciences Advances Growth Strategy with Focus on HIV, Oncology, and Innovation
-

 Crowdfunding1 week ago
Crowdfunding Evolves into Core Financial Infrastructure in Europe
-

 Impact Investing5 days ago
Italian Unlisted Banks Lag on ESG Sustainability