Featured
Rope-a-Dope in the Gold Market?
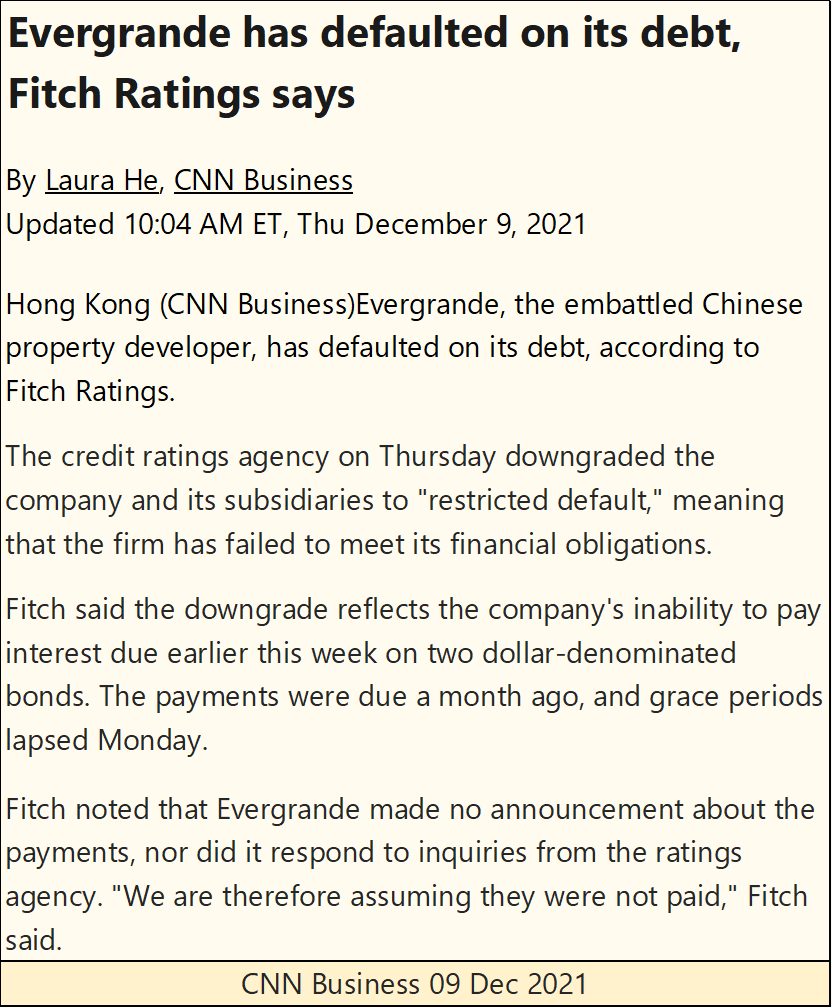
The gold market now finds itself in a very interesting position as it approaches the end of 2021. Have the bears punched themselves out as the bulls played rope-a-dope with them? If so, we could see some explosive market action in the next few weeks. That is especially so should the impact of China’s Evergrande massive debt default finally impact the big banks on Wall Street.
Last week, it looked as if the bubble in the stock market could have popped. On Wednesday (December 1st) the Dow Jones closed with a BEV of -6.62%, well outside of scoring position.
But I’ve learned the hard way not to make rash market predictions in the 21st century. As somehow, someway, buyers, mysterious or otherwise show up anytime it appears that Mr Bear is ready to do his thing.
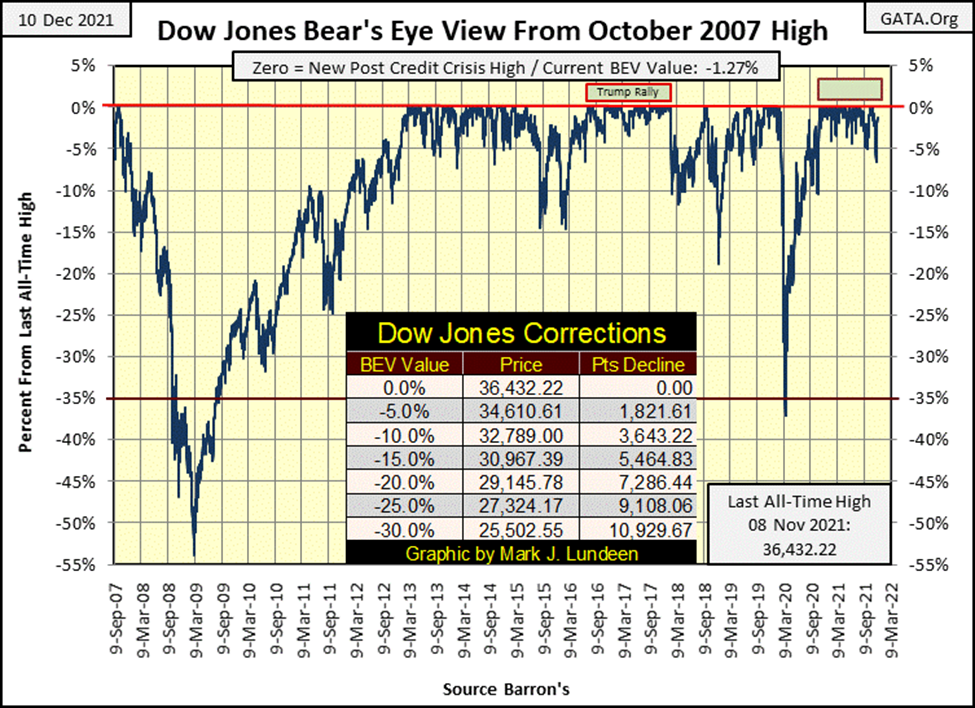
It was no different this week, when from out of nowhere dollars began flowing into the market, reflating market valuations for as far as the eye could see. From its lows of December 1st, the Dow Jones’ valuation was reflated by just over $1,900, in only seven NYSE trading sessions, closing the week with a BEV value of -1.27%.
But the Bear’s Eye View chart above is a poor platform for displaying the toils and tribulations seen by the bulls and bears this past month on Wall Street. So, let’s look at the Dow Jones in its daily bar chart below.
From its all-time high of November 8th to December 1st, the Dow Jones shed 2,410 points off its valuation, or -6.64% in BEV terms. Then seven days after the Dow Jones almost slipped below 34,000, someone “injected” 1,948 points back into the Dow Jones in only seven NYSE trading sessions.
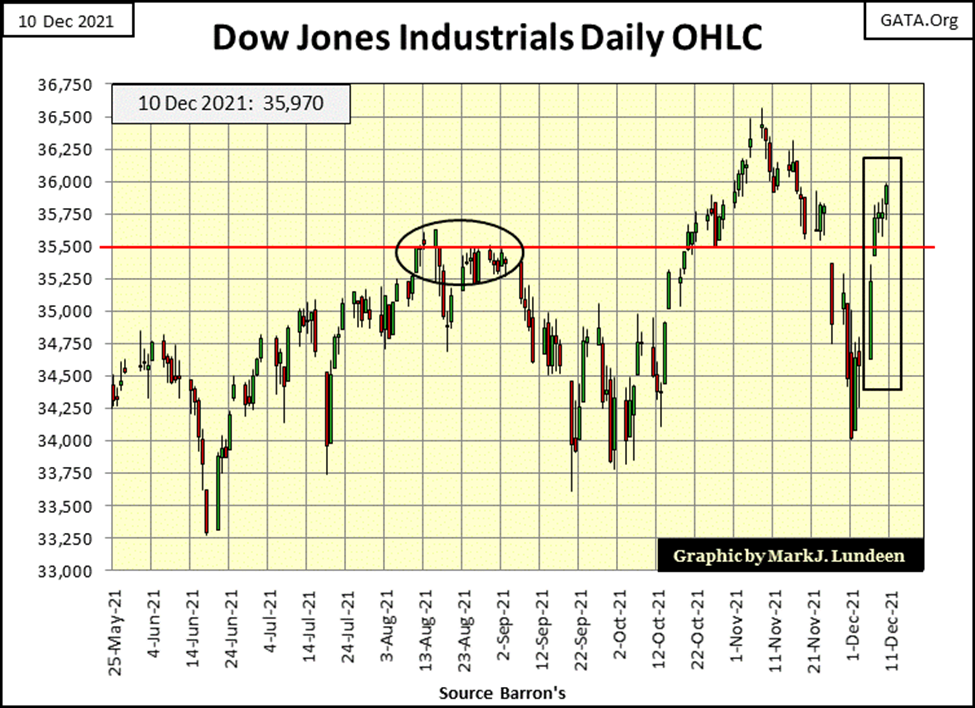
All this goes to show that unless the stock market sees a series of extreme days; days of extreme volatility (Dow Jones 2% Days) and days of extreme market breadth (NYSE 70% A-D Days), it’s best not to get too bearish on this market.
Below is my table of daily BEV values for the major market indexes I follow. From Monday to Friday, we see “liquidity” flowing back into the stock market. On Friday’s close, we even got a new all-time high for the S&P 500.
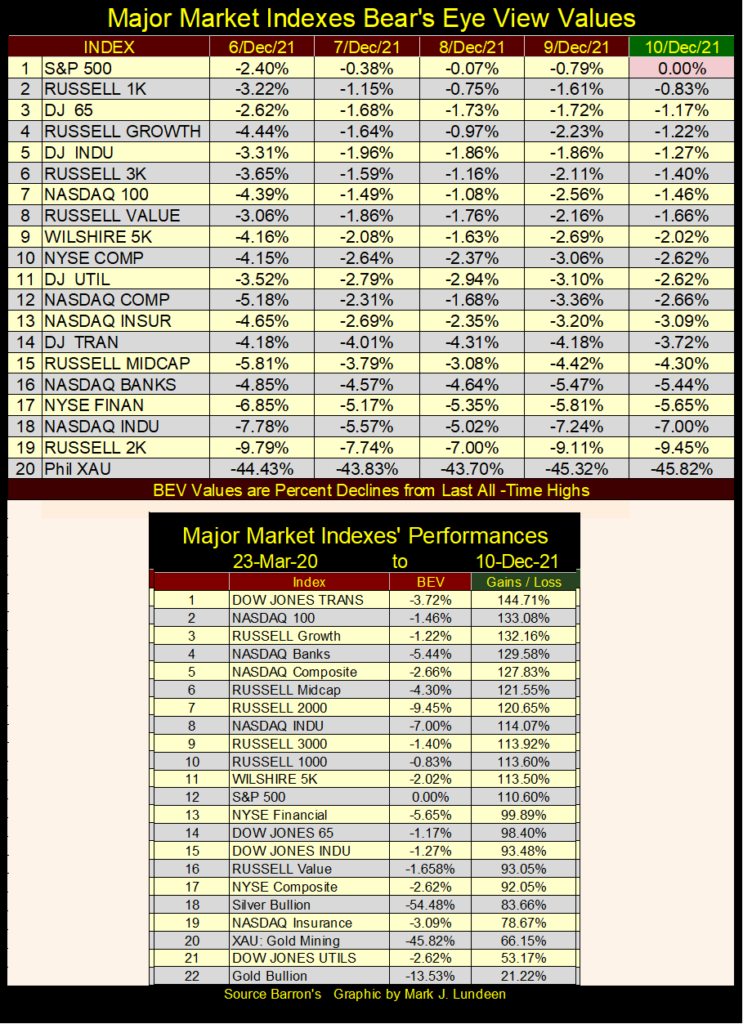
Though I can’t see into the future, I know how the cowboys running this rodeo like to see things go, and they like seeing new all-time highs (BEV Zeros / 0.00%) in the table above. So, I’m predicting that’s what we are going to see come the next few weeks. Don’t be surprised should the Dow Jones close above 37,000 on its way to 40,000 sometime in the not-too-distant future.
From today’s close, 37,000 is only 2.80% away, and a close at 40,000 is only 8.19% away. In a “good market”, seeing the Dow Jones trade above 40,000 is very doable before February 2022.
That’s some pretty bullish talk from someone sitting high up in the market’s peanut gallery. Damn, right it is. And I wouldn’t bet a nickel on this market, not on the upside or the downside, because I know exactly who runs this rodeo. A gaggle of idiot savants who know only one trick; “injecting liquidity” (monetary inflation) into the global market place they have no right to be fixing prices in.
There is only one thing that would change my mind about this; that a move to the downside could be a real show of force by Mr Bear. Should the market begin seeing extreme days, as it did during the sub-prime mortgage bear market, and the March 2020 flash crash. I could also include the Great Depression crash, and the market crash of 1907 in the list. It’s just a historical fact that on the way down to a 40% bear market decline, the Dow Jones litters the market with extreme days.
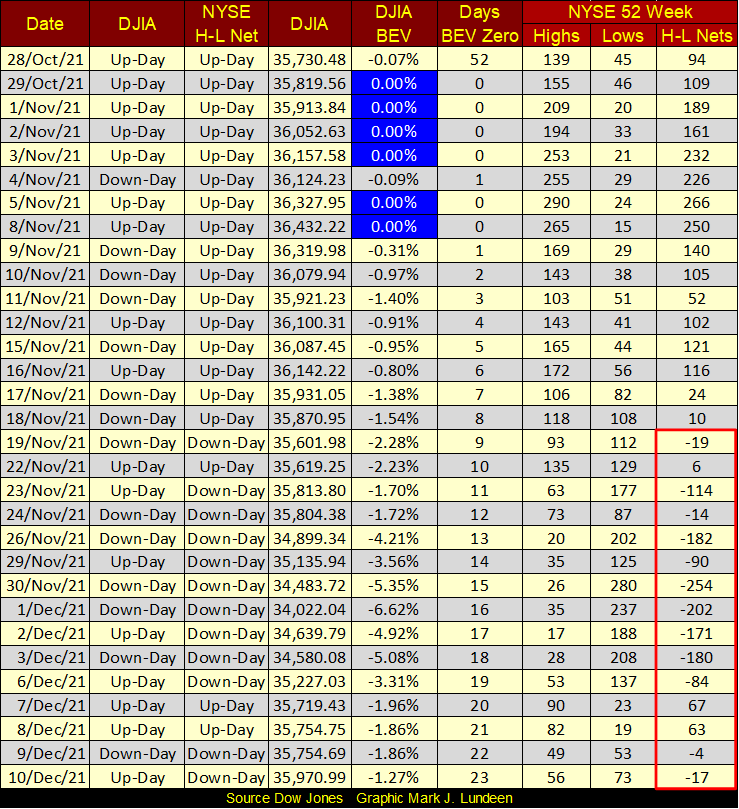
Here’s the NYSE 52Wk Highs and Lows table. The Dow Jones may have closed Friday only 1.27% from making a new all-time high, but you can see the NYSE still saw 17 more 52Wk Lows than Highs. In the weeks to come, I expect we’ll see 52Wk Highs dominate the NYSE again.
Take a moment and look at the DJIA BEV column from November 8th on down to today’s close. It took sixteen NYSE trading sessions for Dow Jones to deflate 6.62% on December 1st, and only seven NYSE trading sessions to gain back most of that at today’s close.
What’s to be taken from knowing that? Personally, I think it shows how much the market has changed since Alan Greenspan became Chairman of the Federal Reserve in August 1987. Before Greenspan (BG), one didn’t see amazing rebounds in the market, as seen below. After Greenspan (AG), they’ve become common.
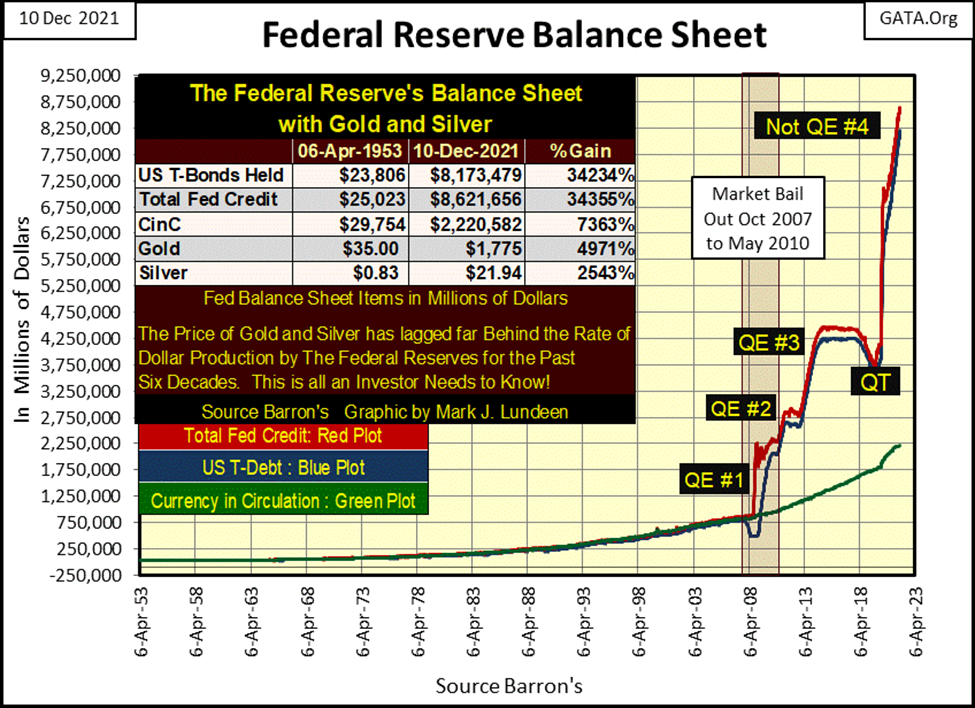
It’s not only that the punters sitting high up in the markets’ peanut gallery are moaning and groaning about the market being manipulated. Look at what the idiot savants at the FOMC have done to their balance sheet (chart below). It may be “their balance sheet”, but it’s also about the dollars we work for and save, the dollars we need to pay our bills that they are diluting to nothing in the not-too-distant future.
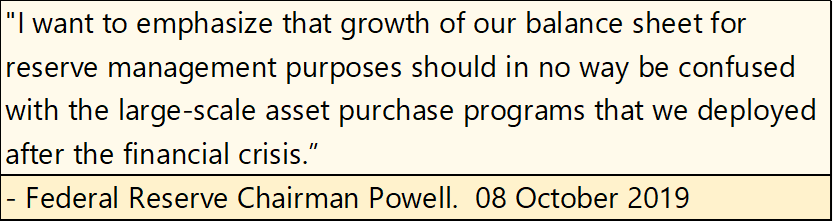
Why do I call their latest round of QE the Not QE#4? Because that’s what Fed Chairman Powell said it would be way back in October 2019.
Technically, Chairman Powell wasn’t lying, as his Not QE#4 was far worse than Dr. Bernanke’s QE 1-3. That plus, unlike Dr. Bernanke’s first three QEs, after two years Powell’s Not QE#4 shows no sign of slowing down anytime soon. Exactly as Jim Sinclair predicted back in 2008: “QE to infinity.”
What’s going on here? All this quantitative easing is the FOMC’s hyper-inflationary reaction to their fear-of-deflation in the financial market following their 2007-09 fiasco in the sub-prime mortgages market.
Here’s a quote from Richard Fisher, President of the Dallas Fed from 2005 to 2015. Note he doesn’t say why the FOMC decided to implement a program of three quantitative easings. These QEs had nothing to do with their “monetary policy’s” destruction of the real estate market, or the lives the FOMC shattered during the crash of 2007-09.
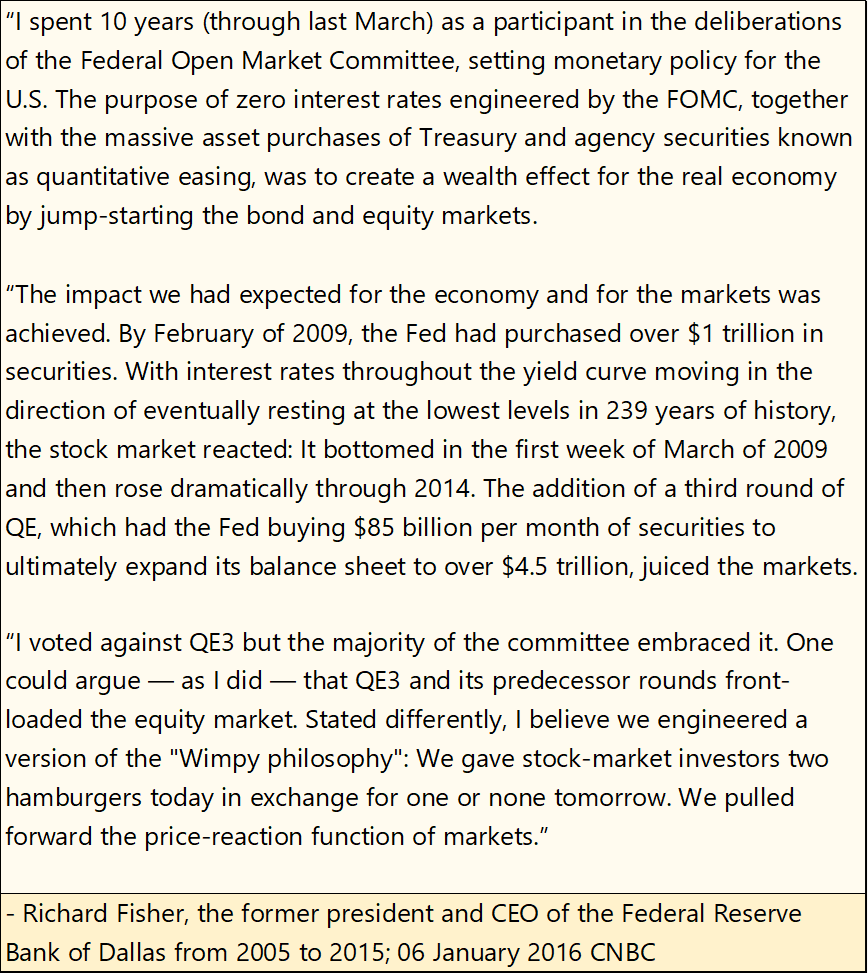
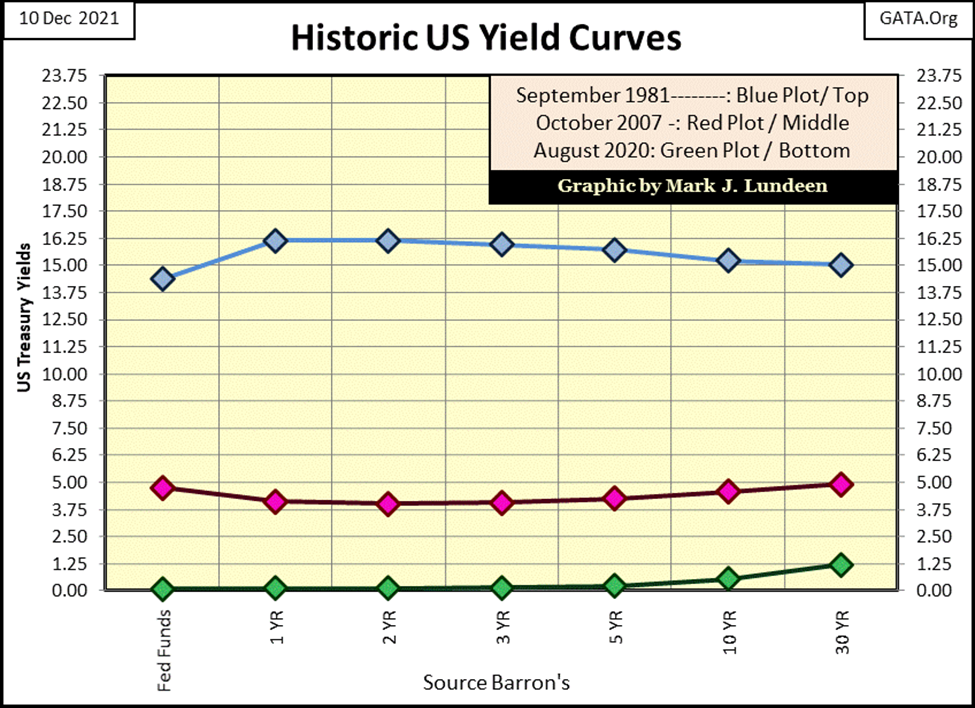
Fisher was five years gone by August 2020. But as seen below, the other idiot savants at the FOMC had outdone themselves with lower bond yields. In less than a year into their Not QE #4, they nailed the US yield curve down into the floor boards (green plot chart below). In August 2020, as the price of gold hit its last all-time high, the 10Yr T-bond was yielding only 0.55%, the 30Yr bond only 1.20%.
We are all very ill-served by these giant bureaucracies created by Congress. For the most part they are headed by sociopaths who have zero empathy for we lesser mortals, sociopaths who use their positions in the public trust to further secret agendas. They are no different than Dr. Fauci, who in the link below is finally being discovered for the criminal he is.
https://duckduckgo.com/?q=dr+fauci+exposed&t=h_&ia=web
It’s also a scandal how such people have made a career for themselves in the government sector, running amuck with the vast sums of taxpayer’s money they control, with no effective supervision by Congress or the Mainstream Media.
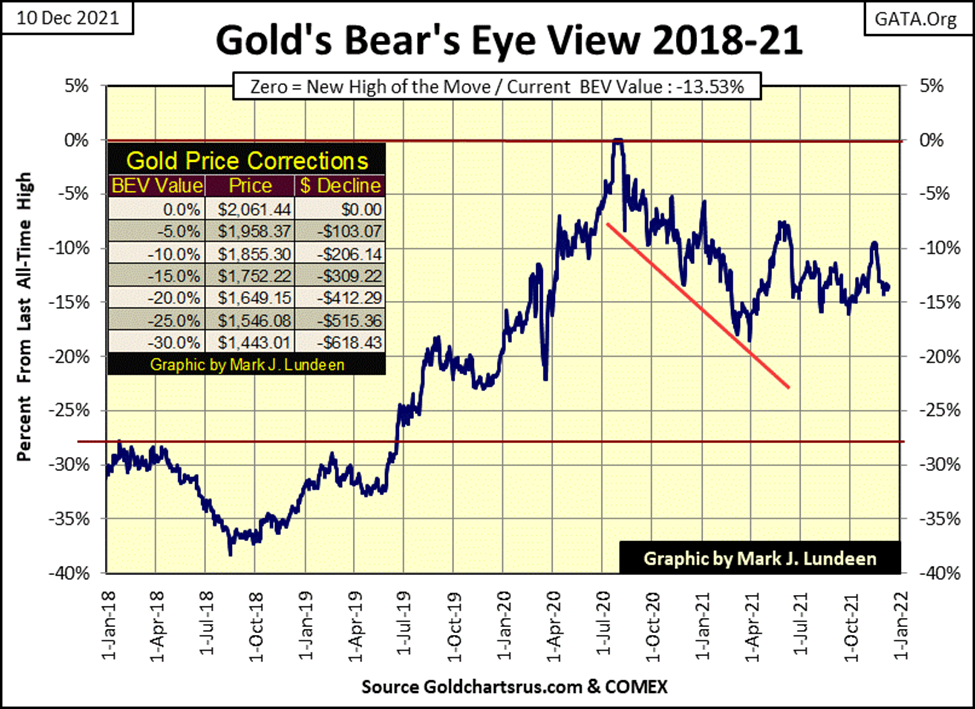
This is so depressing. Time for some pleasant things to consider, like gold, silver, and mining shares. Here’s gold’s BEV chart. As has been the case since early July (five months), gold’s BEV -15% line ($1752) has given strong support to the gold market. That’s good. But during these same five months, gold’s BEV -10% has also proved to be extremely strong resistance. So, for the most part, gold hasn’t done much for either bull or bear since early July.
Nothing goes on forever, so one of these days’ gold is going to break below its BEV -15% level, or rise decisively above its BEV -10% line in the chart below. But when? I haven’t a clue, but I expect the next big move for gold will be to make some new all-time highs.
My reasoning for that assumption is that of all asset classes; stocks, bonds, and real estate, precious metal assets are the only asset class not currently trading at hyperinflationary levels.
Let’s take a look at the Bear’s Eye View (BEV) chart for Barron’s Gold Mining Index (BGMI) going back to January 1920, a chart that spans over 100 years of market history.
I placed a red dashed line noting August 1971, when the Federal Government terminated the Bretton Woods $35 gold peg, conveniently at the halfway mark in the chart’s timeline. I also placed two frequency tables for the before and after August 1971 weekly closing BEV values at the bottom of this chart.
One common assumption for gold, silver, and precious metal mining companies, is their valuations benefit from monetary inflation. But in the chart below we can disprove that assumption; as there was nothing more inflationary than what happened in August 1971; they took the dollar off the gold standard, and began inflating the US dollar, as seen in its balance sheet chart above.
Looking at the BGMI below, before August 1971, most of its weekly closes were above its BEV -40% line. After August 1971, most of its weekly closes were below its BEV -40% line. Now, look at the BGMI’s bear market bottoms before and after August 1971. During the Great Depression Crash; September 1929 to July 1932, the BGMI advanced towards new all-time highs the entire time, as everything else did just the opposite.
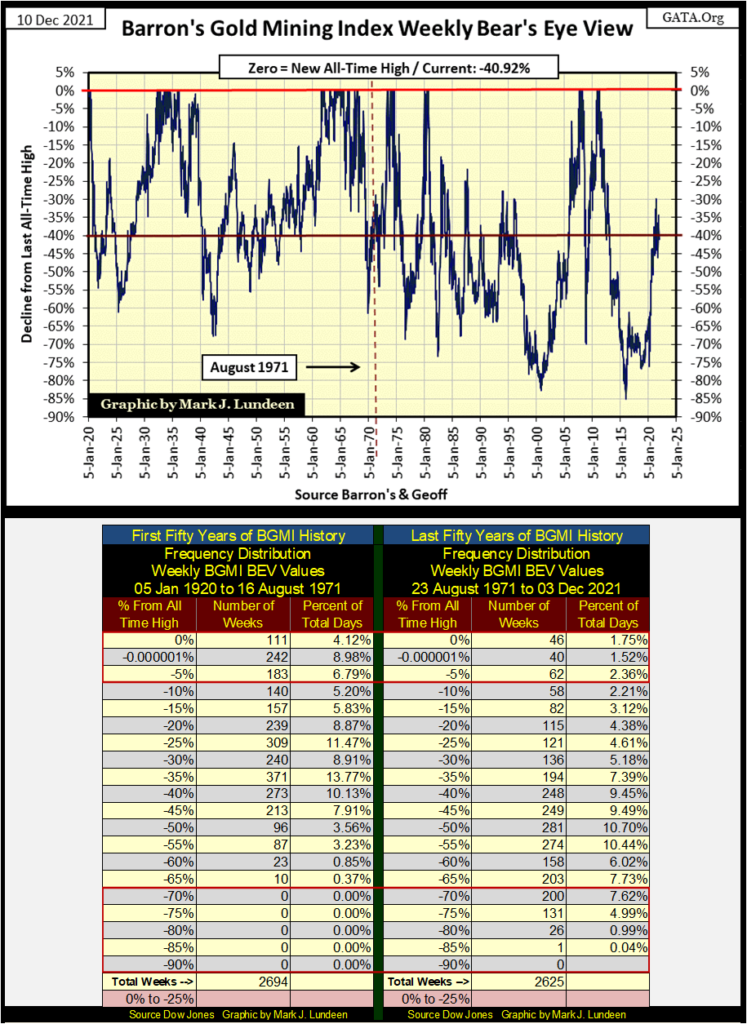
BGMI bear market bottoms following August 1971 dwarf those before it. The biggest market decline for the BGMI happened in January 2015, a whopping 85% decline from its highs of April 2011. It’s from this 85% bear market bottom that provides the context for our current bull market in precious metals. After seven years of recovering from the BGMI’s deepest bear market of the past 101 years, at the close of this week it is still 41% below its last all-time high of April 2011.
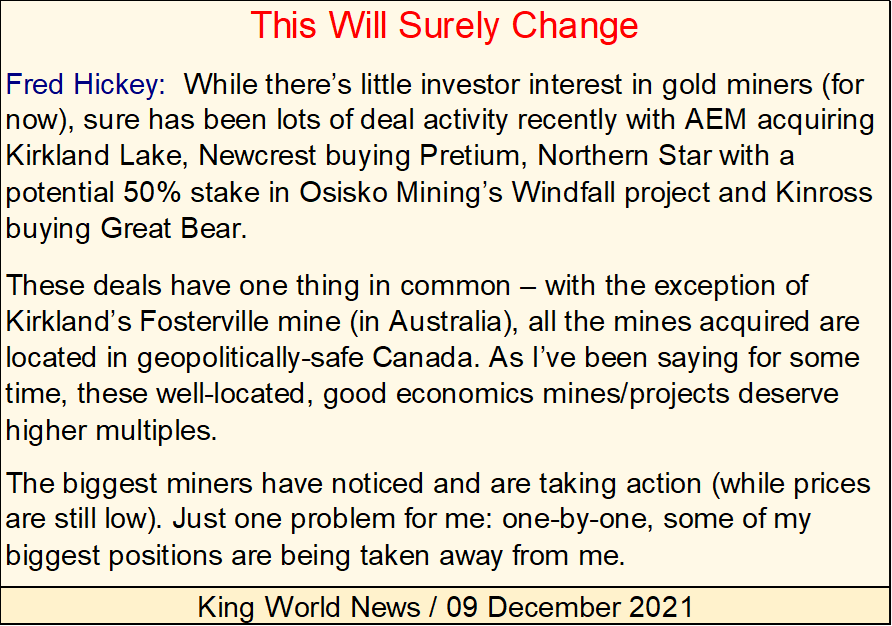
But behind the scenes, there is activity in the precious metal mining sector. King World News reported this week on December 9th some merger and acquisition activity in Canada.
The same can be said for silver, the only investment asset whose valuation remains 50% below its last all-time high, an all-time high that occurred in January 1980, forty years ago.
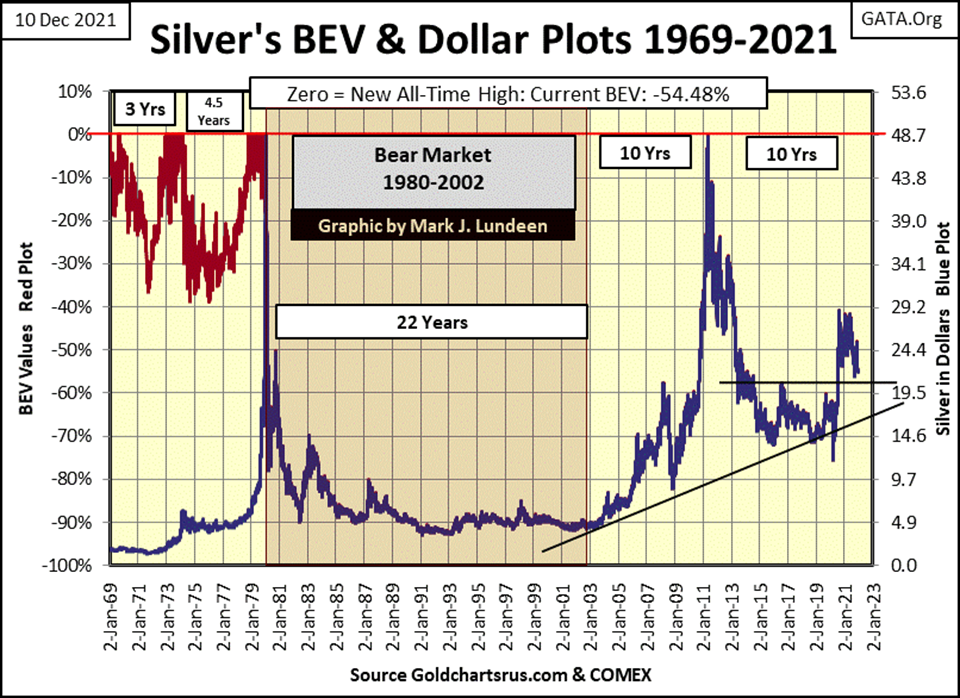
In December 2021, precious metal assets are not overvalued, but historically undervalued. Everything else in the market today is trading at bloated valuations, from decades of “liquidity injections”, and at-risk to massive deflation, as they were during the Depressing 1930s. I sleep easy at night knowing my wealth is in precious metal assets.
Speaking of behind the scene Canadian gold and silver mining activity, my favorite little exploration play: Eskay Mining, issued another press release this week on December 8th that apparently no one noticed.
But that isn’t true. I’m sure there are plenty of the big miners paying close attention to Eskay Mining’s press releases concerning their 2021 drilling program.
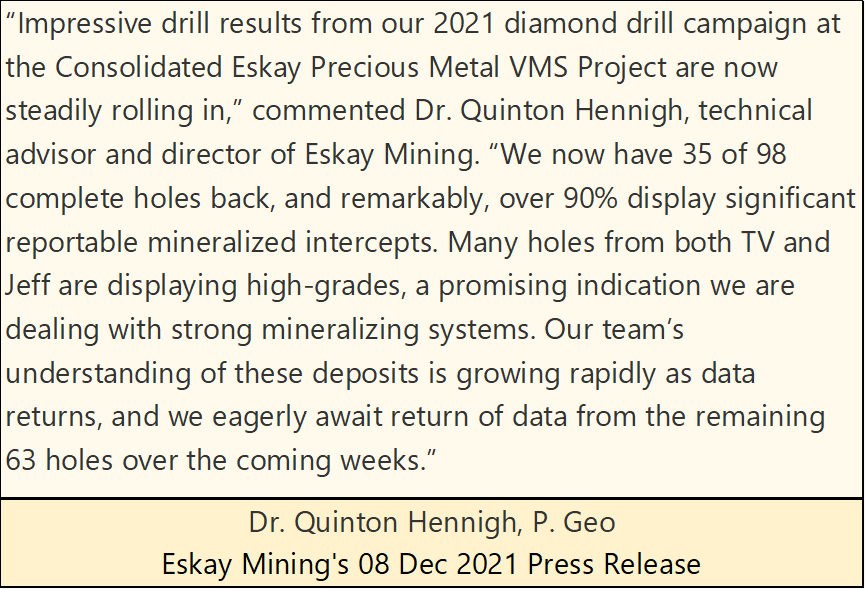
I’m no geologist. However, over the years I’ve seen many press releases from explorations companies I’ve speculated in. I can’t recall another company reporting 90% of the cores they’ve drilled for the season, coming back from the assay lab with “significant reportable mineralized intercepts.” That plus in the graphics used in the above press release, Eskay Mining’s TV and Jeff targets appear to be open in all direction, and may in fact prove to be continuous to each other.
Not always, but typically geologists choose their drilling targets to be larger than the anticipated mineralized ore bodies they’re seeking, expecting most of their drilling cores to be free of paydirt. They’re attempting to discover what they got, and where it’s located on their mining claim. Come the next season, they’ll then reduce the area to be drilled, attempting to better fix the location of the anticipated ore body.
Following the results of the 2020 and 2021 drilling program for Eskay Mining, they’ve shown that economic grades of gold and silver mineralization extends beyond the area company’s original targets, and drilling needs to be extended farther out for their 2022 season.
Anyway, from the standpoint of a retired Navy Chief Petty Officer, that is how I see it. What Dr. Hennigh actually plans to do for next year’s drilling season is most likely not even known to him, as at this time the company is still waiting for the assay results for an additional sixty-three holes of the ninety-eight drilled last summer. What a great problem for a geologist to have to have to struggle with!
Eskay Mining share prices went down on the release of this information. I had anticipated it would have seen a nice bump up in the market. But that didn’t happen. Which is a good thing for anyone thinking of investing in what I believe to be one of the most compelling precious metals plays of 2022.
But as made evident in the 101-year BEV chart for the BGMI, and silver going back to 1970 above; currently, fantastic investments in gold and silver mining are out of favor with managed money and individual investors.
* THIS TOO SHALL PASS *
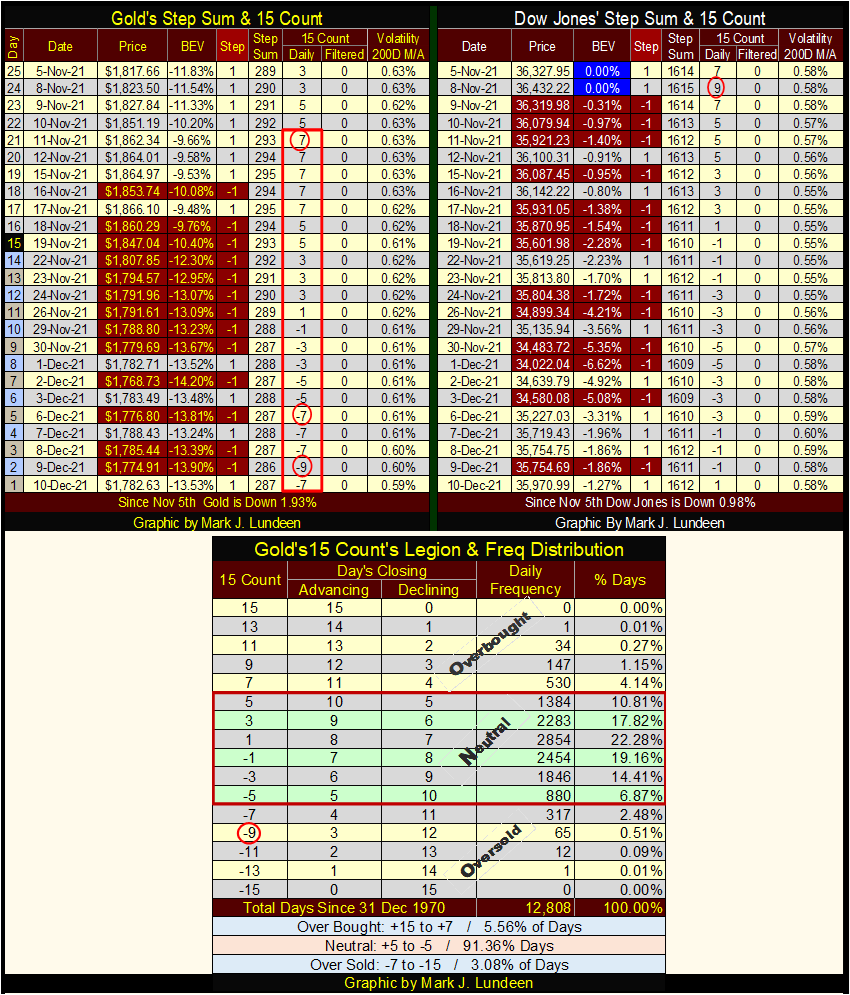
I’m going to skip my step sum charts for gold and the Dow Jones this week, and go straight to their step sum tables below.
On gold’s side of the table, we observe something not frequently seen, where gold’s 15-count went from overbought +7 on November 17th, down to a VERY oversold -9 on December 9th. That was a sixteen-day journey from one extreme market condition to the other.
What is also interesting about this sixteen-day journey, was the COMEX goon-squad failed to break the price of gold below its BEV -15% line. After all those red down days seen in gold’s table below, are the goons happy with the results of their efforts? We know they tried to create a selling panic in the COMEX paper-gold market – but so far have failed.
In the coming weeks, I wouldn’t be shocked should gold break down to even its BEV -20% line ($1642). I doubt that would happen. But keep in mind the “policymakers” and their goons, selling bogus digital gold by the tons at the COMEX are desperate to keep gold from breaking above its highs of last year; $2061.
If you are bullish on gold and silver, these guys want to hurt you bad. Look at what they did in the table above! But a selling climax as seen above, has an expiration date attached to it. How much more mindless selling can the goons continue doing? I don’t think they can keep this up for much longer.
Usually, seeing so many down days, and a 15 count of -9 is something I associate with a big-bear-market bottom, a strong indication a selling climax is in motion, or possibly just concluded.
The gold market now finds itself in a very interesting position as it approaches the end of 2021. Have the bears punched themselves out as the bulls played rope-a-dope with them? If so, we could see some explosive market action in the next few weeks.
That is especially so should the impact of China’s Evergrande massive debt default finally impact the big banks on Wall Street. Being long on glamor issues and debt, while being short on gold and silver will someday be something they regret.
—
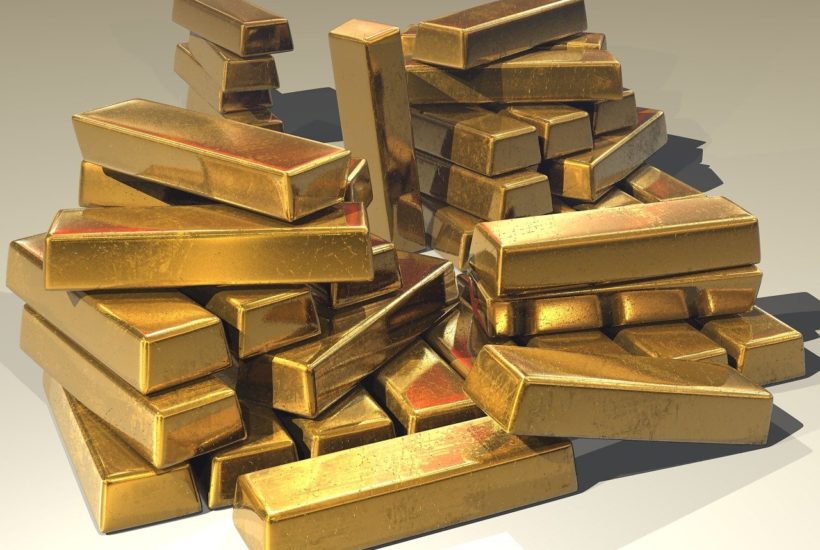
(Featured image by Stevebidmead via Pixabay)
DISCLAIMER: This article was written by a third party contributor and does not reflect the opinion of Born2Invest, its management, staff or its associates. Please review our disclaimer for more information.
This article may include forward-looking statements. These forward-looking statements generally are identified by the words “believe,” “project,” “estimate,” “become,” “plan,” “will,” and similar expressions. These forward-looking statements involve known and unknown risks as well as uncertainties, including those discussed in the following cautionary statements and elsewhere in this article and on this site. Although the Company may believe that its expectations are based on reasonable assumptions, the actual results that the Company may achieve may differ materially from any forward-looking statements, which reflect the opinions of the management of the Company only as of the date hereof. Additionally, please make sure to read these important disclosures.


Dolci Palmisano Issues Its First Minibond of the F&P “Rolling Short term” Program
Dolci Palmisano Srl issued its first €300K Short Term Minibond at 5.5%, fully subscribed on launch. Structured by Frigiolini &...

Bitcoin Traders on DEXs Brace for Downturn Despite Price Rally
Despite Bitcoin’s recent rally, over 70% of BTC options volume on DEXs like Derive.xyz are puts, signaling trader caution. Many...


Dow Jones Nears New High as Historic Signals Flash Caution
The Dow Jones is nearing a new all-time high despite past resistance, with a current BEV of -2.65%. A potential...


Stock Markets Surge Amid Global Uncertainty, But Storm Clouds Loom
The stock market hit new highs despite global tensions, with the S&P 500, NASDAQ, and TSX leading. Oil collapsed amid...


The TopRanked.io Weekly Digest: What’s Hot in Affiliate Marketing [NordVPN Affiliate Program Review]
There's a bit of a vibe in the EU right now that's slowly taking hold of everyone, from everyday consumers...
 |
|
 |  |
 |
|
-
 Markets2 weeks ago
Navigating the Fourth Turning: Cycles of Crisis and Opportunity
-

 Cannabis4 days ago
Is Aurora Cannabis Stock a Risk Worth Taking?
-

 Impact Investing2 weeks ago
EU Eases CO2 Tax Burden on SMEs with Revised CBAM Rules
-
 Business6 days ago
America’s Debt Spiral: A $67 Trillion Reckoning Looms by 2035