Markets
Silver Dips Sharply, While Gold Gains Amid Mixed Stock Market
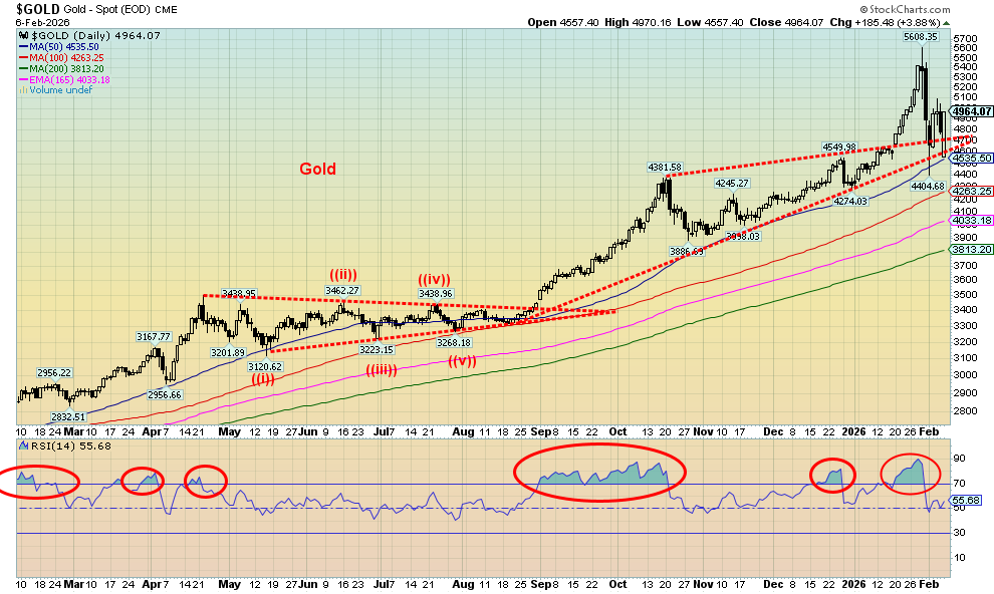
Silver plunged sharply last week, potentially testing $50 after a low of $63.99, though recovery is likely but slow. Gold and gold stocks gained, showing possible positive divergences. Stock indices were mixed, with DJI and DJT up, S&P and NASDAQ down. U.S. jobs delayed by shutdown; Canada’s report mixed. Market trends remain under observation.

Much has been written about the silver slaughter of January 30th, 2026. That day, silver fell a mind-boggling 27%. Altogether, the decline from top to bottom (to date) was 41.4%. In a nanosecond, silver went from a bull market to a bear market with nothing in-between. Gold was hit as well but to date its decline is only 21.5%. That’s also a bear market. The change from bull to bear was as dramatic as anything we’ve ever seen.
There were the triggers. The Chicago Mercantile Exchange (CME) changed margin requirements again, catching many offside and facing margin calls. Forced selling, stop-loss selling, and evidence that the bullion banks piled on as they were short exacerbated the decline. Bond yields were sticky to the upside, especially in Japan, the U.S. dollar strengthened off recent lows, and trading was thin with buyers quickly dropping bids. This was, as many noted, a technical crash, not a fundamental one.
Physical tightness remains: mine supply remains down while demand is high, particularly for industrial use. Silver is being named as a critical metal. Spreads between paper silver and physical silver widened. Paper silver outnumbers physical silver by an estimated margin of 350:1. Some say it’s even higher.
Nonetheless, crashes like this are not finished in a day or two. Typically, they could last for days, weeks, or even months before we begin the next leg up. It could also be a corrective wave up. That high of $121.64 could be it for some time. Not until we make new highs could we call this bear market truly over. At this time, we’d have to take out $110 just to suggest possible new highs ahead. Silver hit new lows. Gold did not. A divergence? We consider $70 support for silver. If that breaks, the next good support doesn’t come in until around $55. A test of the major $50 breakout? Yes, that is possible.
Given the big drop for gold and silver, one would expect the gold stocks to have been slaughtered. The TSX Gold Index (TGD) fell 17%, the Gold Bugs Index (HUI) dropped 18.7%, the Van Eck Gold Miners ETF (GDX) fell about 19%, the Van Eck Junior Gold Miners ETF (GDXJ) fell 20.6%, and the Global X Silver Miners ETF (SIL) fell 23.4%.
What gives? Silver gets slaughtered 41% but the Silver Gold Miners (SIL) falls only 23.4%? Aren’t the stocks (paper) supposed to outperform to both the upside and downside? Maybe the gold and silver stocks didn’t believe the drop in the metals. Granted, on the other side, silver had gained 390% from 2024 to the recent peak vs. a gain for SIL of only 318%. But gold gained 163% while the GDX was up 269% and GDXJ was up 316%. Spectacular gains for all. But it was only silver that outperformed everyone, primarily because of shortages and demand for physical silver.
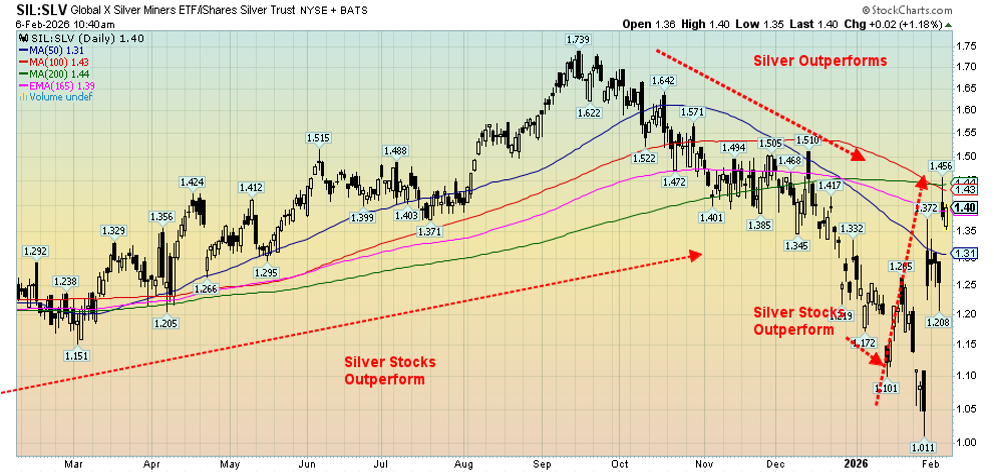
An interesting way to look at this is a ratio chart. In this chart we show the Silver Miners (SIL) to the Silver Trust (SLV) ratio going back to 2011.
Global Silver Miners (SIL)/iShares Silver Trust (SLV) Ratio 2011–2026
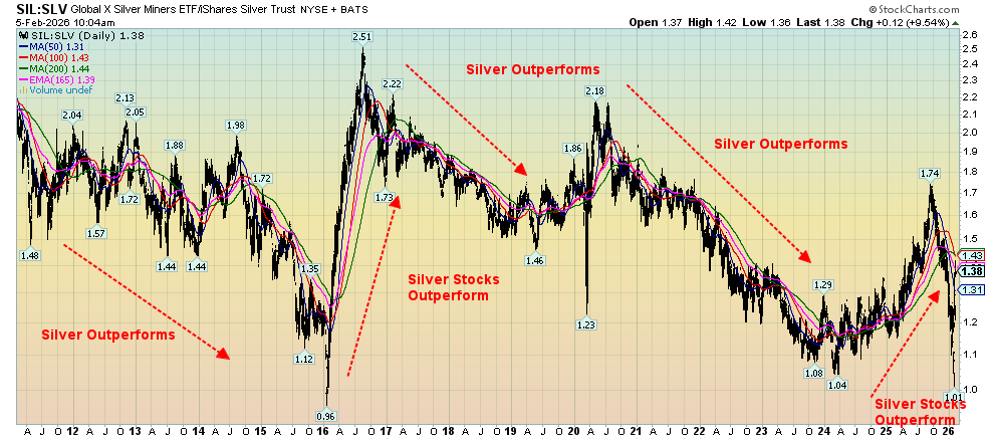
During this period, silver outperformed in bear or down markets while the silver stocks outperformed in bull up markets. The ratio peaked in September 2025 at 1.74 and from September to January 29, 2026, silver was outperforming the silver stocks. But the crash on January 30, 2026, changed everything. Since then, the ratio has climbed back up to 1.38, indicating that since the crash the stocks have been outperforming.
We view the silver stocks hanging in this well against the silver price as positive going forward. But as indicated, this corrective period could last days, weeks, or longer. The fundamentals remain the same as they were when we rose from $21.91 low in early 2024 to the $121.63 peak.
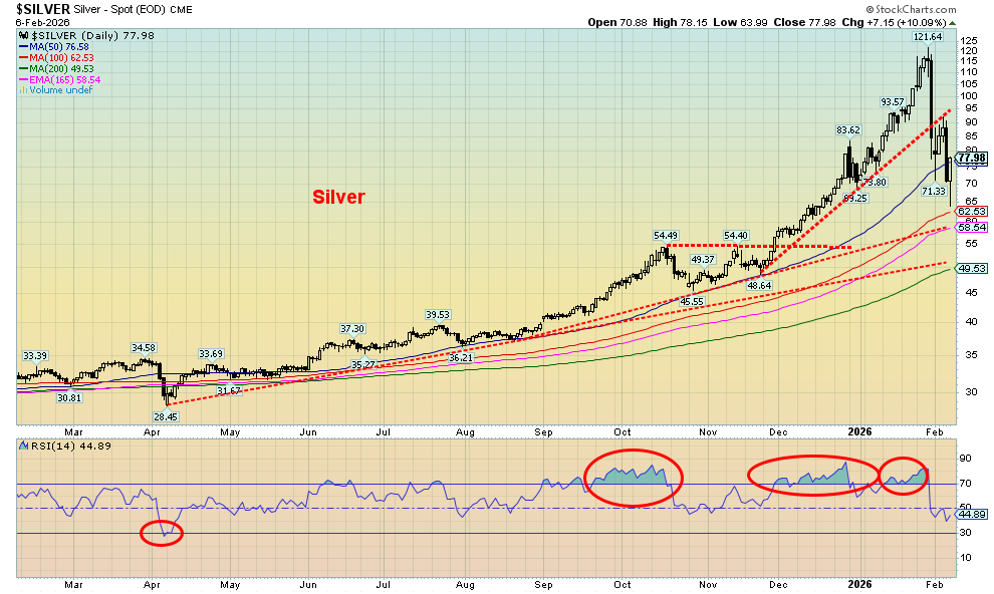
Silver has good support down to $58/$62 if the recent low at $71.33 fails. What really caught our eye is that since that high on January 29 (low for the SIL/SLV ratio), the silver stocks caught a bid even as silver itself was plunging. We took the same SIL/SLV chart and shortened the time frame to show how silver stocks outperformed from January 30. A positive divergence indicates that maybe this massive sell-off won’t last too long. Needless to say, the sell-off isn’t over until gold, silver, gold, and silver stocks are making new highs together. Anything else should be viewed with some suspicion.
The bull market for gold, silver, the gold/silver stocks, many other precious metals, and even near precious metals this past year or so has been nothing short of spectacular. As we’ve so often noted, they are rising because of geopolitical concerns, domestic (U.S.) political concerns, massive amounts of debt everywhere that are threatening a sovereign debt crisis, and sticky interest rates, particularly at the long end of the yield curve that remains above what we had become accustomed to. The Fed can cut rates all they want, but it’s the bond market that rules.
We live in dangerous times.
Stocks
Is the stock market breaking down? Many will be asking that question – just as many may be busy buying the dip as they have done constantly over the past few years since the current bull got underway, after the 2022 inflation low. After all, companies are still reporting good earnings. Indeed, earnings have hit record levels. Some have even raised their dividends.
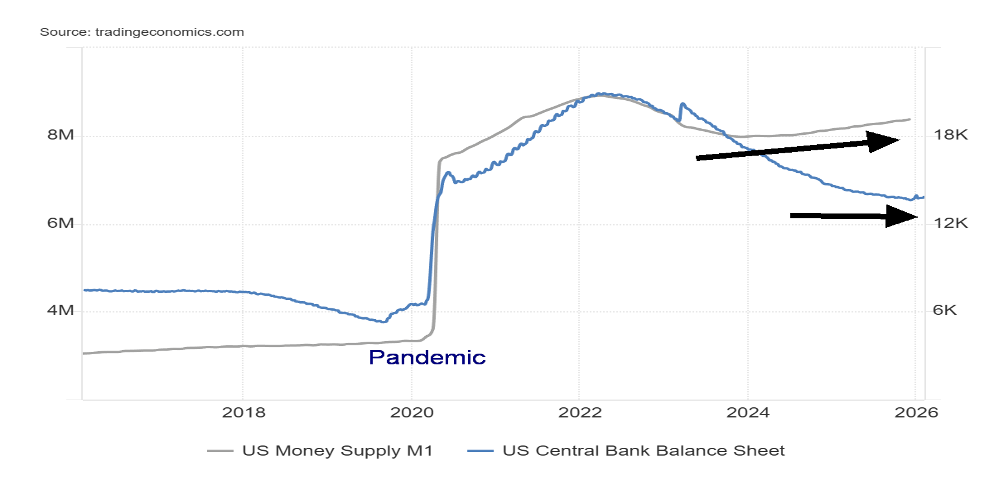
The stock market has been favoured with falling interest rates and the Fed is stimulating again as they buy up $40 billion monthly from the banks and others, thus putting oodles of money back into the financial system. Yes, M1 has been expanding as is the Fed balance sheet. Sharply rising P/E multiples, record price to sales, record price to book – we could go on. Money in the pockets of the banks, dealers, and hedge fund managers is magic for the stock market. The rest is just noise. Until it isn’t. No, this time is not different.
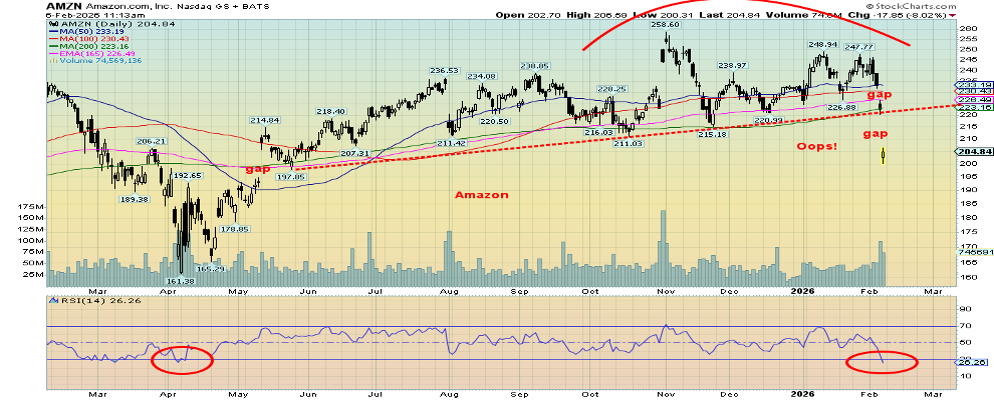
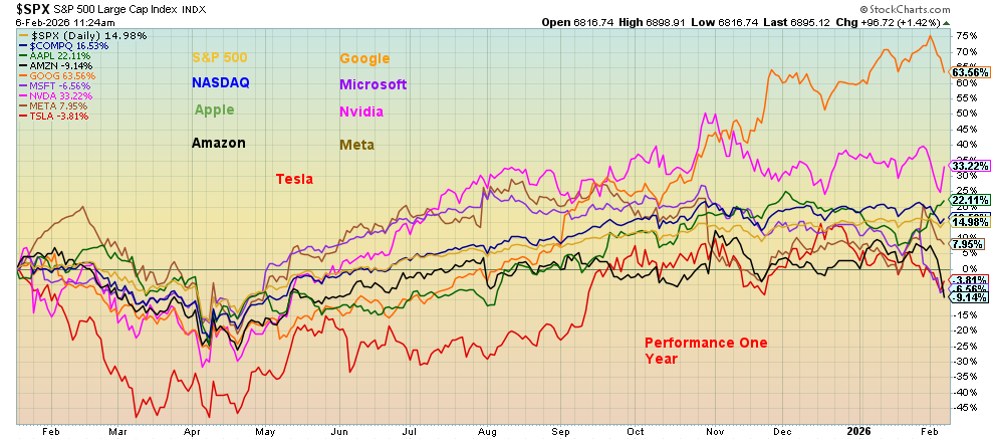
Amazon has been one of the poster children for the MAG7. Amazon’s CEO, Jeff Bezos, is also a favourite of President Trump. But is Amazon’s party over? Those gaps down look like a serious “oopsy.” If Amazon has problems, the other MAG7 stocks could follow. Google has been the big star, but we note that besides Amazon, Microsoft and Tesla are now down on the year. Nothing magnificent about them. Some of the others are rolling over. The MAG7 led the way up. Could they lead the way down? This past week alone saw six of the MAG7 down on the week with only Apple up.
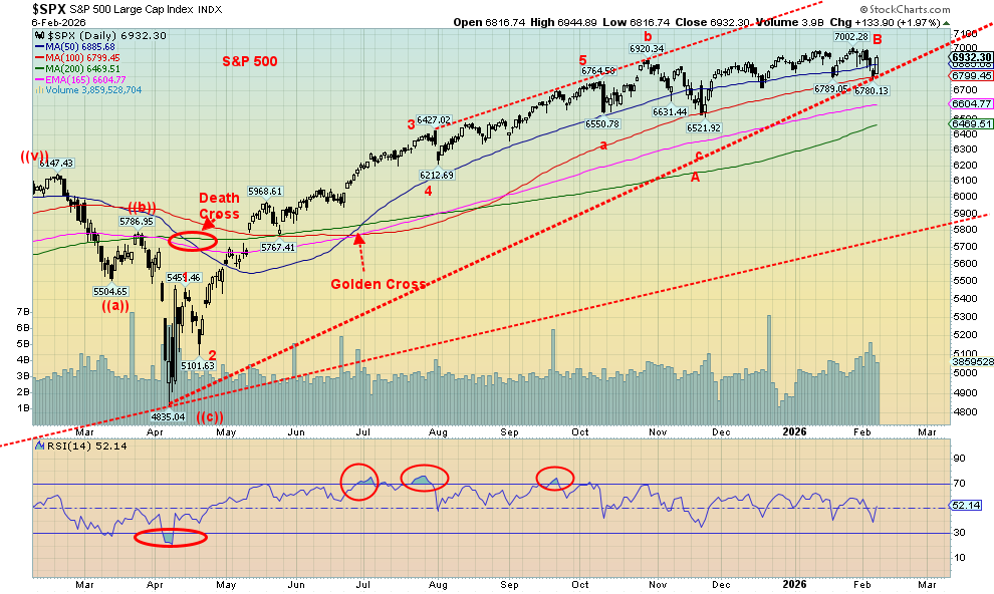
The market has looked toppy for some time. The indices appear to be poised to fall. That alone does not a bear market make. That 6,500 zone for the S&P 500 remains key. If it breaks, then there is trouble. Under 6,200, trouble really gets underway. Complacency is not an option. Consumer sentiment seems to get it, while the stock market still lives in nirvana – but for how much longer?
Fed Balance Sheet and M1 2016-2026
If there was any room for optimism we can’t help but note that both the Dow Jones Industrials (DJI) and the Dow Jones Transportations (DJT) not only finished the week up but both made all-time highs. On Friday the DJI was up a spectacular 1,200 points crossing and closing over 50,000 for the first time ever.
Others also joined the party with the NYSE, the Dow Jones Composite (DJC), the S&P 400 (Mid), and the S&P 600 (Small) all making new all-time highs. Notably the Russell indices (1000, 2000, 3000) nor the Wilshire 5000 did not join the party. DJI, DJT all rising making new highs together? Dow Theory says the indices must confirm each other. They did. So are we topping, or just another pause.
US Job Numbers
What job numbers. Once again, due to a government shutdown, the U.S. job numbers were not released on February 6, 2026, as originally planned. Instead, they are coming out on February 11, 2026 (we hope). In the interim, all we have are the ADP employment change report and Challenger Job Cuts.
U.S. ADP Employment Change, Challenger Job Cuts 2021–2026
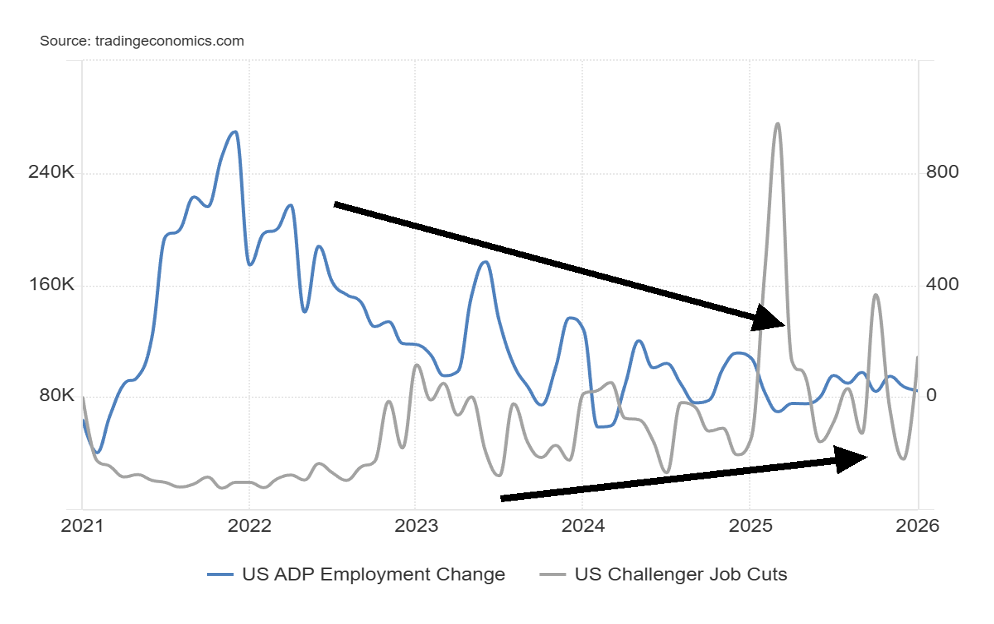
The ADP National Employment Report is an independent measure of the labour market, based on the anonymized weekly payroll data of more than 26 million private-sector employees in the United States. ADP’s Pay Insights captures over 15 million individual pay change observations each month.
The ADP report for January came in at 22,000, below December’s 37,000 and below the expected 35,000–48,000.
Challenger job cuts are based on U.S. employers’ reports of hiring.
Challenger job cuts for January came in at 108,435, well above the previous 35,553 and above the consensus of 43,000. Challenger Job Cuts have been rising while ADP employment change has been falling, suggesting a potentially weak nonfarm payroll which we hope to get next week.
Canada Job Numbers
Canada Job Numbers and Unemployment Rate 2021-2026
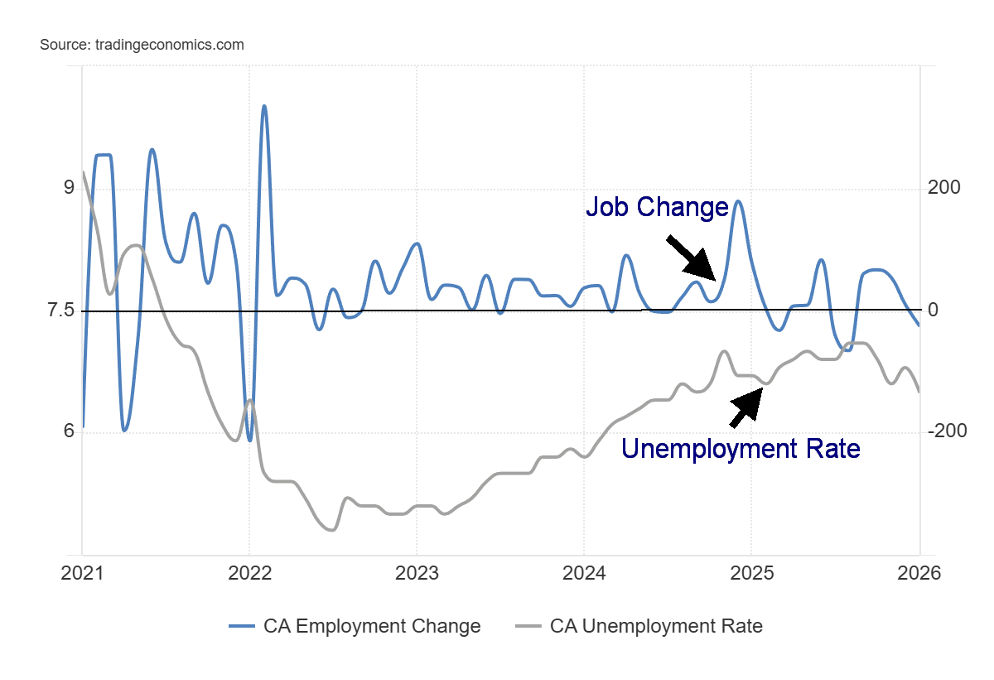
Employment in Canada fell some 24,800 in January 2026. That followed a 10,100 gain in December and expectations of a gain of 7,000. The unemployment rate fell to 6.5% from 6.8%. Not so good the job losses but the unemployment rate fell. The good news is that full-time employment increased 44,900 while part-time employment fell 69,700.
While the drop in the unemployment rate was touted it also highlighted that fewer people were actively looking for work. We note as well that population levels have also decreased over the past few months due to loss of non-permanent residents, international students, temporary foreign workers all or at least some who might have been considered a part of the labour force. There has also been a rise in workers 65 years and older and an increase in retirees none who would now be considered a part of the labour force.
The labour force participation rate fell to 65.0% from 65.4% while the employment population ratio dropped to 60.8 from 60.9. Fewer people in the labour force helps lower the unemployment rate. Manufacturing losses were the largest factor (Ontario auto industry – thanks to tariffs) but Canada also saw job losses in education and public administration. Alberta fared the best and Ontario the worst. Best gains were seen in information, culture and recreation.
The question now is will this spark the Bank of Canada (BofC) to lower interest rates further? Next interest rate decision is not due until March 18. Many are betting that the BofC’s hands may be tied going forward depending on what the Fed might do and still sticky inflation. The current situation certainly would not justify the BofC’s rate where it was during the pandemic 2020-2022.
The employment report was a very mixed bag, and a few data pieces were not yet available.
Markets and Trends
| % Gains (Losses) Trends | ||||||||
| Close Dec 31/25 | Close Feb 6/26 | Week | YTD | Daily (Short Term) | Weekly (Intermediate) | Monthly (Long Term) | ||
| S&P 500 | 6,845.50 | 6,932.30 | (0.1)% | 1.3% | up | up | up | |
| Dow Jones Industrials | 48,063.29 | 50,115.67 (new highs) * | 2.5% | 4.3% | up | up | up | |
| Dow Jones Transport | 17,357.19 | 19,892.36 (new highs) * | 8.7% | 14.6% | up | up | up | |
| NASDAQ | 23,241.99 | 23,031.21 | (1.8)% | (0.9)% | up | up | up | |
| S&P/TSX Composite | 31,712.76 | 32,470.98 | 1.7% | 2.4% | up | up | up | |
| S&P/TSX Venture (CDNX) | 987.74 | 1,015.34 | (3.4)% | 2.8% | up | up | up | |
| S&P 600 (small) | 1,467.76 | 1,610.32 (new highs) * | 4.0% | 9.7% | up | up | up | |
| ACWX MSCI World x US | 67.18 | 72.06 (new highs) * | 1.8% | 7.3% | up | up | up | |
| Bitcoin | 87,576.98 | 70,045.02 | (16.5)% | (20.0)% | down | down | neutral | |
| Gold Mining Stock Indices | ||||||||
| Gold Bugs Index (HUI) | 701.49 | 806.53 | 3.2% | 15.0% | up (weak) | up | up | |
| TSX Gold Index (TGD) | 817.76 | 923.70 | 3.2% | 13.0% | neutral | up | up | |
| % | ||||||||
| U.S. 10-Year Treasury Bond yield | 4.17% | 4.21% | (0.9)% | 1.0% | ||||
| Cdn. 10-Year Bond CGB yield | 3.44% | 3.40% | (0.6)% | (1.2)% | ||||
| Recession Watch Spreads | ||||||||
| U.S. 2-year 10-year Treasury spread | 0.69% | 0.71% | (1.4)% | 2.9% | ||||
| Cdn 2-year 10-year CGB spread | 0.85% | 0.85% | (1.1)% | flat | ||||
| Currencies | ||||||||
| US$ Index | 98.26 | 97.61 | 0.5% | (0.7)% | down (weak) | down | down | |
| Canadian $ | 72.87 | 0.7323 | (0.3)% | 0.5% | up | up | neutral | |
| Euro | 117.48 | 118.24 | (0.2)% | 0.7% | up | up | up | |
| Swiss Franc | 126.21 | 128.98 | (0.3)% | 2.2% | up | up | up | |
| British Pound | 134.78 | 136.20 | (0.5)% | 1.1% | up | up | up | |
| Japanese Yen | 63.83 | 63.65 | (1.5)% | (0.3)% | down (weak) | down | down | |
| Precious Metals | ||||||||
| Gold | 4,311.97 | 4,954.68 | 2.1% | 14.9% | up | up | up | |
| Silver | 71.16 | 77.52 | (7.9)% | 8.9% | down (weak) | up | up | |
| Platinum | 124.81 | 2,097.00 | (2.1)% | 2.5% | down (weak) | up | up | |
| Base Metals | ||||||||
| Palladium | 1,619.50 | 1,716.00 | 2.7% | 6.0% | down (weak) | up | up | |
| Copper | 5.64 | 5.88 | (1.0)% | 4.3% | up (weak) | up | up | |
| Energy | ||||||||
| WTI Oil | 57.44 | 63.52 | (3.4)% | 10.6% | up | up (weak) | down | |
| Nat Gas | 3.71 | 3.41 | (22.2)% | (8.1)% | down | up | up | |
__
(Featured image by Scottsdale Mint via Unsplash)
DISCLAIMER: This article was written by a third party contributor and does not reflect the opinion of Born2Invest, its management, staff or its associates. Please review our disclaimer for more information.
This article may include forward-looking statements. These forward-looking statements generally are identified by the words “believe,” “project,” “estimate,” “become,” “plan,” “will,” and similar expressions, including with regards to potential earnings in the Empire Flippers affiliate program. These forward-looking statements involve known and unknown risks as well as uncertainties, including those discussed in the following cautionary statements and elsewhere in this article and on this site. Although the Company may believe that its expectations are based on reasonable assumptions, the actual results that the Company may achieve may differ materially from any forward-looking statements, which reflect the opinions of the management of the Company only as of the date hereof. Additionally, please make sure to read these important disclosures.
Copyright David Chapman 2026
David Chapman is not a registered advisory service and is not an exempt market dealer (EMD) nor a licensed financial advisor. He does not and cannot give individualised market advice. David Chapman has worked in the financial industry for over 40 years including large financial corporations, banks, and investment dealers. The information in this newsletter is intended only for informational and educational purposes. It should not be construed as an offer, a solicitation of an offer or sale of any security. Every effort is made to provide accurate and complete information.
However, we cannot guarantee that there will be no errors. We make no claims, promises or guarantees about the accuracy, completeness, or adequacy of the contents of this commentary and expressly disclaim liability for errors and omissions in the contents of this commentary. David Chapman will always use his best efforts to ensure the accuracy and timeliness of all information. The reader assumes all risk when trading in securities and David Chapman advises consulting a licensed professional financial advisor or portfolio manager such as Enriched Investing Incorporated before proceeding with any trade or idea presented in this newsletter.
David Chapman may own shares in companies mentioned in this newsletter. Before making an investment, prospective investors should review each security’s offering documents which summarize the objectives, fees, expenses and associated risks. Although Artificial Intelligence (AI) may be deployed from time to time, AI output is monitored and adjusted, if necessary, for accuracy. David Chapman shares his ideas and opinions for informational and educational purposes only and expects the reader to perform due diligence before considering a position in any security. That includes consulting with your own licensed professional financial advisor such as Enriched Investing Incorporated. Performance is not guaranteed, values change frequently, and past performance may not be repeated.


The TopRanked.io Weekly Digest: What’s Hot in Affiliate Marketing [++ KuCoin Affiliate Program Review]
X now allows people to block certain topics from their feed. This week, we're going to tell you how to...


Hotel Stay Project Supports Wildlife Conservation in Japan
Iwate Prefecture launched a project linking hotel stays to conservation through Morioka Zoological Park Zoomo. A themed room at Yunomori...


Bitcoin Leads Modest Crypto Rebound Amid Mixed Signals
Bitcoin rose 2 percent to above 77000 as ETFs saw 15 million inflows and April gains of 12.2 percent. Ethereum...


Major Pharma Advances: EU Approvals, Vaccine Progress, and Breakthrough Clinical Results
Johnson & Johnson has EU approval for nipocalimab for generalized myasthenia gravis, showing superior control and sustained benefits. Sanofi reported...


Agential Cannabis 2026 to Drive APAC Market Growth and Global Industry Collaboration
Agential Cannabis 2026 will take place September 23–24 in Bangkok, bringing global experts together to advance the APAC medical cannabis...
 |
|
 |  |
 |
|
-

 Cannabis2 weeks ago
Misiones to Close State Cannabis Firm to Cut Costs and Boost Efficiency
-

 Biotech2 days ago
Johnson & Johnson Expands U.S. Biomanufacturing Amid Policy Shifts and Rising Demand
-

 Crowdfunding1 week ago
Pelorias Sea Sound 2026 Launches Community-Driven Crowdfunding Campaign
-

 Markets4 days ago
Markets Rally Amid War Strains and Blockade Uncertainty