Business
Why small caps and value stocks appear to be now outperforming
The COVID-19 rampages on. The building constitutional crisis in the U.S. rages on. And the markets continue to “make” what appears to be a topping pattern. We say “make” because until it is confirmed it remains a calculated possibility. Stimulus programs appear dead in the water as long as the presidential dispute continues. Even the Fed and the U.S. Treasury are at odds.

$19.5 trillion. That is what governments and central banks have apparently spent to “put a floor under the world economy” according to the IMF www.imf.org. The numbers are to the end of September 2020. At $19.5 trillion that is almost the GDP of the U.S. estimated at $21.3 trillion. It is made up of $12 trillion in government stimulus money and $7.5 trillion from the central banks led by the Fed who alone has pumped out some $2.9 trillion since March 2020. Here in Canada, the Federal government has pumped out at least $350 billion in stimulus and the BofC has provided about the same in QE stimulus.
And what is the result? Well the U.S. economy still contracted 2.9% in Q3 and is expected to finish the year contracting 4.6%. Canada contracted 13.0% in Q2 (latest available) and is expected to end 2020 contracting 5.8%. With stimulus cheques and support ending in the U.S. in December coupled with no new stimulus on the horizon, there could be further economic bombs to go off. The Fed will continue its bond-buying (QE) but even that appears to have stalled out. Or will they? We have learned that the U.S. Treasury under Steve Mnuchin have ordered the Fed to not extend several lending facilities and to return unused stimulus funds. This has sparked a rare rebuke from the Fed and suggests the potential for open conflict between the Fed and the U.S. Treasury. How will that impact what has been QE4?
The stimulus programs all but dead. The Cares Act is expiring in December and no sign it will be renewed. Open warfare between the Fed and U.S. Treasury. None of that bodes well for the millions of unemployed, and those barely surviving. No wonder in what is beginning to look like a repeat of the Great Depression the U.S. is seeing long lines at food banks. And the food banks are running out of food.
Canada is continuing its support programs. As to the stock market well the S&P 500 is up about 65% from the March 2020 low and the TSX Composite is up about 52%. The K recovery. Wall Street a V recovery; Main Street an L no recovery.
So, what does all of this mean against the backdrop of a raging pandemic and a president who continues to claim that the election was rigged, it was stolen and refuses to concede even as virtually all of their lawsuits have been tossed out by the courts? There is a risk that governments worried about the growing debt load will pull back too soon. Pulling back too soon would unleash all sorts of problems with evictions, homelessness etc. It would be self-defeating. It would also leave any stimulus up to the central banks. Except central bank stimulus does not reach into Main Street and winds up mostly with Wall Street. The K recovery.
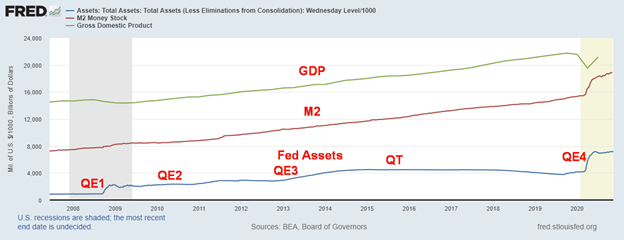
Our chart shows the growth of U.S. GDP, M2 and Fed Assets since the financial collapse of 2008. We note that while M2 continues to grow up $845 billion since June 2020, Fed assets have effectively flat lined in the same period. GDP numbers only go to the end of Q2. U.S. debt is up $1.5 trillion since June 2020.
U.S. GDP, M2 and Fed Assets 2008 – Present
A vaccine is coming. Pfizer and Moderna both have a vaccine and there may be one developed in Asia as well. But realistically it could be late Q1 or even later before something is more widely available. And even then, how much will be available and who gets it first? Their sample sizes are also not that large so how might it perform on a wider population? Canada and the U.S. alone are some 370 million people. But markets loved it. At least briefly as there was a rotation rally out of stay-at-home stocks to get-out-and-about stocks. Banks, industrials, energy, consumer discretionary all benefitted. Golds, materials and consumer staples not so much. Markets rallied, then faded. The November 9 highs remain mostly in place. Value stocks benefitted more than growth stocks. Previous underperforming stocks became the best performers. And large cap stocks have underperformed small cap stocks.
Relative Performance Large Cap Stocks S&P 500/Small Cap Stocks S&P 600
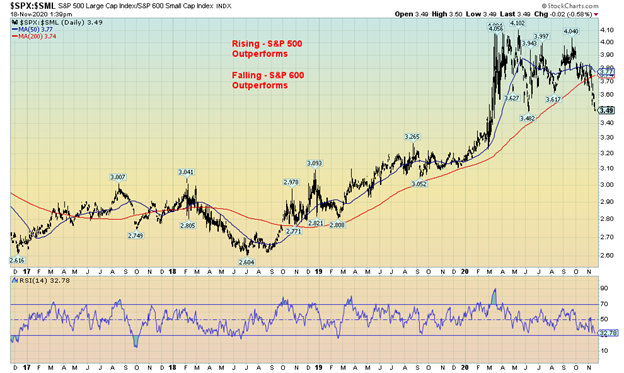
The ratio is approaching oversold so there is a question as to how lower it can go. The 50-day MA has not yet crossed over the 200-day MA. While the big 5 stocks in the S&P 500 – Apple, Amazon, Microsoft, Google and Facebook – have been the big performers, there performance of late has been as laggards. At the September peak they represented 25% of the S&P 500. It’s a bit less now as they have underperformed since then.
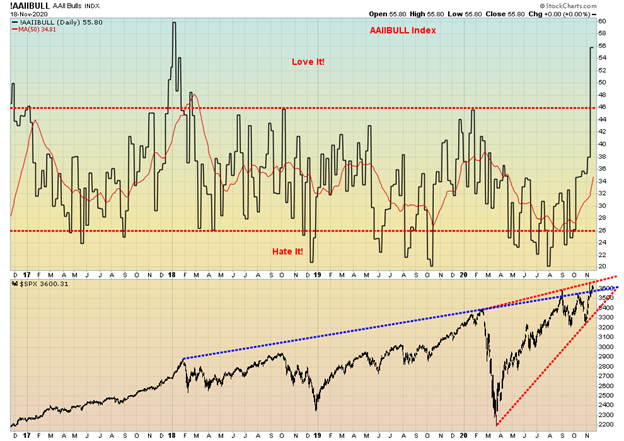
Numerous indicators keep pointing this market higher such as the advance decline line. But sentiment indicators are indicating caution. We have often noted the put/call ratio that has remained at or near record territory in favour of call options. But now bullish sentiment has leaped to a level not seen since the peak in January 2018. Below is what is known as the AAII Bullish Sentiment Index showing the percentage who are bullish. We do note the peak of the AAII came before the final top so it may be that this market does have some room to move higher before it peaks. But it is a warning sign along with the record put/call ratio in favour of calls. The question is where are the bears if everyone is bullish?
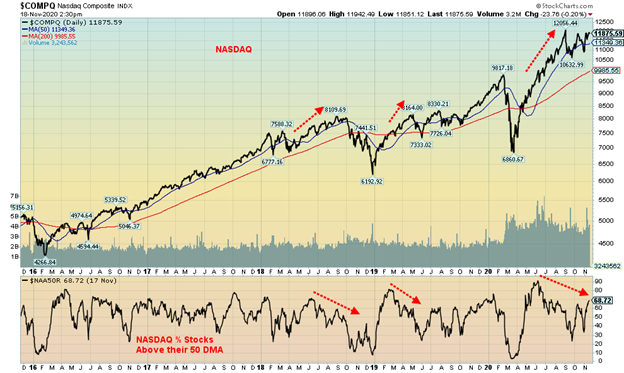
Something else we are noting is where is the participation. The chart below shows the NASDAQ above and below is the NASDAQ Percent of Stocks Above the 50-day MA. The NASDAQ may be moving higher or is at least back near its all-time highs but the percentage of stocks above the 50-day MA is less than it was earlier. This is a divergence that possibly we shouldn’t ignore. We are seeing a similar one with the S&P 500. What it means is that the markets are at/making all-time highs but the participation is less.
Something else we are seeing is in the SentimenTrader’s “Smart Money” and “Dumb Money” Confidence measures. What it is signaling is that the smart money – large institutional, commercials etc. are becoming less confident with the market even as the small speculators and traders remain highly confident. This is not a lot different than the COT reports we show on gold and silver.
Smart Money Dumb Money Confidence Sentiment Indicator

Thrown into all of this mix is the uncertainty surrounding the election. There continues to concern that the process could descend into constitutional mayhem. In a recent report from Michael Cembalist, chairman of market and investment strategy for J.P. Morgan he warned there is a remote risk of a constitutional crisis. Cembalist noted the recent firing of the Homeland Security Chris Krebs who contradicted Trump by refuting his claims of election fraud, Attorney General William Barr’s authorizing prosecutors to probe alleged fraud and a short-lived drama over certifying election results in Michigan (now certified).
Reality is that Trump would have to turn over three states including Pennsylvania to flip the electoral college vote. There is concern that one or more states might submit competing slates of electors for the electoral college. There is also concern that a move could be made to have the Electoral Count Act of 1887 declared unconstitutional and then have three states flipped. Dueling inaugurations? The result would most likely be a falling U.S. dollar, a falling stock market and rising gold prices. Wall Street still is basing their decision making that the election will proceed and Joe Biden will be inaugurated on January 20, 2021. In the interim Trump has continued to stonewall Biden’s transition.
“I’ve never seen a particular situation during my professional experience anything like this,”
- Alan Greenspan, American economist, Chair of Federal Reserve 1987-2006, Chair Greenspan Associates LLC: said to CNN’s Julia Chatterley on show First Move November 19, 2020; b. 1926
Chart of the Week
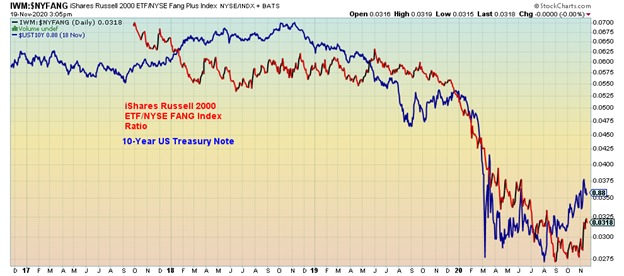
The announcements by Pfizer and Moderna have sparked what appears to be a rotation between value stocks and growth stocks. Retail, banks, energy and industrials are considered value plays whereas technology would be considered a growth play. Our charts above show first a comparison between iShares Russell 2000 ETF (IWM) (a proxy for the Russell 2000 small cap index) and the NYSE FANG Index (FANG) ratio and the U.S. 10-year treasury note. Both of them have recently started to rise breaking a long downtrend. The iShares Russell 2000 ETF represents small-cap stocks that appear to be now outperforming the NYSE FANG Index. Interest rates rise as the economy improves and the investing community moves into the small-cap sector. (see also Alpine Macro www.alpinemacro.com for further references on this based on a presentation they made on November 18, 2020).
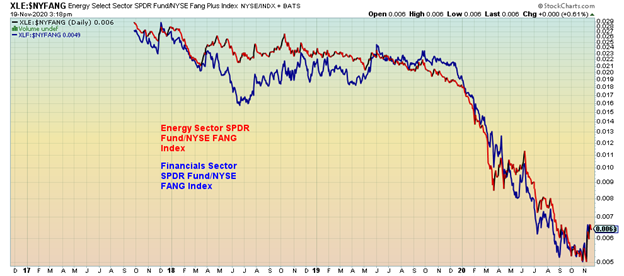
The second chart is similar comparing the Energy Sector SPDR Fund (XLE) with the NYSE FANG Index and the Financials Sector SPDR Fund (XLF) and the NYSE FANG Index. Both of them also appear to be breaking a long downtrend suggesting a shift away from growth (NYSE FANG Index) and a move into Energy and Banks both value sectors.
While the move is encouraging for value stocks the result so far is inconclusive. Corrective moves within the context of a bear market are not unusual. The same with interest rates where signs of improvement in the economy might spark a near term rise in yields. Is this merely a bear market bounce? Or is it the start of a new trend? A period is needed with no new lows. The short-term trends have turned up but the intermediate and long-term trends are still pointed down although the intermediate is now considered a weak downtrend. While the evidence certainly suggests there is a shift going on and the presence of a vaccine will certainly help until this up move is confirmed and a vaccine is confirmed to start caution should be exercised since the up move so far is based on limited observations. What it is all suggesting is that it will be a V bottom for value vs. growth. Typically, however, bottom formations take some time to form. Rounded bottoms or patterned bottoms (i.e. a head and shoulders pattern, double bottoms etc.) are more common than V bottoms.
MARKETS AND TRENDS
| % Gains (Losses) Trends | ||||||||
| Close Dec 31/19 | Close Nov 20/20 | Week | YTD | Daily (Short Term) | Weekly (Intermediate) | Monthly (Long Term) | ||
| Stock Market Indices | ||||||||
| S&P 500 | 3,230.78 | 3,557.54 | (0.8)% | 10.1% | up | up | up | |
| Dow Jones Industrials | 28,645.26 | 29,263.48 (new highs) | (0.7)% | 2.5% | up | up | up | |
| Dow Jones Transports | 10,936.70 | 12,232.10 (new highs) | 1.2% | 12.2% | up | up | up | |
| NASDAQ | 9,006.62 | 11,854.97 | 0.2% | 32.1% | up | up | up | |
| S&P/TSX Composite | 17,063.53 | 17,019.10 | 2.1% | (0.3)% | up | up | up | |
| S&P/TSX Venture (CDNX) | 577.54 | 740.45 | 0.6% | 28.2% | up | up | up (weak) | |
| S&P 600 | 1,021.18 | 1,020.23 | 2.6% | (0.1)% | up | up | up | |
| MSCI World Index | 2,033.60 | 2,029.25 | 2.0% | (0.2)% | up | up | neutral | |
| NYSE Bitcoin Index | 7,255.46 | 18,721.39 (new highs) | 16.0% | 158.0% | up | up | up | |
| Gold Mining Stock Indices | ||||||||
| Gold Bugs Index (HUI) | 241.94 | 315.20 | (8.9)% | 30.3% | down | neutral | up | |
| TSX Gold Index (TGD) | 261.30 | 345.57 | (8.2)% | 32.3% | down | neutral | up | |
| Fixed Income Yields/Spreads | ||||||||
| U.S. 10-Year Treasury yield | 1.92 | 0.82 | (8.9)% | (57.3)% | ||||
| Cdn. 10-Year Bond yield | 1.70 | 0.66 | (9.6)% | (61.2)% | ||||
| Recession Watch Spreads | ||||||||
| U.S. 2-year 10-year Treasury spread | 0.34 | 0.66 | (8.3)% | 94.1% | ||||
| Cdn 2-year 10-year CGB spread | 0 | 0.38 | (13.6)% | 3,800.0% | ||||
| Currencies | ||||||||
| US$ Index | 96.06 | 92.39 | (0.4)% | (3.8)% | down | down | down | |
| Canadian $ | 0.7710 | 0.7640 | 0.4% | (0.8)% | up | up | neutral | |
| Euro | 112.12 | 118.58 | 0.2% | 5.7% | up | up | up | |
| Swiss Franc | 103.44 | 109.76 | 0.2% | 6.1% | up (weak) | up | up | |
| British Pound | 132.59 | 132.82 | 0.6% | 0.3% | up | up | up (weak) | |
| Japanese Yen | 92.02 | 96.32 | 0.7% | 4.7% | up | up | up | |
| Precious Metals | ||||||||
| Gold | 1,523.10 | 1,872.40 | (0.7)% | 22.9% | down | up (weak) | up | |
| Silver | 17.92 | 24.36 | (1.7)% | 35.9% | neutral | up | up | |
| Platinum | 977.80 | 957.20 | 6.8% | (2.1)% | up | up | up (weak) | |
| Base Metals | ||||||||
| Palladium | 1,909.30 | 2,323.30 | (0.3)% | 21.7% | down (weak) | up | up | |
| Copper | 2.797 | 3.29 (new highs) | 3.5% | 17.6% | up | up | up | |
| Energy | ||||||||
| WTI Oil | 61.06 | 42.42 | 5.7% | (30.5)% | up | up | down | |
| Natural Gas | 2.19 | 2.77 | (7.4)% | 26.5% | down (weak) | up | up |
Note: For an explanation of the trends, see the glossary at the end of this article.
New highs/lows refer to new 52-week highs/lows.
It was a mixed week with some indices making new all-time highs while others did not. The Dow Jones Industrials (DJI) and the Dow Jones Transportations (DJT) both made new all-time highs this past week following the Moderna announcement of a vaccine for COVID-19. Moderna joins Pfizer. The DJI and the DJT, however, went in opposite directions when it came to gains on the week. The DJI lost 0.7% while the DJT gained 1.2%. The DJI losing after making new all-time highs was a bit of a negative. The S&P 500 also fell off 0.8% but the NASDAQ gained a small 0.2%. Neither the NASDAQ nor the S&P 500 made new all-time highs a slight divergence with the DJI and DJT.
One that did make new highs this past was Bitcoin. Not only did it gain 16% but Bitcoin is now within striking distance of a new all-time high. Is the Bitcoin bubble back again? Bitcoin is up 158% in 2020 the best performing asset. Too bad it’s virtual and there are still stories of hacks and frauds in the cryptocurrency world. Bitcoin’s market cap is now at $347.3 billion. The entire crypto universe has a market cap of $538.8 billion so Bitcoin makes up 64.5% of the entire market amongst the 7,739 different cryptos. Twenty-five cryptos have a market cap over $1 billion and 8 are over $5 billion. Even our old favourite Dogecoin maintains a market cap over $442 million.
Elsewhere in the world the MSCI World Index gained almost 2% while the TSX Composite was up 2.1%. The TSX Venture Exchange (CDNX) gained 0.6%. In the EU the London FTSE was up 0.3%, the Paris CAC 40 gained 2.2% and the German DAX was up 2.2%. In Asia, China’s Shanghai Index (SSEC) gained 2% and the Tokyo Nikkei Dow (TKN) made new highs once again but closed the week flat.
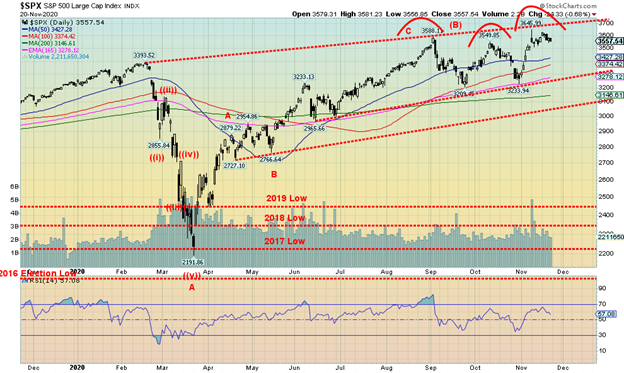
All trends remain up but the S&P 500 like the other indices still appears to be making a potential triple top. Triple tops are rare. But then the S&P 500 has been bouncing up against the a trendline joining the February high and the September high. That line also connects nicely to the September 2018 high so it may indeed be significant. The S&P 500 needs to firmly break over 3,700 to demonstrate that the bull is alive and well and poised to move higher. The breakdown point is at 3,225 and a firm break under that level could project down to 2,790 a decline of about 23%. The patterns are suggesting that there could be a significant top forming. But until it breaks the trend remains up but short, intermediate and long-term. It was significant that the recent high for the S&P 500 came on huge volume. Since then the volume petered out and the S&P 500 has failed to make another high.
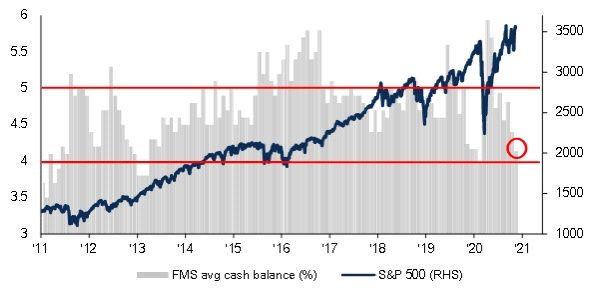
One thing that has been pointed out is the Fund Managers Survey (FMS) cash has fallen to 4.1%. That’s the lowest level since January pre-COVID. When the FMS falls under 4% it has, in the past, been a sell signal.
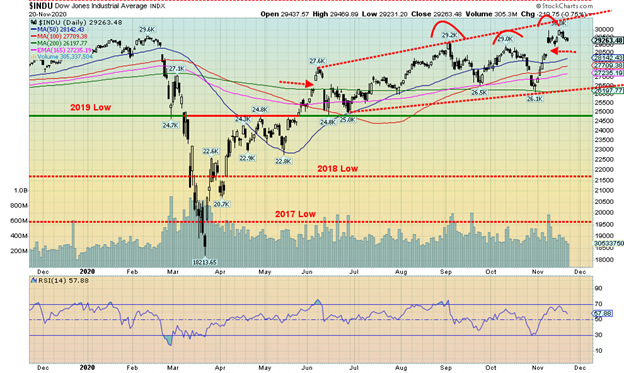
Happy days are here again as the DJI leaped to new all-time highs this past week. 29,964 is the new high. With the DJT also making new all-time highs the two indices confirmed each other. As a result we have seen a spat of comments saying that Dow Theory has confirmed the market is going higher because both the DJI and DJT have confirmed each other. We guess the S&P 500 and the NASDAQ were not listening as they did not make new all-time highs. The only other indices we saw make new all-time highs were the Value Line and the S&P 400 Mid-Cap Index. Is the DJI making a triple top or as we sometimes call it in this case three thrusts to a top. Usually we like that pattern to be three consecutive higher highs but each high only slightly higher than the previous one. The breakdown point is not until the DJI is under 26,175. If that happens then the potential target is 22,350. If the market is to continue higher than we would need to see new all-time highs once again this coming week.
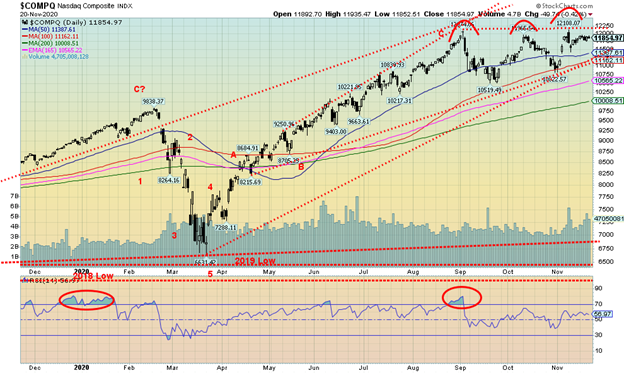
Unlike the DJI and the DJT the NASDAQ did not make new highs this past week following the excitement over the Moderna vaccine. The NASDAQ, the previous leader, now appears to be faltering. The FAANGs that led the market up are also faltering. This past week Facebook fell 2.6%, Apple was down 1.6%, Amazon down 0.9%, Google off 2.0%, and Microsoft down 2.8%. Netflix gained 1.1%. Tesla leapt to new all-time highs following the announcement it was to be included in the S&P 500 as it gained 19.9%. Value play Berkshire Hathaway lost a small 0.1%. The failure of the NASDAQ to make new highs this past week is a divergence but so far it is unconfirmed divergence. To confirm you need the indices to break down. We duly note that triple tops are rare so we don’t want to jump to conclusions just yet. The breakdown level is at 11,000 and a firm close under that level could project the NASDAQ down to around 9,400 a decline of 22%.
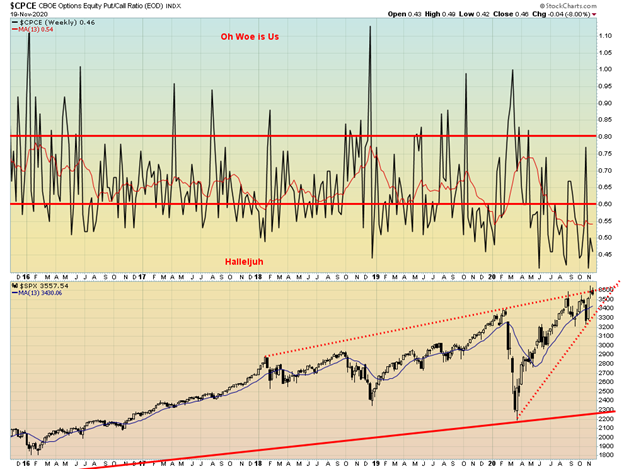
The put/call ratio remains firmly in hallelujah territory at 0.46 just above the record low of 0.41. The past few months has seen the put/call ratio heavily in favour of calls for the longest period we can remember. It is either a market brimming with confidence or brimming with complacency. After all they know that interest rates will remain low for years and the expectation is that more stimulus is on the way. So, buy, buy, buy.
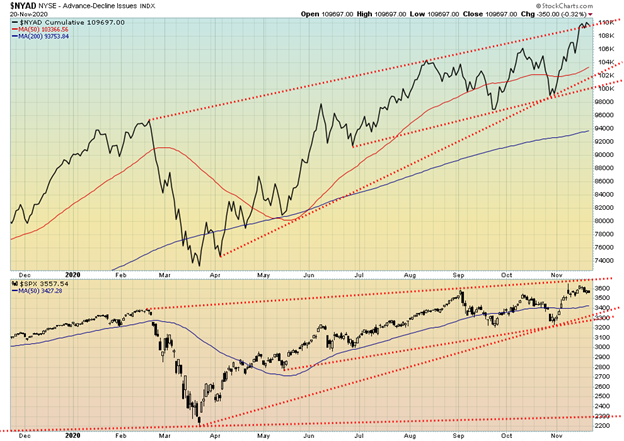
The NYSE advance/decline line remains the bulls best hope for further highs. There was a small divergence this past week with the AD line making new highs but the S&P 500 not making new highs. It may not mean much but it is noted. The divergence we prefer is the S&P 500 making new highs but not confirmed by the AD line. The percentage of stocks on the S&P 500 trading above their 200-day MA is now up to about 88%. That’s the highest level seen since January 2020. But January/February was the high before the March panic.
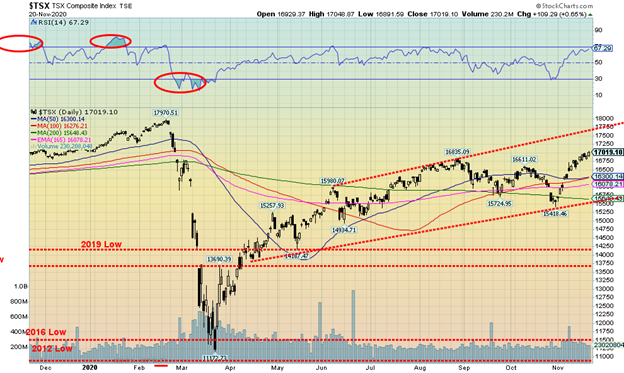
The TSX Composite continued its recent climb this past week gaining 2.1%. Nine of the fourteen sub-indices were up on the week led by Energy (TEN) up 8.0%. If there is a rotation going on then it is no surprise that previously weak sectors had the best week. Financials (TFS) were up 4.6% but Information Technology (TKK) one of the early leaders gained 5.4%. Leading the way down was Golds (TGD) off 6.2% followed by Materials (TMT) down 3.6%. Of all the indices the TSX is the one we see as better positioned to move higher. We are looking at the top of the channel currently near 17,750. While the U.S. indices faltered at the end of the week the TSX kept climbing and it has now taken out its August high. However, the February high remains distant at 17,970. A reversal and break under 16,300 would be a short-term negative.
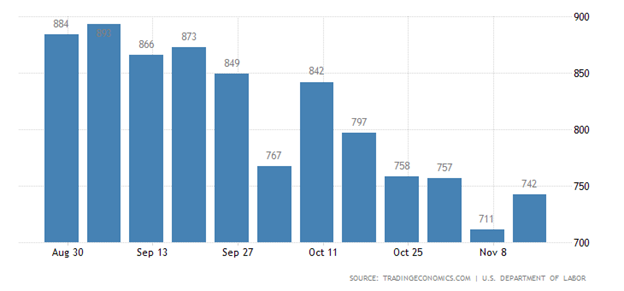
Initial Jobless Claims
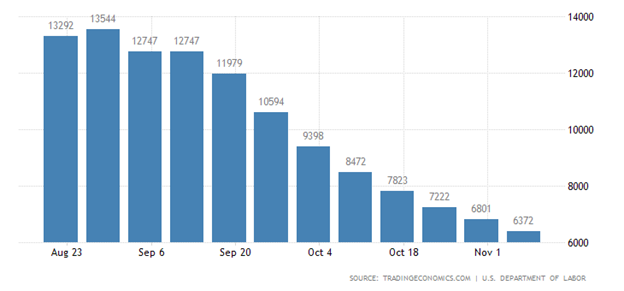
Continuing Jobless Claims
The number of U.S. jobless claims rose this past week rather unexpectedly. Initial jobless claims came in at 742,000 up from 711,000 the previous week and against an expectation of 710,000. With coronavirus rates (and deaths) rising and shutdowns looming this number could rise further. These numbers remain sharply elevated pre-COVID estimated by some at 3.6 times. As we go into what is the most time of the year for many in the hospitality and retail industry one has to wonder how restaurants, movie theatres, retailers will fare. Couple that with the operating at roughly 20% capacity travel industry and the best of month of the year threatens to be a write-off. The November employment figures to be released December 4, 2020 could experience a sharp decline or even show a loss of jobs. Add to this the fact that the extended payments many have been receiving expires in late December and you have the potential for many just keeping their hands on their wallets. It is estimated that some 13 million could be cut off all aid by the end of December with the expiration of the Cares Act on December 26, 2020.
The real crunch could be seen in January. More than 21 million Americans are claiming some sort of unemployment insurance. But no stimulus package is on its way thanks to the disputed election and effectively Congress and the Senate barely talking to each other and far apart on any package anyway. The poverty rate in the U.S. is rising and according to recent numbers could be at least 11.3% of the population or over 37 million. Some 45 million are on food stamps. Food lines have become commonplace and the lines are long. As people’s sources of income dries up people have their utilities cut and then eviction. Homelessness is growing problem. And those numbers are just the official living in poverty as it doesn’t account for the millions barely above it. Merry Christmas!
U.S. Personal Savings Rate
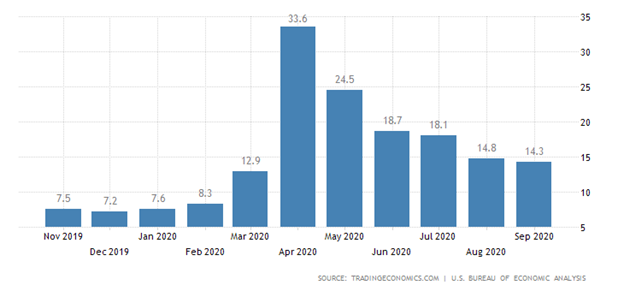
The U.S. personal savings rate slipped to 14.3% in September as the downward trend continues after peaking at 33.6% in April at the height of the first wave of COVID-19. What it suggests is that the build up of savings that occurred as a result of the March lockdown is being brought down as consumers feel more confident. There is an estimated $90 billion floating around. What will be interesting is given the sharp rise in COVID-19 numbers and accompanying lockdown will we see the savings rate jump again?
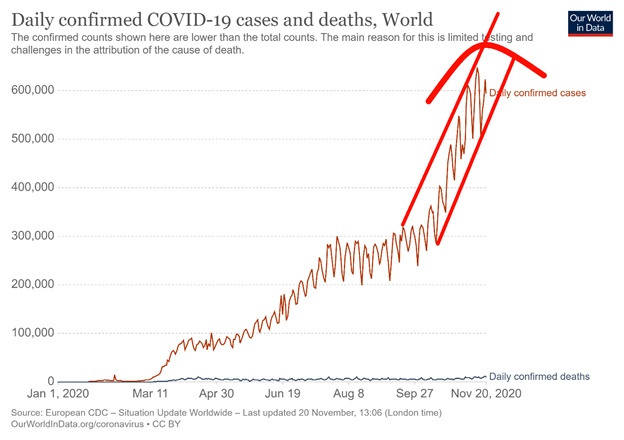
The numbers just keep on rising. We are now starting to see 600,000 cases daily. That’s over a million every two days. The deaths are rising as well with roughly 10,000/day or more. The good news about deaths is that the deaths/cases ratio has fallen to generally under 2% and even down to 1%. That’s brought the global total deaths/cases down to around 2.3% from 3%. Better drugs and care are helping keep the death rate down. Although it says nothing about the after-effects that leaves many debilitated. We are trying to be optimistic by putting the little hat on top of the recent action. One would like to view it as potential topping action. But we wouldn’t get too excited unless we see the global averages fall. The seven-day MA for cases is just under 600,000 while the seven-day MA for deaths is hovering just under 10,000. November 20 saw 662 thousand cases and over 11,000 deaths. We have now surpassed 59 million cases and over 1.3 million dead. Still at current rates we are probably looking at 25 million more cases by year end and another 400-500 thousand dead. For the record the U.S. has passed 12 million cases, India is past 9 million cases and Brazil is over 6 million. Eleven countries are over one million cases. However, only four countries are over 100,000 dead – U.S., India, Brazil and Mexico.
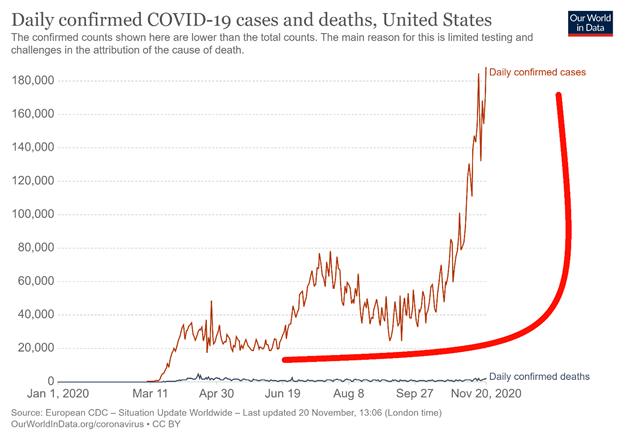
The U.S. numbers continue to astound. The U.S. leads the world in cases with over 12 million and deaths with over 260 thousand. The U.S. adds another million about every 6 days. Considering the U.S. is supposed to have one of the best health care systems in the world, well for those who have good plans, the management of the coronavirus has left something to be desired. It has been grossly mismanaged. The U.S. finally had its big day on November 20 with over 200,000 cases and 2,000 dead. Keep that up and we are looking at another 8 million cases and upwards of another 100,000 dead by year end. Hospitals are overrun. One in five hospitals are predicting critical staff shortages by the end of the week. That’s over 1,200 hospitals. ICU’s are overrun. They are even running out of body bags. The vaccine? Well it’s coming. Maybe even in December according to some hopefuls. But who gets it first? And how many? And remember the Pfizer vaccine requires extreme cold temperatures to store it. They are predictably already running out of dry ice. And initial quantities are bound to be limited. And it hasn’t been tested on a broader swath of the population. Potential unknown side effects? Hope springs eternal.
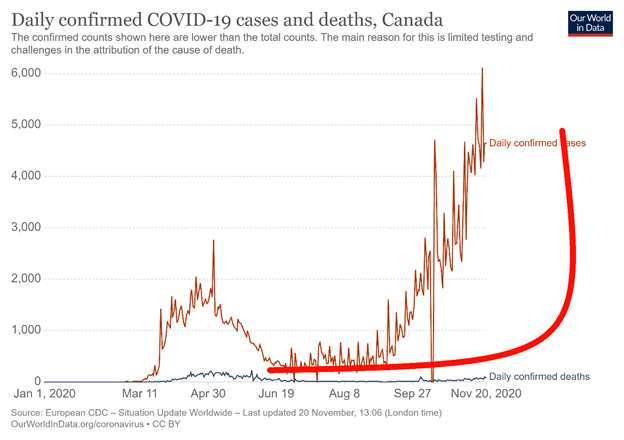
Canada’s numbers keep on rising as well. Regions of Ontario including Toronto have gone back into lockdown. And with lockdown the economic effects could be quite devastating for thousands of businesses. Canada still sits in 31st in terms of total cases with over 320 thousand. Deaths in total leave Canada in 23rd spot but the heavy lifting with deaths was during the first wave. The number of deaths/cases is actually down sharply from roughly a total of 7% back in April/May but down to just over 1% today a decline of 85%. Forecasts are expecting 10,000 cases daily soon.
US 10-Year Treasury Note, Canada 10-Year Government Bond (CGB)
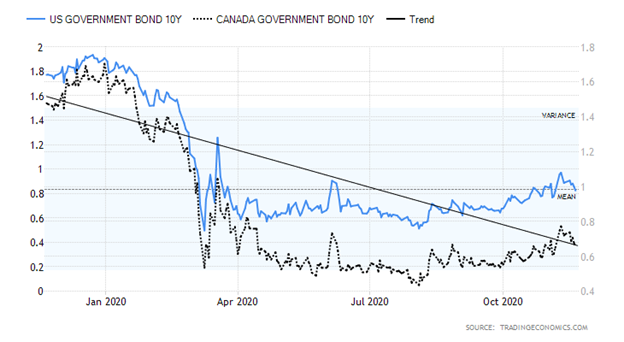
Just as everyone thought interest rate yields as represented here by the U.S. 10-year treasury note and the Government of Canada 10-year bond (CGB) were about to rise further the sharply rising COVID-19 numbers coupled with lockdowns and the potential collapse of economic activity slammed yields right back down again. The U.S. 10-year fell to 0.82% down from 0.90% (8.9% decline) the previous week while the CGB fell to 0.66% down from 0.73% (9.6% decline). It was a mixed bag of economic numbers this past week with U.S. retail sales rising 0.3% in October below the 0.5% estimate. The Christmas season is now expected to be anything but jolly. Industrial production was negative 5.3% year over year, the NY Empire Manufacturing Index came in at 6.3 when it was expected to be 12.75. The surprise of the week was previous mentioned initial jobless claims that came in higher than expected. Despite the drop in yields this past week the overall trend is still a gentle up. The U.S. 10-year would have to fall under 0.70% and the CGB under 0.55% to suggest that yields will test lows. Many are still expecting higher interest rates but the reality is as economic activity slows due to the sharp rise in COVID-19 cases and economies go into lockdown mode once again the odds are now shifting to the downside.
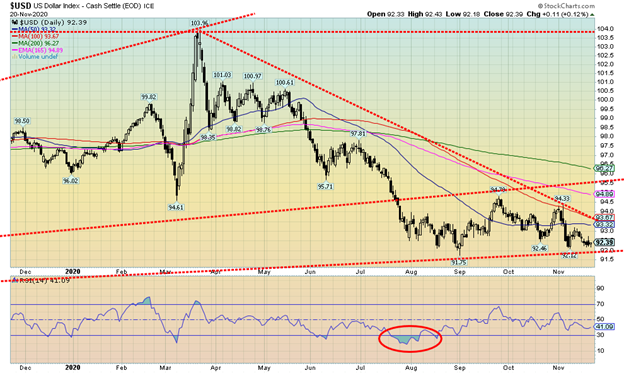
With COVID-19 numbers rising, hospitals overwhelmed, economic activity potential slowing the U.S. dollar fell this past week. The US$ Index dropped 0.4%. The euro was up 0.2%, the Swiss franc up 0.2%, the pound sterling gained 0.6% while the Japanese yen was up 0.7%. The Cdn$ was up 0.4%. Support for the US$ Index appears at 92 but under that level the odds of new lows below 91.75 are high. The US$ Index remains firmly in a downtrend and given everything going on the odds of it rising are low. A weaker U.S. dollar is positive for gold. The US$ Index needs to regain first 93.30 then breakout above 93.75 to tell us that we could rise further to 96.00/96.50. The US$ Index remains in a downtrend across all time-lines.
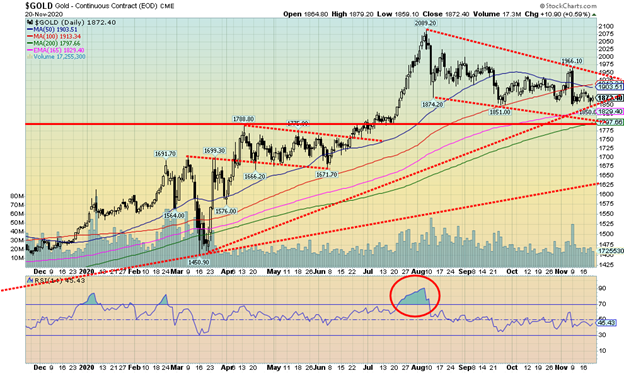
Gold is not doing well these days. Gold has failed to gain any traction to the upside ever since the “we have a vaccine” moment back on November 9 when gold plunged. Since that time gold has basically waffled around holding just above September lows. The result of all of this is that gold remains vulnerable to a downside cleansing. Gold lost 0.7% this past week while silver fell 1.7%. On the positive side platinum that has been weak all year rose 6.8% one of its best performances in weeks. Copper was also up gaining 3.5% as it jumped to new highs. Palladium was off a small 0.3%. Copper and Platinum’s rise is encouraging especially copper as it is pointing to renewed economic activity. Although that remains to be seen give lockdowns into Christmas season. But we note the pace of new houses in the U.S. continues to be decent (although well below records) and that bodes well for copper demand. Also encouraging is that gold usually follows copper although there can be lags. Gold is being negatively impacted by the thoughts of a vaccine and is discouraged by thoughts of no stimulus. Gold is hovering near its September low of $1,851 while silver remains well above its September low. A breakdown under $1,850 would suggest a drop for gold to the $1,760/$1,800 zone. That would be a test of the 200-day MA. Gold remains about 10% off its August high of $2,089. In terms of corrections this is not unusual as gold went through numerous 10% plus corrections during its long bull-run from 2001 to 2011. We are also wary of potential cycle lows due into the 2022/2024 period. We continue to believe that once this correction is over either this month or next, we should embark on a strong wave to the upside. Never wanting to avoid warning about breakdown zones the ultimate one we don’t want to see is at $1,670. Above $2,030 new highs are probable. In the interim we need to see gold take out $1,900 and especially above $1,950 to suggest to us higher prices.
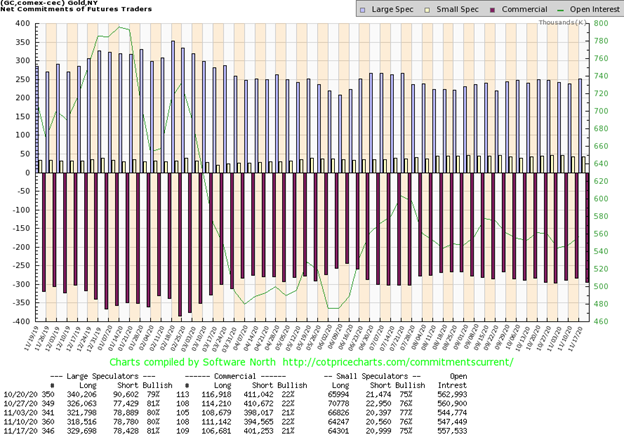
The gold commercial COT slipped to 21% this past week down from 22%. Long open interest fell almost 5,000 contracts while short open interest rose almost 7,000 contracts. Not the preferred direction as this suggests potentially more downside for gold prices. The large speculators COT (hedge funds, managed futures etc.) rose slightly to 81%. They clearly are expecting things to stabilize here. Their rise was mostly because of a roughly 9,000 contracts rise in long open interest.
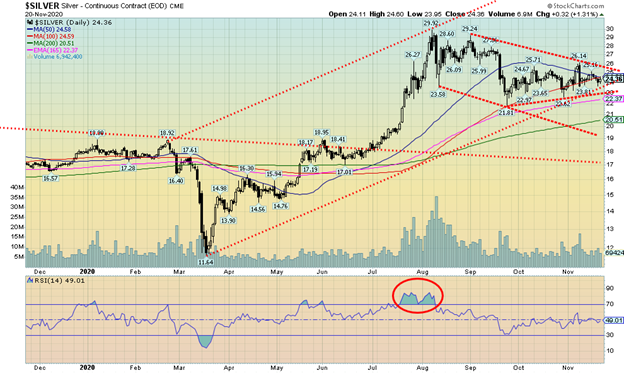
Silver continues to be the star. While silver fell 1.7% this past week, silver’s outperformance vs. gold is encouraging. While gold is being negatively impacted by hopes for a vaccine and no stimulus, silver is holding up as they know that future build ups of green energy will require a lot of silver. Gold is testing its September low while silver remains nicely above that level. Silver is even above its October low. Silver appears to be forming a potential symmetrical triangle with the breakout level up around $26. But the breakdown level is just below at $23.00 although to confirm the breakdown silver would have to fall under $22.25. Silver’s September low was $21.81. Silver remains substantially up on the year at 35.9% outperforming even the gold stocks. Silver is also up 110% from the March low. We remain quite positive about silver going forward. The current correction period could be coming to an end if we were to breakout to the upside. On the other hand, silver could just waffle through the triangle awaiting the formation of another pattern. Just beware a breakdown under $23.00. A breakdown under that level could project down to around $15. We doubt that scenario but until we clear upside targets downside potential remains.
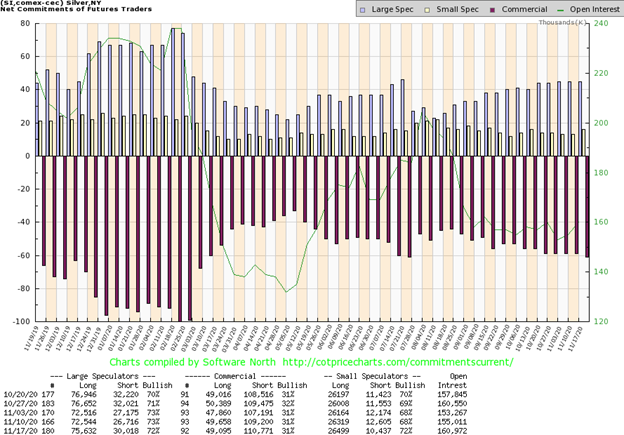
The silver commercial COT was not encouraging this past week as it remained at 31%. Long open interest slipped by roughly 600 contracts while short open interest rose about 1,500 contracts. The large speculators meanwhile saw their COT slip to 72% from 73% as they added almost 4,000 contracts to their short open interest but it was offset by a gain of 3,000 contracts for long open interest. The silver COT remains somewhat bearish.
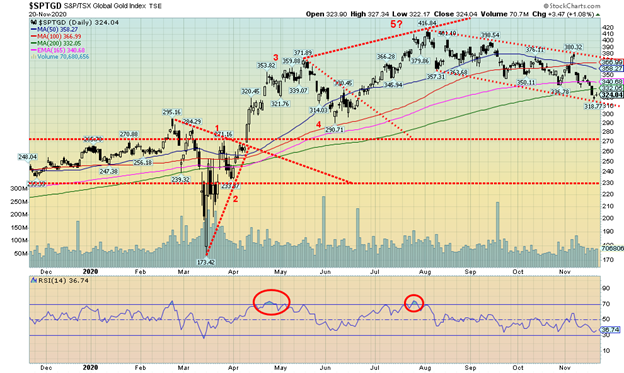
Are the gold stocks poised to break down? We can’t rule that out as the gold stocks as represented by the TSX Gold Index (TGD) and the Gold Bugs Index (HUI) took another hit and fell to their lowest level since June. The TGD dropped 6.2% this past week while the HUI was off 5.7%. We shouldn’t cry too much as the TGD remains up 24% on the year while the HUI is up 22.9%. But that’s a far cry from the up 40% that was seen back in August. Sentiment is also falling as the Gold Miners Bullish Percent Index (BPGDM) has fallen to 58.6%. That’s rather neutral and nowhere near oversold under 25. Back in March the BPGDM fell to 7.7% during the March COVID panic. RSI remains above 30 as well suggesting to us that more downside may be coming. We are now under the 200-day MA. The last time that occurred was again in March. The key level for the TGD is seen at 290 the June low. A break of that level would be negative and suggest further declines towards 270 and even down to 230. We were encouraged by the bounce seen on Friday but the reality is the TGD needs to regain above 340 for us to feel a little more comfortable. The breakout point is now way up at 375. The short-term trend is firmly down and the intermediate trend has turned neutral. Another down week, however, for both the TGD and the HUI would turn the intermediate trend down.
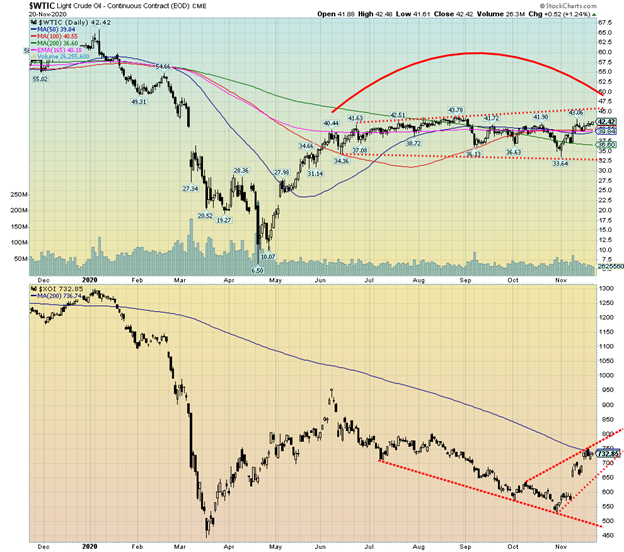
The oil market is caught in between. On one hand the rising COVID-19 numbers coupled with lockdowns are helping to keep a lid on WTI oil prices but optimism over a vaccine and an end in sight for the COVID-19 into 2021 coupled with OPEC maintaining production cuts is helping to push prices a bit higher. Reality is WTI oil is still within the boundaries of a constantly shifting sideways channel. The channel is actually widening with the breakout point now at $45 and the breakdown point at $32.50. WTI oil gained $2.29 this past week or 5.7%. Natural gas (NG) settled back and fell 7.4%. But the energy stocks responded positively jumping to their best levels in weeks. The ARCA Oil & Gas Index (XOI) was up 6.0% while the TSX Energy Index (TEN) gained 8.0%. As our chart shows the XOI is now testing the 200-day MA while (not shown) the TEN is over its 200-day MA. That has helped turn the short-term daily trend up and now the intermediate trend (weekly) has also turned although so far, it’s weak. But the intermediate trend turning positive is a signal that suggests oil and gas stocks could be purchased. WTI oil has also turned positive with the daily and weekly trends now pointed up although the long-term (monthly) trend remains down.
Oil demand in Europe and North America is soft but in Asia it is going the opposite direction. Up. This keeps alive the hopes of the oil producers. China in particular is stockpiling oil. China gets a chunk of its oil from Russia via overland pipelines. Despite ample supplies of oil the demand for renewables is also growing. There has been some shift by investors to renewables from fossil fuels. This is particularly the case in Europe. Meanwhile gulf oil producing states are being strained by the production cuts and the drop in demand and it is negatively impacting their budgets that are awash in red ink and their debt is soaring.
__
(Featured image by Andrew Neel via Unsplash)
DISCLAIMER: This article was written by a third party contributor and does not reflect the opinion of Born2Invest, its management, staff or its associates. Please review our disclaimer for more information.
This article may include forward-looking statements. These forward-looking statements generally are identified by the words “believe,” “project,” “estimate,” “become,” “plan,” “will,” and similar expressions. These forward-looking statements involve known and unknown risks as well as uncertainties, including those discussed in the following cautionary statements and elsewhere in this article and on this site. Although the Company may believe that its expectations are based on reasonable assumptions, the actual results that the Company may achieve may differ materially from any forward-looking statements, which reflect the opinions of the management of the Company only as of the date hereof. Additionally, please make sure to read these important disclosures.


Dolci Palmisano Issues Its First Minibond of the F&P “Rolling Short term” Program
Dolci Palmisano Srl issued its first €300K Short Term Minibond at 5.5%, fully subscribed on launch. Structured by Frigiolini &...


Bitcoin Traders on DEXs Brace for Downturn Despite Price Rally
Despite Bitcoin’s recent rally, over 70% of BTC options volume on DEXs like Derive.xyz are puts, signaling trader caution. Many...


Dow Jones Nears New High as Historic Signals Flash Caution
The Dow Jones is nearing a new all-time high despite past resistance, with a current BEV of -2.65%. A potential...


Stock Markets Surge Amid Global Uncertainty, But Storm Clouds Loom
The stock market hit new highs despite global tensions, with the S&P 500, NASDAQ, and TSX leading. Oil collapsed amid...


The TopRanked.io Weekly Digest: What’s Hot in Affiliate Marketing [NordVPN Affiliate Program Review]
There's a bit of a vibe in the EU right now that's slowly taking hold of everyone, from everyday consumers...
 |
|
 |  |
 |
|
-

 Fintech5 days ago
Muzinich and Nao Partner to Open Private Credit Fund to Retail Investors
-

 Crowdfunding2 weeks ago
Switzerland’s Crowdfunding Market Remains Stable – Without Growth
-
 Crypto8 hours ago
Bitcoin Traders on DEXs Brace for Downturn Despite Price Rally
-

 Business1 week ago
Debt-Fueled Markets, Zombie Corporations, and the Coming Reckoning