Markets
Recession? What recession? Soft Landing, Here We Come?
Recession? What recession? That seems to be the cry today, as the soft landing scenario starts gaining favor. But, before getting our hopes up, let’s not forget the multitude of negative divergences, sell signals, and the weakening of the short-term uptrend, which may provide justification for valid concerns about a potential market top.

Recession? What recession? That seems to be the cry today. Okay, there are some bumps and grinds. Employment has softened, but it’s not yet near recessionary levels. The Fed has hiked interest rates from near 0% to 5%, but the world hasn’t fallen apart. The 10-year U.S. treasury note has gone from a low of 0.52% in August 2020 at the height of the pandemic to over 4.00% today. The Fed’s balance sheet exploded from $4.1 trillion to almost $9 trillion as they feverishly tried to prevent an economic collapse because of the pandemic. Today, it still sits at $8.2 trillion. U.S. Federal debt exploded to over $31 trillion from $23 trillion. Consumer debt also exploded after a pullback during the pandemic, but it too gained $3 trillion and corporate debt is also up. All told, U.S. debt from all sources is up over $20 trillion since the pandemic recession. Canada’s debt is also up proportionatly.
Inflation has soared from sub 1% to peak at over 8%, but has since fallen to about 3%. Recession expectations have fallen sharply. The only thing left is the hugely inverted yield curve of 2-year–10-year and 3-month–10-year. The inverted yield curve has predicted a recession 100% of the time since the 1970s. But the recession doesn’t come until roughly 6–12 months after the inversion bottoms. We still don’t know whether it has bottomed, so any official recession has been pushed out into 2024, or even 2025. Sure, inflation has made a lot of things more expensive, but then inflation is friendly to debt as it makes it cheaper. Bankruptcies are on the rise but not yet dire, and the housing market is wobbling but not tipping over. Banks have collapsed and there are more that are shaky and could fail, but the big banks are mostly fine. We did not have a replay of the 2008 bank crisis. That’s not to say it couldn’t happen. Of the large global economies, only Germany has officially fallen into a recession.
Yet if we listen to some, the world is about to come to an end. The risks are there: war in Ukraine/Russia; the economic impact of severe weather events that are getting bigger and more expensive; massive amounts of global debt with some countries in default and others on the verge of default; AI and its potential impact, positive and negative, on the economy and employment; sanctions and supply chain disruptions that are akin to trade wars; and political disruptions, the latest being the indictment of a former president. We are also witnessing the rise of nationalist right-wing governments and we still don’t know where that is going to take us. The last time it happened, we wound up in a global war.
But the restaurants and theatres are full: witness the huge success of the Taylor Swift tour and the record opening weekend for Barbie. People are travelling; they are also buying goods, just not as many, as entertainment has superseded that. No wonder the Consumer Discretionary sector in Canada has hit record highs. All that despite high tech and AI leading the markets higher (and higher). The Goldilocks economy. Not too hot, not too cold.
While all of this is happening, the Fitch credit rating agency cut U.S. debt to AA+ from AAA. Some viewed it as the end of the world. In reality, it was mostly meaningless as S&P had already cut U.S. debt to AA+ back in 2011. One of the prime reasons for the rating cut was the recent U.S. debt limit fight that is still not resolved. Moody’s and DBRS maintain an AAA credit rating. Only 10 countries have a solid AAA credit rating. One of them is Canada, despite those who paint Canada as the next Venezuela. Needless to say, maybe Fitch is looking at the longer picture where the fiscal deterioration of the U.S. could continue, due to growing Social Security and Medicare payments (unfunded, of course) as well as the burgeoning defense budget to pay for the U.S.’s massive military presence around the world (750 bases and counting) and paying for Ukraine’s war against Russia. The U.S. defense budget is larger than the next ten put together, which includes both Russia and China. Unfunded liabilities for the U.S. total some $192 trillion.
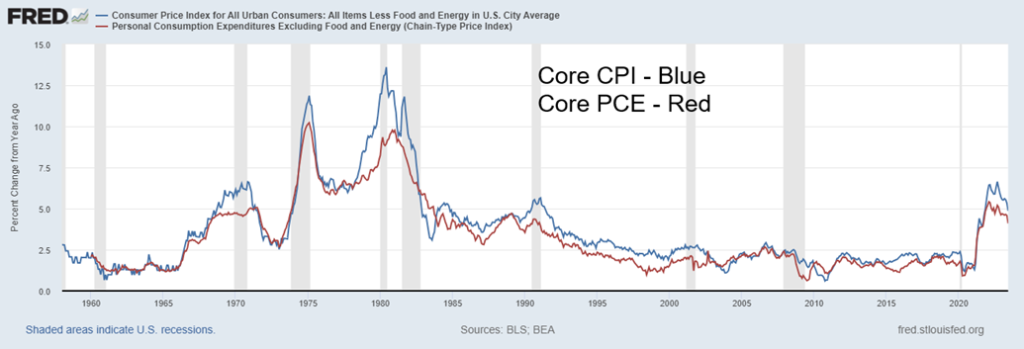
Inflation has been a problem, but it is coming down. The Fed and economists don’t look at the CPI (Consumer Price Index); they look instead at the Core CPI and Core PCE (Personal Consumption Expenditures). The core takes out the volatile food and energy components and, in that respect, gives a better reading on the real underlying inflation picture. Of the two, Core PCE is the most important because of its measurement of all goods and services. CPI, for example, leaves out key expenditures on medical paid by employees’ insurance, Medicaid and Medicare. That’s included in PCE. Nonetheless, the two are quite similar. That said, the Fed pays more attention to PCE prices because they cover a broader swath of the economy. At last report, the Core
CPI was 4.8% and Core PCE was 4.1%. Both are higher than full CPI and PCE.
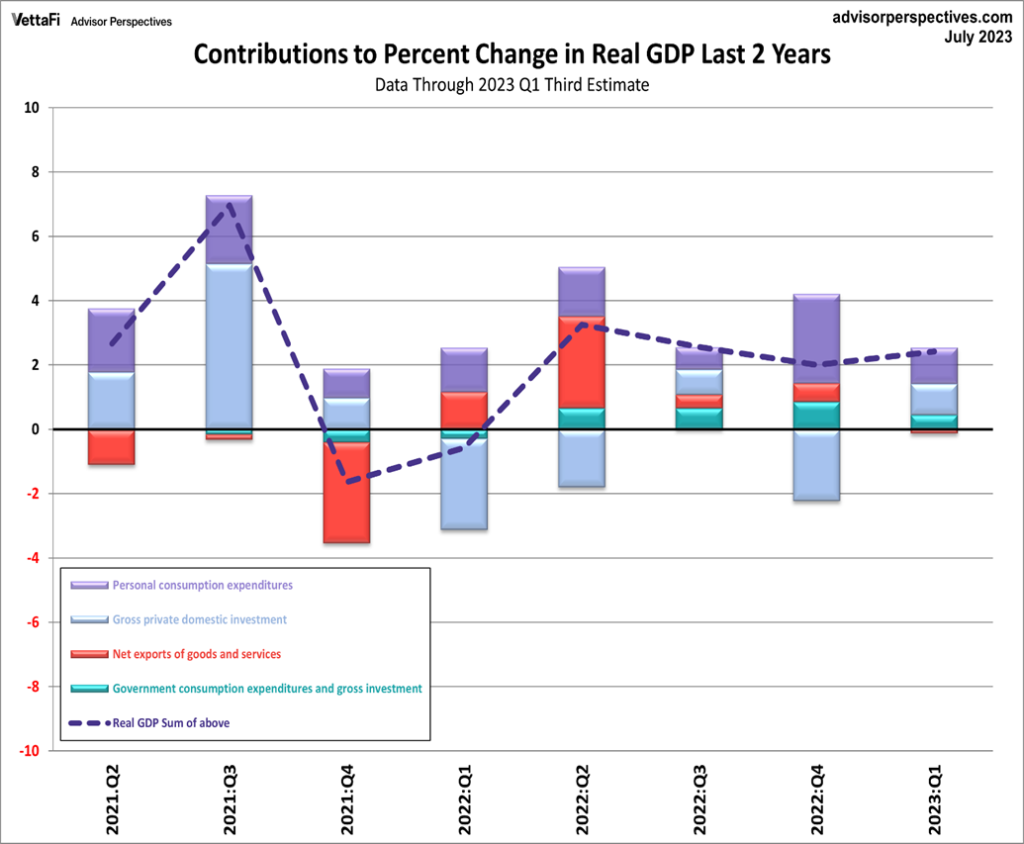
We came across an interesting article at VettaFi Advisors Perspectives, An Inside Look at the Q2 2023 GDP Advance Estimate by Jennifer Nash (https://www.advisorperspectives.com/dshort/updates/2023/07/28/an-inside-look-at-the-q2-2023-gdp-advance-estimate), that took a look at GDP, breaking down the components.
Different components can at different times add or subtract from GDP. What’s interesting about this is the contribution from personal consumption expenditures (in purple). It’s the biggest component and includes things like restaurants, theatre, and entertainment. It makes up some 70% of GDP. In that respect, one can see why the Fed pays more attention to PCE inflation than other forms of inflation.
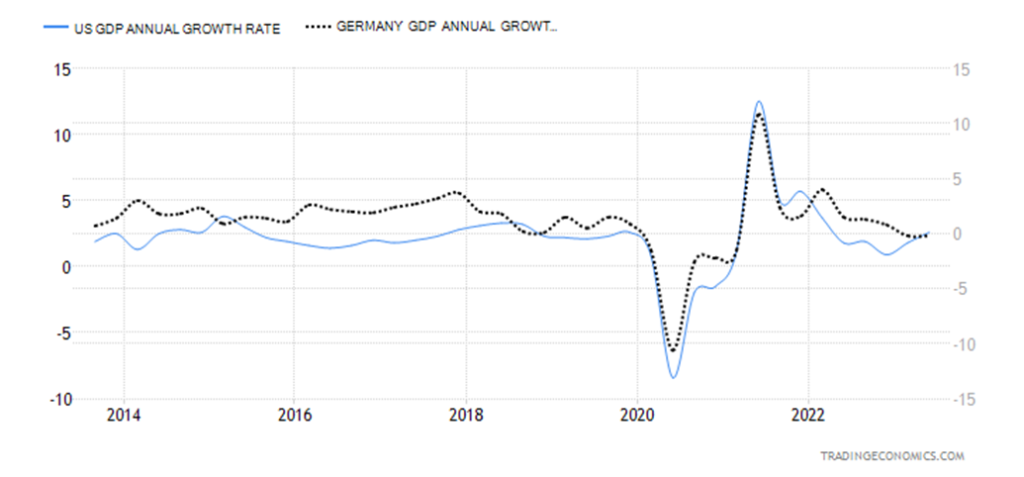
We noted that Germany has fallen into recession with two consecutive quarters of mildly recessionary GDP growth. It is last reported at negative 0.2%. The U.S., on the other hand, has reported last Q2 growth of 2.6%. This is widely divergent, as the chart shows. Germany, as the largest economy in the EU, is dragging the EU down as it is barely growing. The U.K. is also sliding towards recession as its growth rate is barely positive. The EU and Germany have been the most negatively impacted by the war in Ukraine/Russia because of their proximity. Negative impacts of oil and gas, supply chains, sanctions, and refugees pouring over the Ukraine border into EU countries, particularly Poland, along with price increases (inflation) are taking their toll. They are giving rise to protests and unease, particularly from German business.
Germany has currently the softest line on Russia and has not sent weapons to Ukraine. In turn, that is causing tensions with NATO partners. Polish farmers are protesting what is perceived as the dumping of wheat and
other grains from Ukraine on Poland’s market, sparking price drops and wheat left in the field. Romania is suffering the same.
There is also growing tension between Ukrainian refugees and the countries impacted. The largest number of refugees have fled to Russia, Germany, and Poland, each in excess of one million. While the U.S. is the largest supplier of weapons and aid to Ukraine, there are growing concerns in the U.S. as well because of the cost. And as usual, in the U.S., a Democrat/Republican divide prevails.
It may be a Goldilocks economy but lurking in the background are the three bears. Goldilocks escaped. Will the global economy?
Hallelujah! Happy days are here again. Friday’s July job report was about as good as it gets. Not too hot, not too cold. Goldilocks is here. Soft landing, here we come.
Well, the enthusiasm is expected. Friday’s nonfarm payrolls came in only slightly less than expected at 187,000, slightly below the expected 190,000 to 200,000. It was the second successive month of sub 200,000 job growth. Junes was 185,000. The market breathed a sigh of relief. Stocks rallied, gold rallied, bonds rallied (yields fell), and the US$ Index (USDX) fell. Then the stock market reassessed and fell.
Yes, the chart we usually show is different this week. Seems that Shadow Stats (www.shadowstats.com) is having some problems transitioning to a new carrier. As a result, no charts, no data from Shadow Stats.
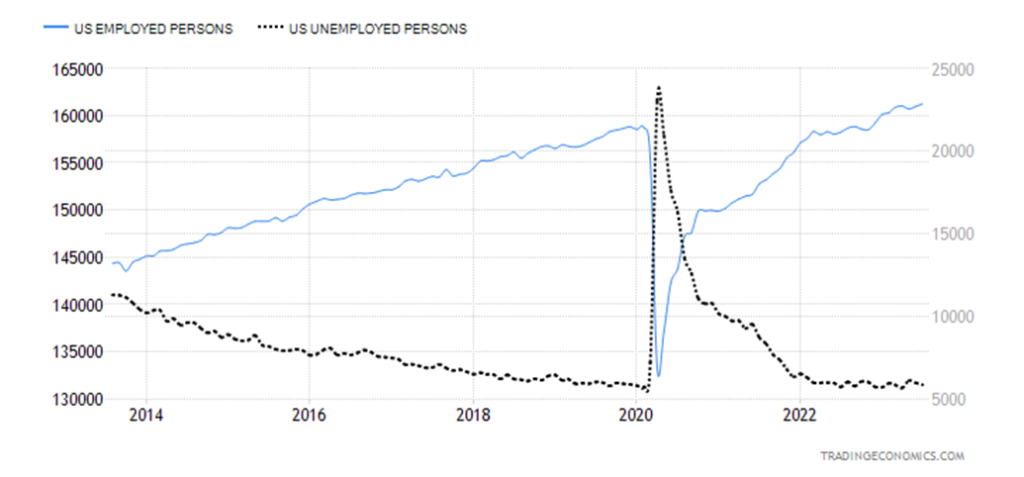
Anyway, it gets better. The unemployment rate (U3) fell to 3.5% from 3.6% while the U6 unemployment rate (highest reported by the BLS, plus all persons marginally attached to the labour force, plus total employed part-time for economic reasons, as a percent of the civilian labour force, plus all persons marginally attached to the labour force) fell to 6.7% from 6.9%.
What we always love is the anomalies in the numbers, which we confess we can’t explain. Maybe we need a BLS interpreter. We note that Bloomberg never goes into these numbers. The population level (total number
16 and over) rose 201,000; the civilian labour force (total number 16 and over in the workforce) rose 152,000; but the employment level (those 16 and over employed) was up 268,000. Full-time employment fell 585,000 while part-time employment was also up 972,000. As a result, the gain in nonfarm was due to part-time employment as full-time employment fell. The number of people unemployed fell by 256,000. The number for those not in the labour force also fell, down 242,000. Of 98,469 thousand not in the labour force, some 57.4 million are considered retired and 8.7 million disabled. (All sources www.bls.gov, www.stlouisfed.org)
Average hourly earnings rose 4.4% year-over-year (y-o-y), which was better than the expected 4.2%. On a monthly basis, they were up 0.4% vs. expected 0.3%. The labour force participation rate was unchanged at 62.6% while the employment population ratio was 60.4% vs. 60.3%. One blip as the number of people unemployed 27 weeks or longer rose by 170,000.
All in all, this was a good report that had Bloomberg Economics quipping, “The labor market is cooling, providing a disinflationary impulse to the stickiest inflation categories that should last the rest of the year. The FOMC’s July rate hike likely was the final one before an extended pause.” (Anna Wong and Stuart Paul, Bloomberg Economics)
The market is saying amen. The biggest bugaboo—the growing debt pile that prompted Fitch to downgrade the U.S. this week.
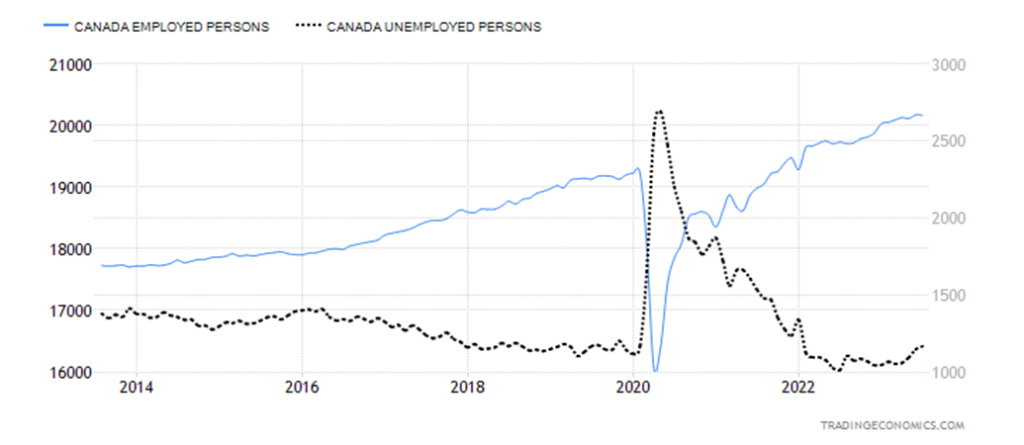
We suppose it was inevitable. In June, Canada gained a whopping 59,900 jobs, well above expectations. In July, Canada lost 6,400 jobs which was below the consensus of a gain of 21,100. A miss, but not the end of the world as Canada remains well ahead overall over the past year. Statistics show that Canada created 460,000 jobs over the past year, an average of 38,000/month. Yes, the number of employed persons fell last month by 6,400 but, overall, we are up considerably. The number of unemployed persons rose last month by 63,000, while over the past year it is up the same. The unemployment rate rose to 5.5% up 0.1% from 5.4%. However, there was a bigger jump in the R8 rate unemployment (discouraged searchers, involuntary part-timers—the highest level reported by Statistics Canada) rose to 8.5% from 7.1% a big jump. The labour force participation rate dipped slightly to 65.6% from 65.7%.
Full-time employment actually grew, up 1,700, as it was part-time employment that fell, down 8,100. We suppose from an inflationary standpoint the 5% gain in hourly wages over the past year might cause some consternation amongst some people. Pundits had expected a gain of only 4.1%. If there was one nice statistic, it’s that youth unemployment fell to 10.2% from 11.5%.
The report might help the Bank of Canada (BofC) maintain interest rates at the next interest rate decision meeting on September 6. 0ddly, that’s two days before the August employment report would come out on September 8. The BofC would be holding rates steady at 5%.
Population growth due to immigration has expanded the pool of workers but, overall, they seem to be getting employed. Core age immigrants over the past five years have an employment record of 77.7% vs. 86.6% for native-born Canadians.
Despite the dip in employment, it follows a gangbuster month so it is difficult to read too much into this. Overall, the trend for employment growth remains positive.
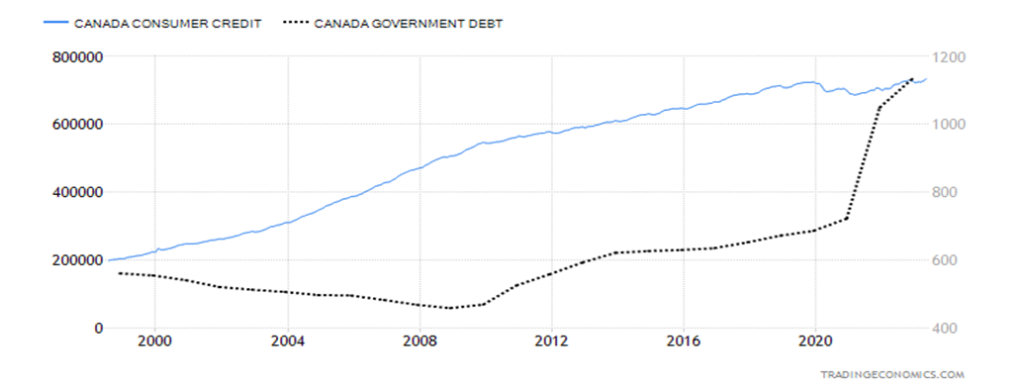
Our final Canada chart shows the growth of both the Federal government debt and consumer credit over the past twenty-five years. Federal government debt actually fell until about 2006 then started to rise again in earnest especially following the financial crisis of 2008. The really big growth came as a result of the 2020 pandemic when Canada like everyone else spent to prevent an economic collapse. Overall Canada government debt has more than doubled since 2000. Irrespective Canada maintains the lowest Federal debt to GDP in the G7 at about 56% compared to the U.S. at 120% and Japan the highest approaching 300%. Canada, along with Germany maintains an AAA credit rating.
Meanwhile consumer credit soared during the 2000’s and 2010’s thanks to ultra-low interest rates and high liquidity. It blipped during the pandemic but has started to grow again. Consumer credit has soared well over three times since 2000. Canada has one of the highest consumer debt to GDP in the world at 102% ranking it fourth highest in the world. Switzerland has the highest at 128%. As unemployment rises the high consumer debt could become a problem for households and the banks. However, overall consumer debt is lower than both government and corporate debt.
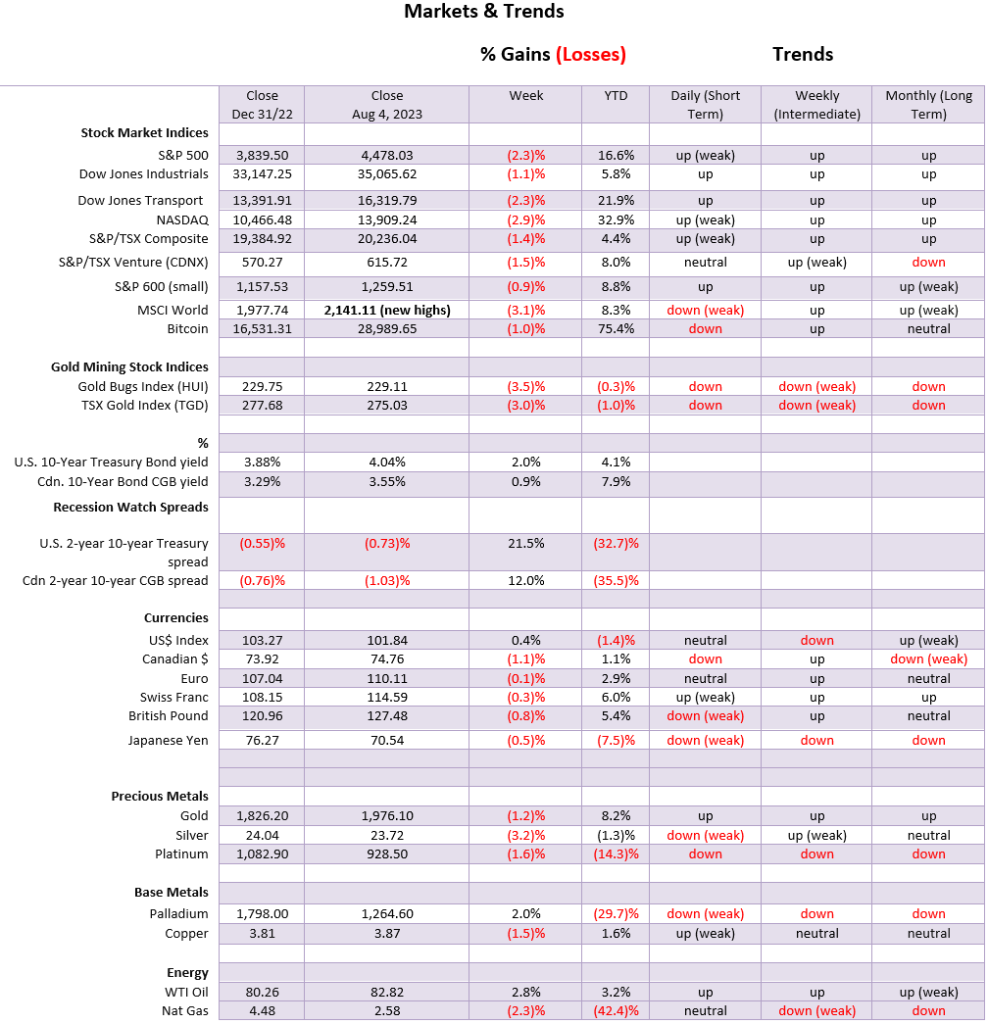
Friday was quite interesting for the stock market. After the slightly weaker than expected jobs report, all the talk now was that the Fed will be able to pause its interest rate hiking and that would be good for stocks. As well, thoughts continued that, at worst, the U.S. could be headed for a soft landing. At one point, stocks were up about 1% Friday. That changed after the negative outlook for Apple came out. Apple gapped down on Friday. Not a good sign. The $3 trillion company was now worth a bit less. Not even good results from Amazon helped. On the week, Apple fell over 7%; Amazon gained 5.5%. Outside of Advanced Micro Devices, all the other FAANGs were down on the week. The NY FANG Index fell 2.4% and the NASDAQ was down 2.9%. The S&P 500 dropped 2.3%.
The Dow indices weren’t spared. The Dow Jones Industrials (DJI) fell 1.1% and the Dow Jones Transportations (DJT) dropped 2.3%. The S&P 400 (Mid) was off 1.3% and the S&P 600 (Small) dropped 0.9%. Canada wasn’t spared either as the TSX Composite fell 1.4% and the TSX Venture Exchange (CDNX) was down 1.5%. In the EU, the selling followed as the London FTSE fell 1.8%, the EuroNext was off 2.2%, the Paris CAC 40 was also down 2.2%, and the German DAX was off 3.1%. In Asia, China’s Shanghai Index (SSEC) bucked the trend, up 0.4%, but the Tokyo Nikkei Dow (TKN) fell 1.7% and Hong Kong’s Hang Seng (HSI) was down 1.9%.
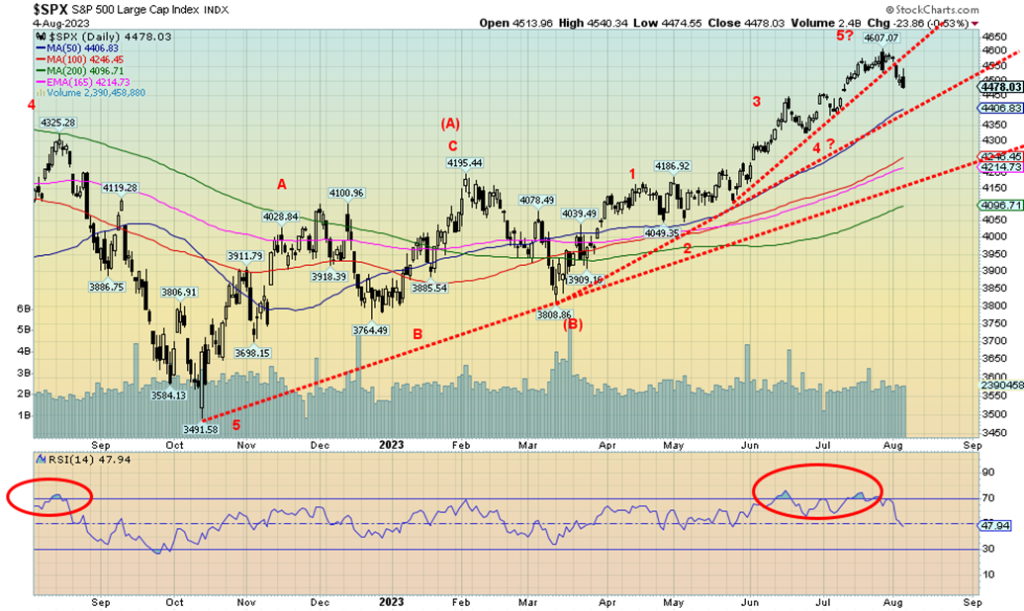
Is our target of 4,800 S&P 500 in trouble? Maybe. The high so far was 4,607. Except the day it made the high the S&P 500 put in a huge outside reversal day to the downside, signaling a possible top. We broke that steep trendline up from the May low, but a gentler trendline up from a March low looms. If that line breaks, then the likelihood of a top becomes more realistic. The final line of defense would come from the trend line up from the October 2022 low. Once it breaks and is under 4,200, a bear market could get underway. This then could be our C wave.
The weekly chart below shows a distinct five-wave advance from the 2009 financial crisis low. The top was January 2022. With a drop of more than 20% from that high, it signaled the potential for a new bear market. We labeled that decline into October 2022 as our A wave down. The B wave has been underway, but we cannot as yet confirm a top. Any C wave may even stop at that uptrend line from the 2009 low currently down around 4,300. But a breakdown under 4,200 could signal a more dangerous bear ahead. Under 4,000 it would be well underway.
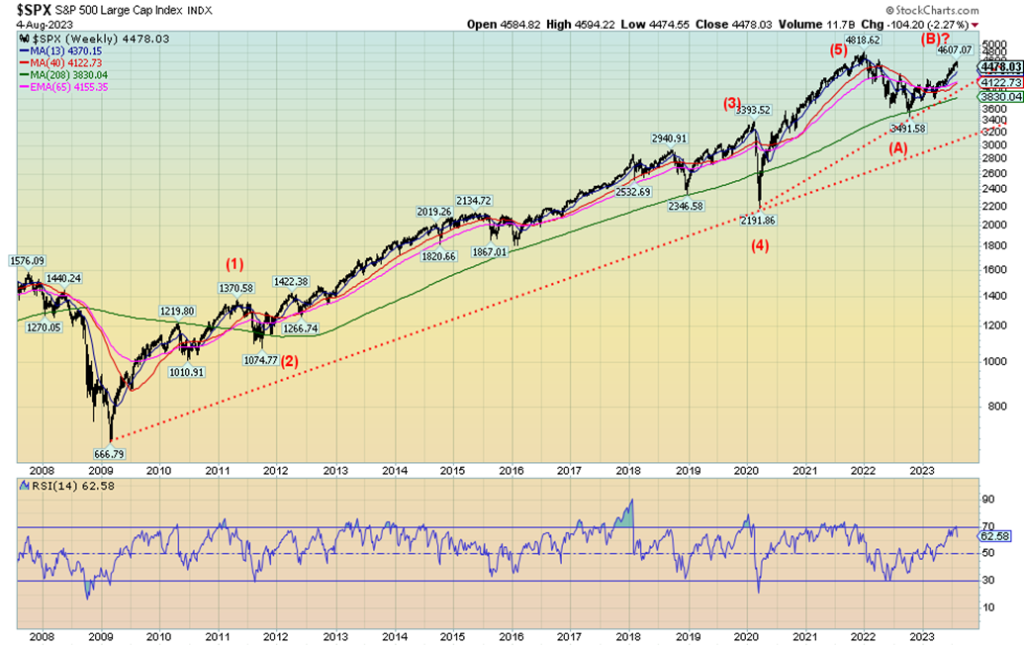
The bull market from March 2009 to January 2022 was about 13 years. Previous bull markets over the past century have been 1921–1929 (8 years), 1949–1966 (17 years), and 1982–2000 (18 years). On average, those cyclical bull markets last only 14 years. Cyclical bear markets have lasted on average 15 years.
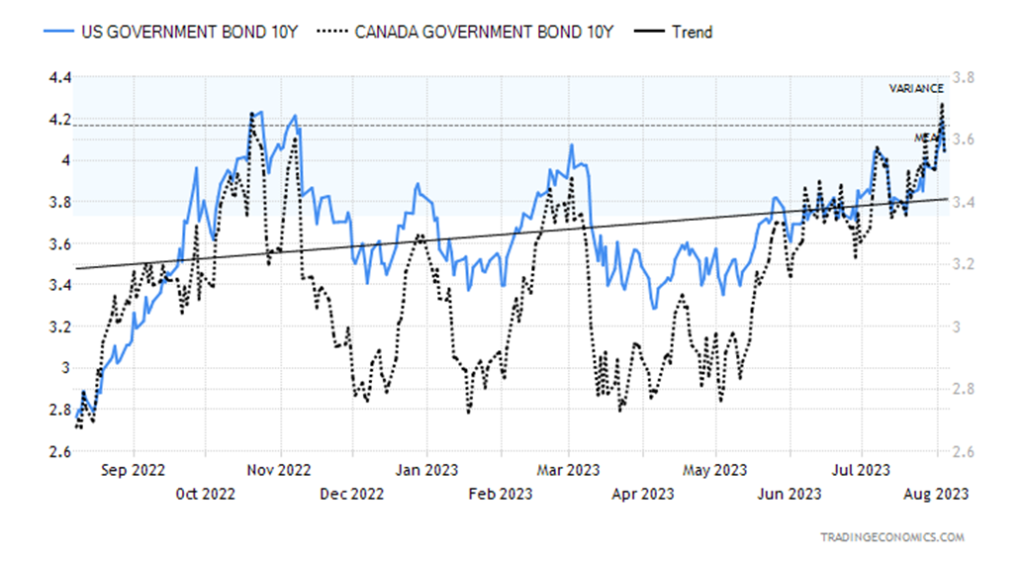
Wither interest rates? The job numbers on Friday steadied the recent rise in interest rates, but the U.S. 10-year treasury note still closed over 4% on the week. A break of 4.25% would suggest that the long end of the curve is going higher. Interestingly, the 2-year–10-year spread had a good drop this past week. It fell to 73 bp, down from 93 bp the previous week, a drop of 21.5%. We have often stated that while an inverted yield curve has correctly predicted every recession since the 1970s, the recession doesn’t usually get underway until the yield spreads bottom. The question now is—has it bottomed? Recessions typically get underway 6–12 months following the bottom. That pushes any recession out to at least Q2 in 2024 or even Q4 2024.
Canada hasn’t moved as much as the 10-year Government of Canada Bond (CGB) was up slightly to 3.55% from 3.52% this past week. The 2-year–10-year spread dropped to 103 bp from 117 bp. We’ll be monitoring that spread carefully going forward.
Nonetheless, with the job numbers being somewhat weaker than expected, that has raised odds that the Fed would stand pat at the September 19–20 FOMC meetings. The Bank of Canada (BofC) makes its next interest rate decision on September 6. The BofC is also expected to stand pat.
Interest rates are less and less likely to fall. The risk is now to the upside in yield (downside in price as prices move inversely to yields). The question is, will the 10-year take out 4.25%? We appear to have entered an era
of higher interest rates, after some 40 years of generally declining interest rates, with the absolute low in
yields seen during the pandemic. Indeed, the central banks lowering interest rates to zero (sometimes sub-zero, as in the EU and Japan) and pumping trillions of dollars into economies to prevent a collapse have in turn fueled the next crisis. And not only have they fueled the next crisis, but they have fewer bullets left to fight it with. This explains why some see the next crisis as more dire than even previous financial crises. With global debt at well over $300 trillion and the U.S. owning a third of that, the next crisis could be one of confidence in government. That in turn is quite bullish for gold.
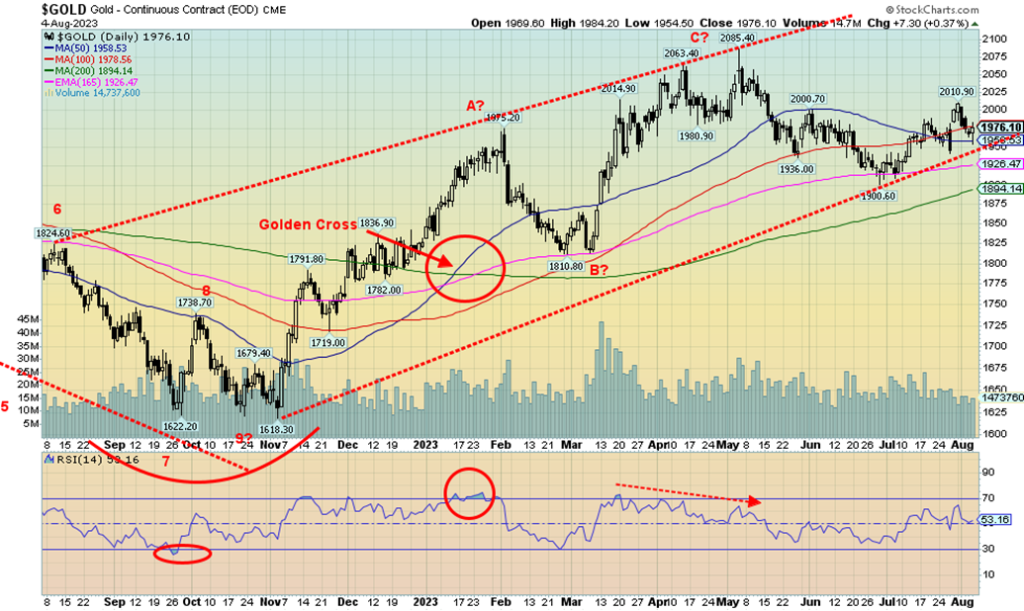
It was not a good week for the precious metals sector. Gold fell this past week due to fears over higher interest rates and decent economic numbers. Not even the Fitch U.S. debt downgrade helped although it might going forward. Friday’s miss on the nonfarm payrolls helped steady things as gold rose. The feeling was that the
possibly weakening job picture will allow the Fed to pause its interest rate hikes. If that takes hold, then gold is due for a rise.
Nonetheless, the week was not good as gold fell 1.2%, silver lost 3.2% and turned negative on the year once again, and platinum was pushed down 1.6%. The near precious metals such as palladium rose 2.0%, but copper fell 1.5%. The gold stocks continued their recent woes as the Gold Bugs Index (HUI) fell 3.5% and the TSX Gold Index (TGD) dropped 3.0%. The TSX Venture Exchange (CDNX) that holds at least 50% mining stocks, many of them gold stocks, fell 1.5%.
However, the odds shifted that the Fed may well pause and that was positive for gold on Friday. Earlier, the stock market had responded positively to the weaker nonfarm but then turned around and closed down on the day. Gold and the gold stocks did not follow, rising on the day. It will now be important that they follow through this coming week.
The Gold Miners Bullish Percent Index (BPGDM) is at 35.71%, which is actually lower than where it was a couple of weeks ago. Sentiment remains low for the entire sector. The commercial COT was at 28% this past week for gold, the same as the previous week. However, interestingly enough, long open interest fell about 8,000 contracts while short open interest dropped over 19,000 contracts. Silver was even better as the commercial COT rose to 32% from 31%. Longs were mostly flat, but shorts fell some 6,000 contracts. Overall, we view the COT report as mildly bullish.
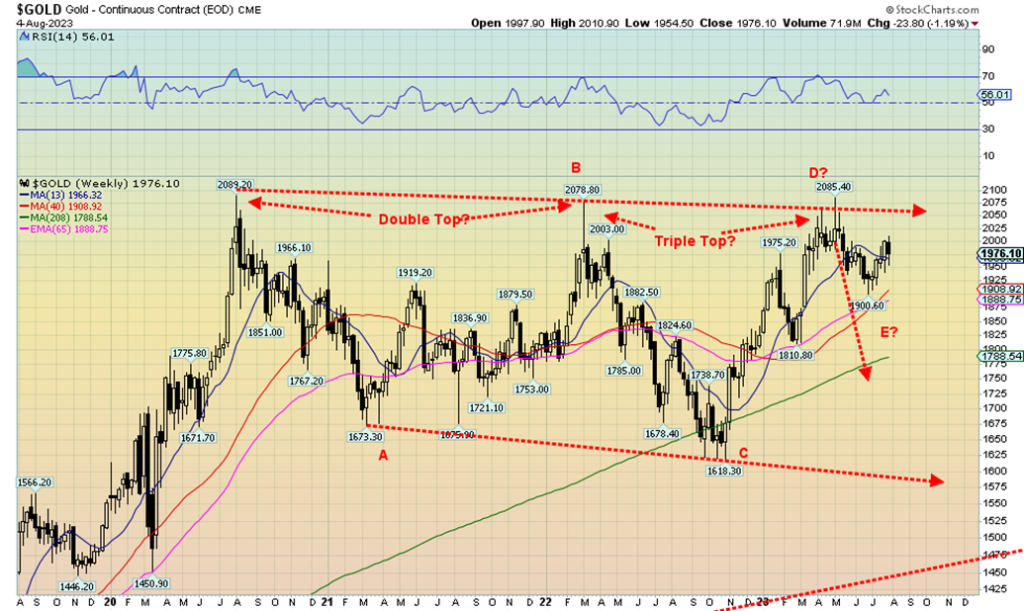
While there are numerous bearish detractors for the PMs, our take on them comes from the weekly chart below. Since the $2,089 high of August 2020, gold has made two more cracks at taking that level out. First in March 2022 at $2,078 and more recently in May 2023 at $2,085. Gold is now forming what we believe is a large ABCDE-type corrective pattern. We appear to be working on the E wave. The E waves can often be shorter than the other waves. Think of the bear market in stocks in 1949 or 1982. Both those bears remained well above previous lows. We wouldn’t even consider this E wave a bear market as it held above both 40-week MA and the 65-week EMA. Gold is now breaking out above the 13-week MA. Triple tops as extremely rare. Not to say this can’t happen, but given what is going on in the world we’d lean more towards the fourth time as a charm.
Once gold firmly takes out $2,100, the huge corrective pattern potentially points to targets up to $2,500. Silver has had a harder time as it remains well below its all-time high near $50. Right now, silver needs to take out $25.50 to end current bearish potential and hold above $23. Under $22.50 silver would be in trouble and could move lower. But a breakout for gold to new highs would also take silver higher. We have continually noted how cheap silver is compared to gold and, similarly, how cheap the gold stocks are compared to gold. The major indices HUI and TGD remain well below their high of 2011. As well, gold in other currencies has seen new highs in some currencies, just not in U.S. dollars. More recently gold in Chinese yuan has made record highs. Junior gold miners are ultra-cheap at levels of valuation we haven’t seen since the late 1990s. Oddly enough, while the market isn’t buying the junior miners, many (most?) have had no problem raising money. Smart money getting in?
The US$ Index turned down on Friday following the job numbers. That helped gold. The US$ Index failed at key resistance points, but still needs to firmly break under 99/100 to suggest lower prices. Is so-called de-dollarization playing a role? It may be. BRICS is meeting this month with a number of countries looking to join BRICS. BRICS is also looking at a currency backed by gold. Many countries were spooked by the U.S. booting Russia out of SWIFT. That’s fueling the desire to join BRICS as the fear is that if the U.S. can do it to Russia, they could do it to other countries. China/Russia have been working on an alternative to SWIFT as well as institutions to challenge the U.S.-dominated IMF and World Bank. Nonetheless, this does not mean the immediate demise of the U.S. dollar as the world’s reserve currency. There is no obvious successor. The U.S. dollar is still at least 60% of global reserves and the U.S. still has the deepest and largest capital markets in the world. Nevertheless, BRICS and its plans does pose a potential threat to the U.S. and to the U.S. dollar.
We remain bullish on the precious metals. However, we cannot yet confirm a low for gold. A move above $2,050 will help alleviate that and silver above $25.30. And, of course, no new lows.
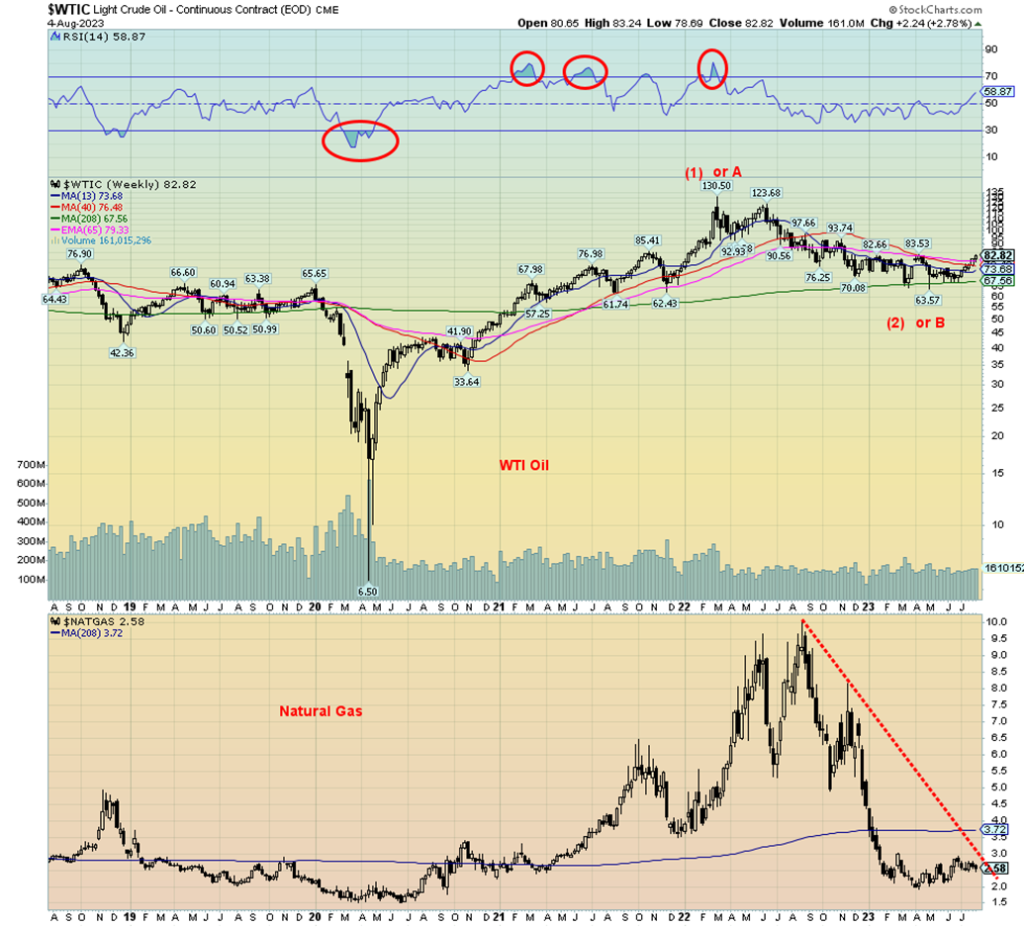
This week we are showing a weekly chart of both WTI oil and natural gas (NG). First off, WTI oil rose 2.8% this past week, breaking firmly through $80. On the year, WTI oil is up 3.2%. Brent crude was also up 2.2%. NG at the Henry Hub fell 2.3%, but at the EU Dutch Hub it was up 0.9%. The coup in Niger was apparently causing issues with a key NG pipeline that comes up through Niger and the rest of Africa, destined for the EU.
Oil prices were rising this past week due to a tighter market and easing fears of a recession. Russia and Saudi Arabia continue their production cuts into September and that adds to a tighter market. As well, we note there have been attacks on Russia’s Black Sea terminals and tankers by Ukraine. That in turn could also lead to tighter supply. Finally, U.S. crude and gasoline stocks have been falling, suggesting that they may have to replenish them.
Energy stocks benefitted as the ARCA Oil & Gas Index (XOI) rose 1.2% and the TSX Energy Index (TEN) was up 1.5%. Incidently, TEN was the only one of two TSX sub-indices up on the week, the other being Real Estate (TRE), up a small 0.5%.
As our chart shows, after hitting a multi-year (all-time?) low during the pandemic at $6.50, oil soared because of the growing war between Russia and Ukraine. Russia is the world’s third largest producer, the world’s second largest exporter, and holds the eighth largest reserves. As to NG Russia, Russia is the world’s second largest producer, the second largest exporter, and holds the largest NG reserves in the world. What happens in Russia can impact the world. Because of the war, WTI oil soared to $130 (wave 1 or A). It eventually came back down and has now for the past year and half being correcting (wave 2 or B). Now, we believe, comes wave 3 or C. How high could it go? A simple calculation could in theory take WTI oil to $195. Clearly, for that to happen, some things would have to happen first. Escalation of the war in Ukraine/Russia that causes more energy disruptions, or war with Iran blocking the Straits of Hormuz where 30% of the world’s oil flow through are just two possibilities.
NG also soared because of the war as pipelines to the EU were shut or blown up (Line 2). However, now the EU is flush with supplies at least 80% or higher. After soaring to almost $10 during the war, it collapsed to about $2. For the past several months NG appears to be forming a rounding bottom. But the reality is that NG must break up through $3 to convince us that we could be starting a new leg to the upside. Note for oil how it held the four-year MA during its correction. Oil has now broken above the converging MAs of 13-week, 40-week, and 65-week EMA. Higher oil prices will eventually see higher gasoline prices at the pumps since the cost of oil is a largest component in the price of gasoline. Inflation, which has come down, could then rise once again as higher oil prices bite and impact many other things such as food prices (transportation costs).
With oil prices breaking out and moving higher, that in turn could well take energy stocks higher once again. The sector is a current buy.
__
(Featured image by Tom Fisk via Pexels)
DISCLAIMER: This article was written by a third party contributor and does not reflect the opinion of Born2Invest, its management, staff or its associates. Please review our disclaimer for more information. This article may include forward-looking statements. These forward-looking statements generally are identified by the words “believe,” “project,” “estimate,” “become,” “plan,” “will,” and similar expressions. These forward-looking statements involve known and unknown risks as well as uncertainties, including those discussed in the following cautionary statements and elsewhere in this article and on this site. Although the Company may believe that its expectations are based on reasonable assumptions, the actual results that the Company may achieve may differ materially from any forward-looking statements, which reflect the opinions of the management of the Company only as of the date hereof. Additionally, please make sure to read these important disclosures.
Copyright David Chapman 2023
David Chapman is not a registered advisory service and is not an exempt market dealer (EMD) nor a licensed financial advisor. He does not and cannot give individualised market advice. David Chapman has worked in the financial industry for over 40 years including large financial corporations, banks, and investment dealers. The information in this newsletter is intended only for informational and educational purposes. It should not be construed as an offer, a solicitation of an offer or sale of any security. Every effort is made to provide accurate and complete information. However, we cannot guarantee that there will be no errors. We make no claims, promises or guarantees about the accuracy, completeness, or adequacy of the contents of this commentary and expressly disclaim liability for errors and omissions in the contents of this commentary. David Chapman will always use his best efforts to ensure the accuracy and timeliness of all information. The reader assumes all risk when trading in securities and David Chapman advises consulting a licensed professional financial advisor or portfolio manager such as Enriched Investing Incorporated before proceeding with any trade or idea presented in this newsletter. David Chapman may own shares in companies mentioned in this newsletter. Before making an investment, prospective investors should review each security’s offering documents which summarize the objectives, fees, expenses and associated risks. David Chapman shares his ideas and opinions for informational and educational purposes only and expects the reader to perform due diligence before considering a position in any security. That includes consulting with your own licensed professional financial advisor such as Enriched Investing Incorporated. Performance is not guaranteed, values change frequently, and past performance may not be repeated.


Morocco’s Budget Execution June 2026: Deficit Narrows to 20.2 MMDH
Morocco’s Finance Law execution at end-June 2026 shows a reduced budget deficit of 20.2 billion dirhams, down from 24.9 billion...


Tilray Brands Hits Multi-Year Lows as Cannabis Investors Await Regulatory Clarity
Tilray Brands shares have fallen 57% this year amid cannabis sector weakness and uncertainty over US regulatory reform. While potential...


Ethereum Between ETF Inflows, Price Risks and a Strong July
Ethereum faces mixed signals as ETF inflows and a strong July performance support recovery, while technical resistance and downside risks...


Mercedes-Benz Accelerates EV Decarbonization With Recycled Aluminum
Mercedes-Benz expands its partnership with Hydro to accelerate supply chain decarbonization. Future electric vehicles will use Hydro CIRCAL aluminum containing...


Evotec and BioGaia Boost Biotech, while Vitrolife Disappoints
European stocks moved on earnings and broker actions. Evotec, BioGaia, Plus500, Pharming, Inwido, Amundi and Julius Baer rallied on upgrades,...
 |
|
 |  |
 |
|
-

 Crowdfunding4 days ago
Japanese Crowdfunding Platform Ubugoe Faces Payment Crisis After Withholding Funds
-

 Impact Investing2 weeks ago
Ecobnb Turns Sustainable Tourism Into Measurable Impact
-
 Crypto1 day ago
Ethereum Between ETF Inflows, Price Risks and a Strong July
-
 Crowdfunding1 week ago
The Italian Crowdinvesting Market Faces Sharp Decline in 2026