Featured
What Are the Sources of Inflation in the U.S.
Since this bear market got underway in early January 2022 we have now surpassed the average length of a bear market with few signs it is actually over. The recent rally has had all the earmarks of a bear market rally. And still no recession. Inflation is easing, but not fast enough as witnessed by numbers out this past week.

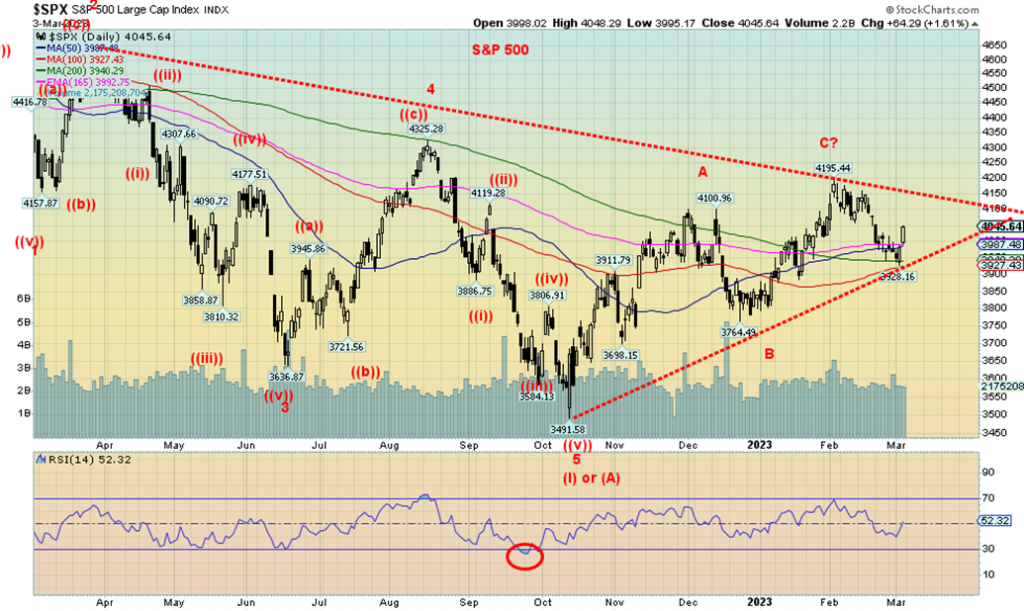
We are now entering the fifteenth month of the bear market that got underway with the top of January 4, 2022. We say that, despite the recent 20% rebound off the October 2022 bottom. A reminder that the S&P 500 is still down about 18% from that high. Yes, January was a good month with a 5.8% gain. But February was a down month, losing 2.5%. Unless we see new highs above the January 2022 high of 4,818 and a confirmation that the bear is over, we remain in a bear market.
Rebounds in a bear market, or bear market rallies, are not that unusual. Probably the most famous hook in a bear market for the S&P 500 was the 26% rally off of the November 1929 low to a high in April 1930. What followed was an 83% decline to a low in July 1932. Ouch! The 2007–2009 bear market did not have any significant rebounds over 10%. But for the current bear we’ve already had the previously mentioned 20% rally, plus one of about 13% (February to March 2022), and another one of almost 19% (June to August 2022).
No, we haven’t yet confirmed a top for the current rebound until we at least break back down under 3,700 for the S&P 500. One thing that was interesting about those rallies was that volume was not a major factor. But volume was quite present when the S&P 500 came out of the March 2009 low. The 2000–2002 bear market had two significant rebounds: 21.7% March to May 2001 and 24.5% September 2001 to January 2002. Again, a characteristic of these rallies was below-average volume. Lesson: beware the low-volume rebound. It most likely is just a bear market rally.
This bear market has now lasted 423 days (to March 3, 2023). That is just above the average bear of 389 days noted by the Stock Trader’s Almanac (www.stocktradersalmanac.com), dating back to 1900. But the range has been 40 days (the pandemic bear February/March 2020) to 959 days (the World War II bear market September 1939/April 1942). Next up is the 472-day bear April 1981/August 1982. Our last worst bear was the 517-day bear of October 2007/March 2009. Is there any good news here? Well, bull markets last on average 787 days. Our last bull market went from March 2020 to January 2022: 652 days for a gain of 97.9%. But that was yesterday. This is today.
As the rally in January unfolded, many were proclaiming the end of the bear market. Inflation was falling, but not fast enough; supply shocks were easing, but not fast enough; interest rates were falling, until they rose again; demand was rising, but it keeps the pressure on inflation.
Markets may have become too complacent about falling inflation. And then out came the numbers in February. Everywhere we looked—CPI, CPI core, PPI, PPI core, GDP Prices, PCE prices—they came in higher than expected. Then GDP came in lower. But the January job numbers were gangbusters, and the weekly initial claims continue at low levels not seen in decades. Job openings, while below their peaks, remain at levels never seen before. Consumer sentiment has been improving, not faltering. Supply chains have improved, but are not where they were before the 2020 pandemic. Meanwhile, demand surged. Supply problems, rising demand. Doesn’t equate except it means higher prices. Told to wait six months for that car you want?
On the labour front, the boomers have been retiring, while there are insufficient newcomers coming up to replace them. Demographic decline is plaguing a number of countries. China’s population fell for the first time in decades. Others falling are Japan, South Korea, Russia, and the EU. Without immigration, Canada and the U.S. would also fall. The result of all of this is we are moving from having a surfeit of workers to a growing shortage of workers.
If we really want inflation to come down, we need a recession. But we are not getting it—yet. China is also back on and that means that they may help increase production, but on the demand side it could translate into further demands for scarce commodities. The great pandemic stock market boom and even the one that came out of the 2008 financial crisis is a classic case of misallocation of resources. Interest rates were too low, too much money sloshing around (thanks to quantitative easing or QE), and the result was not an increase in investment and productivity but instead a huge increase in speculation—stocks, housing, memes, cryptos, and more. A sharp increase in productivity would have helped address supply problems.
As an interesting aside, we follow and are a collector of ancient coins (coins dated between 600 BCE and 1000 AD) and they too have seen a surge in prices. Reasons cited include a desire to hold hard assets. The COVID pandemic had more people at home, resulting in many looking at old or new hobbies, and, as result it created a hoard of new collectors. There has been a surge, particularly in the low-end market, but also a surge in the mid-level and high-end market of ancient coin collecting (or any coin collecting for that matter). We show below a picture of a Lydian stater dating from 545–520 BCE. They are the amongst the oldest coins ever found. The kingdom of Lydia existed from 1200–545 BCE in Anatolia in what is today modern Turkey. The one pictured is an electrum stater bi-metallic gold and silver.
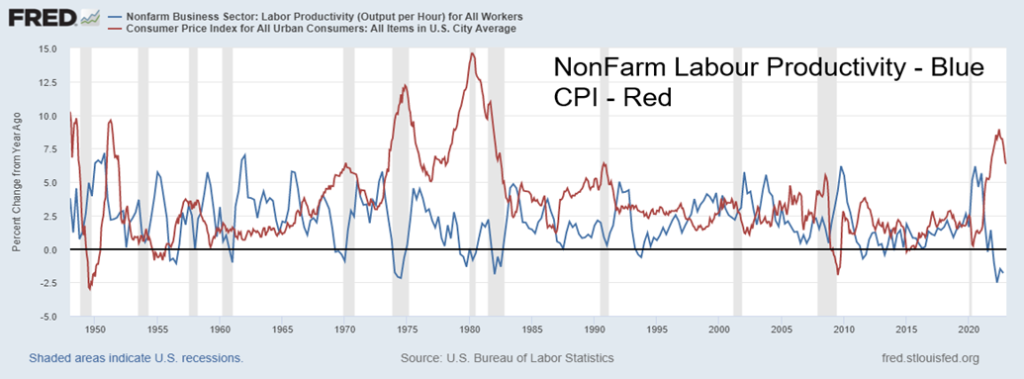
Our other chart below shows the percentage change year-over-year (y-o-y) of nonfarm productivity vs. the CPI. Productivity improved in a low-inflation environment but has plunged in a high-inflation environment. Productivity is growing at the lowest rate ever seen over that 75-year period. Unless inflation comes down sharply, the odds of productivity rising are slim to none.
Non-Farm Labour Productivity, CPI 1948–2023
The Lydian Stater 545–520 BCE
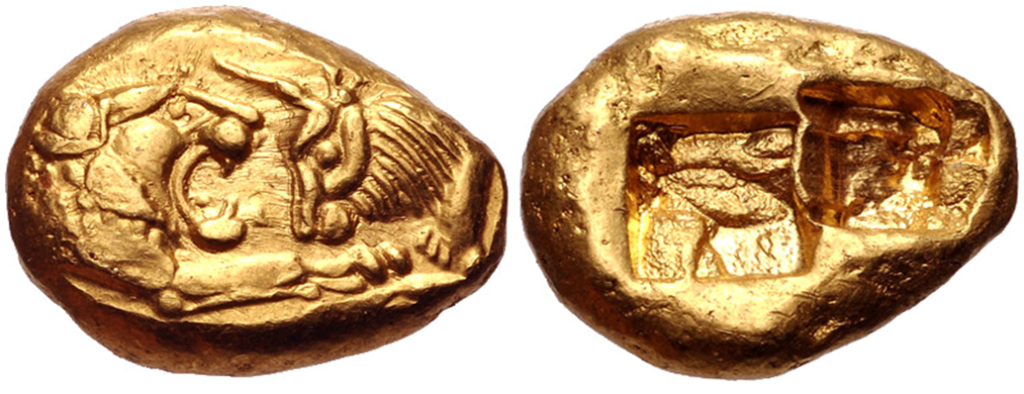
KINGS of LYDIA. temp. Cyrus – Darios I. Circa 545-520 BC. AV Stater (16mm, 8.06 g). Sardes mint. Confronted foreparts of lion and bull / Two incuse square punches of unequal size. Traité I –; SNG Kayhan 1023; SNG von Aulock 8211; SNG Copenhagen Supp. 362. Superb EF. – Sold for $18,500
Seemingly ignored in the supply chain equation is the growing effect of climate change. Droughts are intensifying, negatively impacting food supply; fierce storms, floods, and fires are also having a negative effect, particularly when it comes to cost. Whether we try to adapt to climate change or mitigate it, the costs are in the trillions. Some such as droughts are having a huge negative impact on food prices. Adapting means dealing with the storms, fires, droughts, hurricanes, etc. as they come along. Mitigate means the fight to a cleaner world by using green energy over fossil fuels, even as fossil fuels will never completely go away. Both are also a political fight.
Also negatively impacting everything is the world decoupling. Sanctions, embargoes, and trade wars also have a huge negative impact on world trade and inevitably on stock markets, supply chains, and inflation. Commodity prices also are pushed higher as the world decouples. Both China and Russia are, in different ways, commodity powerhouses. Decoupling from them puts upward pressure on a host of commodities not abundantly found in the Western world. They have what the West needs. As well, in the case of China, they manufacture what the West needs. One can’t turn on a switch overnight and, lo, there is a plant to replace that one in China. We are, however, noting a shift in building new plants in such countries as Mexico.
But what the world will need is investment—in alternative energy, in discovery of metals (commodities), and, as long as we are fighting, more investment in military hardware. The question is, where does the money come from given rising interest rates and a world in debt? The world is already overburdened with debt (estimated at over $300 trillion) and the investments needed require huge dollops of new debt. But with some sovereigns already in a shaky position, thousands of companies clinging on as they too are overburdened with debt, and consumers up to their eyeballs in debt, how can they absorb more debt to keep the economy going? As to government debt, could governments do what they did following World War II and more or less force everyone to buy their bonds? Remember the plea for Victory bonds and more during and after World War II. In Japan they buy the governments bonds; that’s why the Japanese fumble along despite the highest debt to GDP in the entire world. So, do you have savings bonds in your account?
Interest rates, as measured by the U.S. 10-year treasury note, are now creeping back over 4%. Yet inflation remains higher. Our chart below shows this relationship. A reminder that it took pushing interest rates above the rate of inflation in the late 1980s to bring inflation down to more reasonable levels. That suggests to us that we are nowhere near finished with the rising interest rate cycle, and that could eventually have a profound impact on whether we have a soft landing, a hard landing, or no landing as some are calling for. Talk had been for a 50 bp rate hike at the March 21–22 FOMC. However, recently that talk has shifted to only a 25 bp hike. Still, is another hike possibly on its way to 6%?
The rally in January was a nice respite. But, so far, it is only another bear market rally. With the need to raise interest rates further, along with the probability that they will do that, while we are not in an official recession, that suggests to us that the stock market weakness could persist for months longer than many expect. The markets remain overvalued and we still have a way to go down to bring the market back to the mean.
Our chart on the next page shows the S&P 500 since 1900. There are three instances of the S&P 500 overthrowing its 75% prediction band: 1929, 2000, and now. The 1929 top resulted in the Great Depression and an 86% decline to 1932. The 2000 top resulted in a dual decline of the dot.com/high-tech collapse in 2000–2002 and the Global Financial Crisis in 2007–2009. Overall, the index fell 57%. Are we now working on another decline similar to the previous ones? The jury is out. But the dangers are there and they are there for all to see.
U.S. CPI, U.S. 10-Year Treasury Note 1961–2023 Year-Over-Year Change
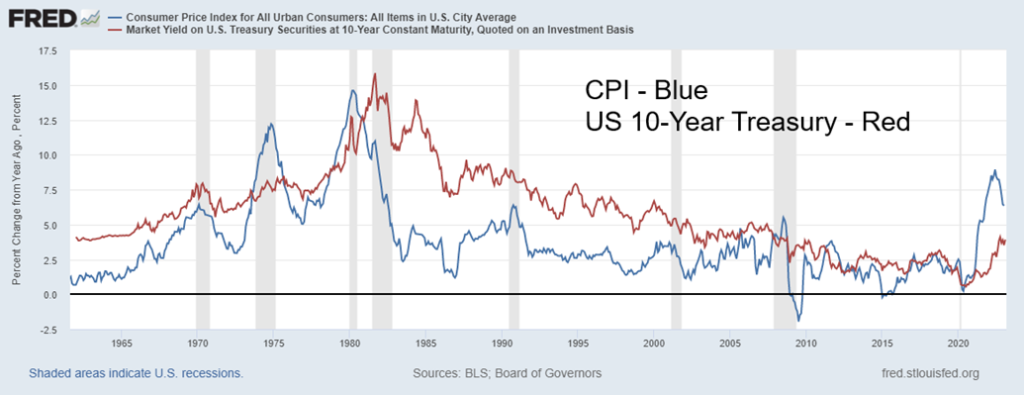
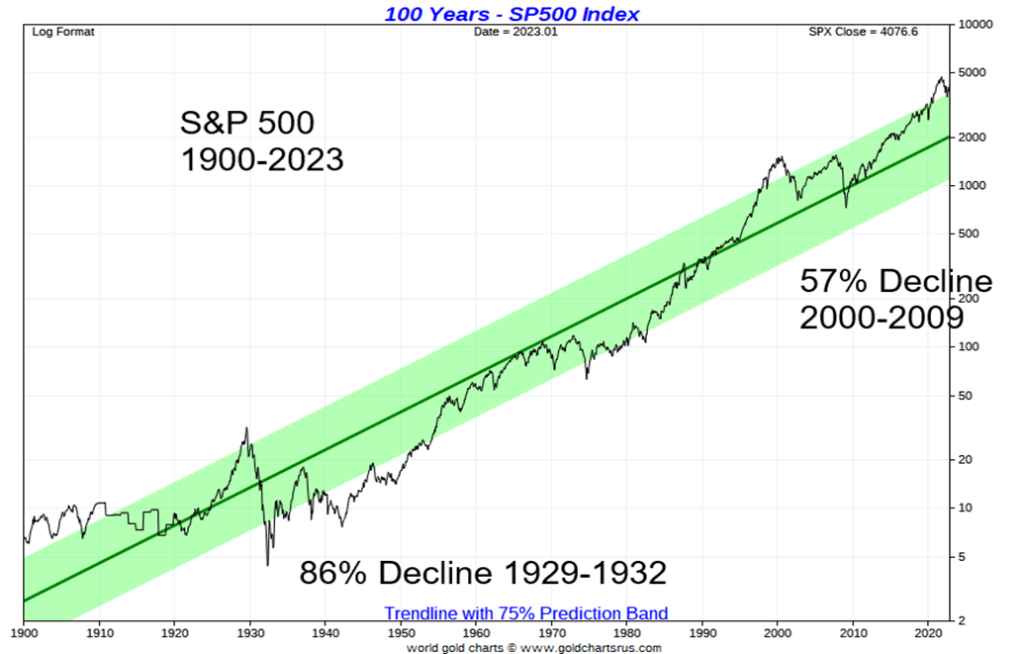
Chart of the Week
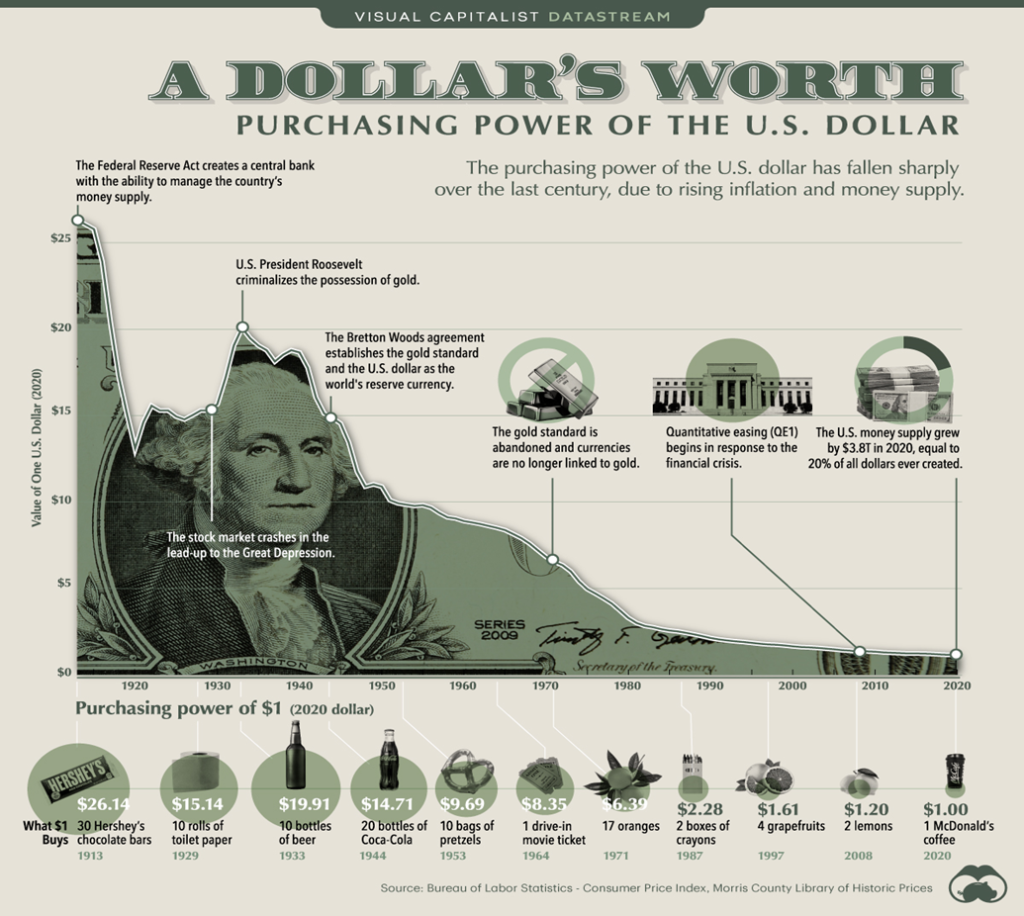
A rarely talked about source of inflation is the falling value of a currency. When one thinks of a currency collapse, thoughts usually turn to the collapse of the Deutschmark during the Weimar Republic in Germany after World War I, or the Mexican peso crisis of 1994, the collapse of the British pound in 1992, the Asian currency crisis of 1997, the collapse of the Russian ruble during the Russian financial crisis of 1998, or countries like Argentina, Turkey, and especially Zimbabwe at any time.
However, when one thinks of a falling currency, one doesn’t usually think of the U.S. dollar. But here we are. The purchasing power of the U.S. dollar has fallen some 98% since the beginning of the Federal Reserve back in 1913. Yes, that chart only goes to 2020 so the purchasing power of the U.S. dollar may be even lower now.
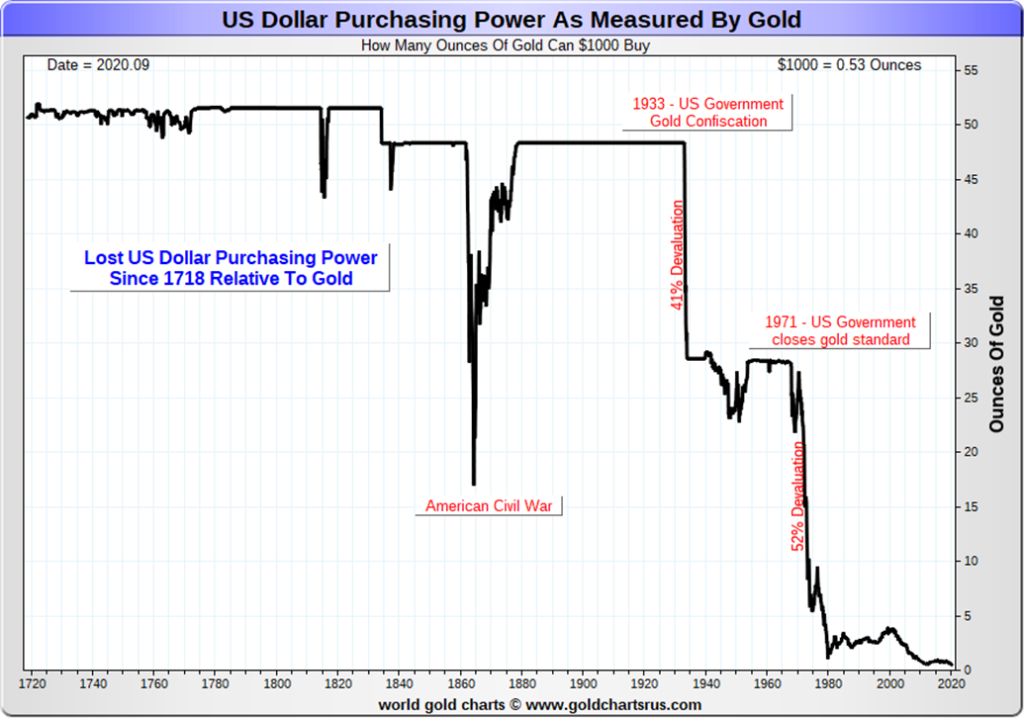
As measured by gold, it looks even worse. Way back in 1913, US$1,000 could buy you roughly 48.4 ounces of gold (gold was priced at $US1 = $20.67). Today that same $1,000 would get you only 0.53 ounces of gold. It doesn’t matter what currency we are talking about, whether it be US$, euros, Canadian $, Swiss francs, pound sterling, Japanese yen, and more, the amount of gold one could buy today with the equivalent of $US1,000 is a lot less today than it was at any time in the past. That is a stark reminder of how much the purchasing power of a dollar has collapsed. To buy that 48.4 ounces would cost you US$89,298, an increase of over 8,900%. Now that is inflation!
This loss of purchasing power impacts everything from the purchase of eggs, refrigerators, cars, or houses. It costs a lot more than it used to. The question is, at what point in time does the fiat currency return to its intrinsic value which is zero?
Yes, a lot of currencies disappeared when the euro came into being. Gone were the French franc, the German Deutschemark, the Italian lira, and many more. And there were others, including the Israeli shekel (replaced by the new shekel), the ducat (replaced by the euro), the groat (replaced by the pound sterling), Sudanese Dinar (replaced by Sudanese pound), and the trade dollar (replaced by the U.S. dollar). Oh, many of these old currencies still exist, but they are strictly for collectors. There are many others. The reality is that a fiat currency is whatever the government deems it to be. Some of this might explain why, back in ancient times, the currency was gold or silver. These always have value and their supply is limited, unlike a fiat currency where the supply is infinite. The Weimar Republic learned that lesson when bags of Deutschemarks were used to keep the fire going, or it took wheelbarrows of them to buy a loaf of bread.
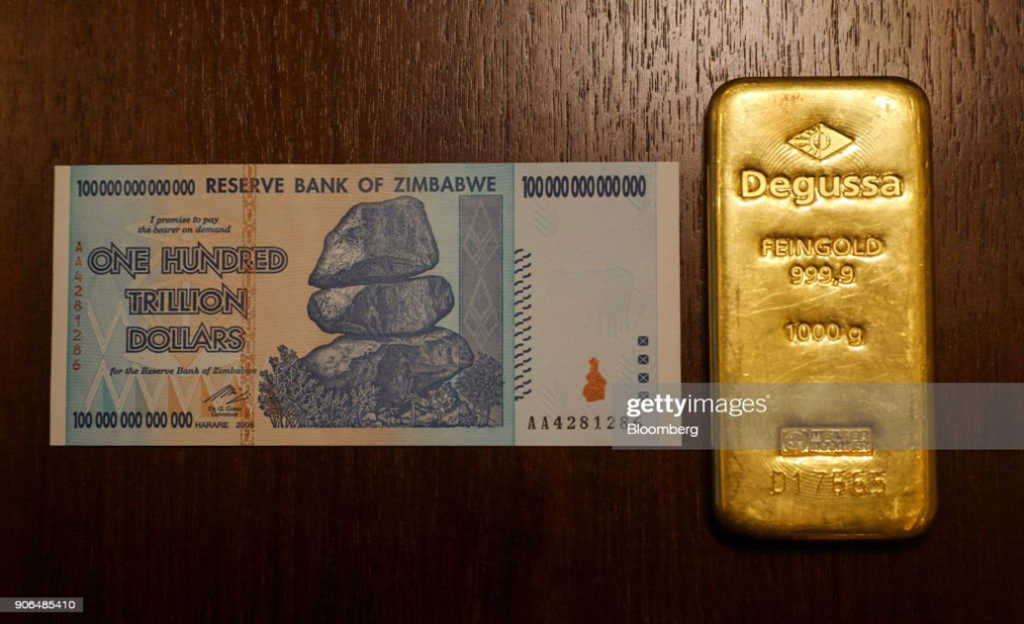
Yes, that is a $100 trillion note of Zimbabwe beside a one-ounce bar of gold. That $100 trillion dollar note is worth about a $1. Yes, that one-ounce bar of gold would cost today roughly $184.5 quadrillion Zimbabwe dollars. Now, that’s a serious loss of purchasing power. Today, Zimbabwe does have a new Zimbabwe dollar but the U.S. dollar, euro, and others are recognized legal tender.
Markets & Trends
| % Gains (Losses) Trends | ||||||||
| Close Dec 31/22 | Close Mar 3/23 | Week | YTD | Daily (Short Term) | Weekly (Intermediate) | Monthly (Long Term) | ||
| Stock Market Indices | ||||||||
| `S&P 500 | 3,839.50 | 4,045.60 | 1.9% | 5.4% | neutral | up (weak) | up (weak) | |
| Dow Jones Industrials | 33,147.25 | 33,390.84 | 1.8% | 0.7% | down | up (weak) | up (weak) | |
| Dow Jones Transport | 13,391.91 | 15,113.11 | 3.3% | 12.9% | up | up | up | |
| NASDAQ | 10,466.48 | 11,689.01 | 2.6% | 11.7% | up (weak) | neutral | neutral | |
| S&P/TSX Composite | 19,384.92 | 20,581.58 | 1.8% | 6.2% | up (weak) | up | up | |
| S&P/TSX Venture (CDNX) | 570.27 | 642.98 | 4.2% | 12.8% | up | up (weak) | down (weak) | |
| S&P 600 (small) | 1,157.53 | 1,269.75 | 1.8% | 9.7% | up (weak) | up | up | |
| MSCI World Index | 1,977.74 | 2,073.38 | (0.7)% | 4.8% | down | up | up (weak) | |
| Bitcoin | 16,535.23 | 22,345.22 | (4.7)% | 35.1% | neutral | up | up | |
| Gold Mining Stock Indices | ||||||||
| Gold Bugs Index (HUI) | 229.75 | 226.24 | 5.8% | (1.5)% | down | neutral | neutral | |
| TSX Gold Index (TGD) | 277.68 | 274.25 | 5.1% | (1.2)% | down | neutral | neutral | |
| % | ||||||||
| U.S. 10-Year Treasury Bond yield | 3.88% | 3.96% | 0.3% | 2.1% | ||||
| Cdn. 10-Year Bond CGB yield | 3.29% | 3.35% | (1.2)% | 1.8% | ||||
| Recession Watch Spreads | ||||||||
| U.S. 2-year 10-year Treasury spread | (0.55)% | (0.90)% | (4.7)% | (63.6)% | ||||
| Cdn 2-year 10-year CGB spread | (0.76)% | (0.88)% | 1.2% | (15.8)% | ||||
| Currencies | ||||||||
| US$ Index | 103.27 | 104.49 | (0.6)% | 1.2% | up | down (weak) | up | |
| Canadian $ | 73.92 | 73.60 | 0.2% | (0.4)% | down | down | down | |
| Euro | 107.04 | 106.33 | 0.8% | (0.7)% | down | up | down | |
| Swiss Franc | 108.15 | 106.78 | 0.5% | (1.3)% | down | up | neutral | |
| British Pound | 120.96 | 120.47 | 0.9% | (0.4)% | down | neutral | down | |
| Japanese Yen | 76.27 | 73.62 | 0.4% | (3.5)% | down | neutral | down | |
| Precious Metals | ||||||||
| Gold | 1,826.20 | 1854.60 | 2.1% | 1.6% | down | up | up | |
| Silver | 24.04 | 21.24 | 1.4% | (11.7)% | down | neutral | up (weak) | |
| Platinum | 1,082.90 | 979.40 | 7.9% | (9.6)% | down (weak) | neutral | up | |
| Base Metals | ||||||||
| Palladium | 1,798.00 | 1,449.00 | 5.1% | (19.4)% | down | down | down | |
| Copper | 3.81 | 4.07 | 3.0% | 6.8% | down (weak) | up | up (weak) | |
| Energy | ||||||||
| WTI Oil | 80.26 | 79.68 | 4.4% | (0.7)% | neutral | down | up (weak) | |
| Nat Gas | 4.48 | 3.01 | 18.0% | (32.8)% | neutral | down | down (weak) | |
New highs/lows refer to new 52-week highs/lows and, in some cases, all-time highs.
For the first time in four weeks, the S&P 500 along with markets put in an up week, gaining 1.9%. So, is this little pullback over? We can’t say that yet, but the S&P 500 did find support at the 200-day MA near 3,940 (low was 3,928). The Dow Jones Industrials (DJI) was up 1.8%, the Dow Jones Transportations (DJT) was up 3.3% and the NASDAQ gained 2.6%. The smaller indices also gained with the S&P 400 (Mid) up 1.8% and the S&P 600 (Small) up 1.8%. That they lagged the S&P 500 is, we believe, a sign of weakness as we prefer that they lead to the upside (as they do to the downside).
In Canada, the TSX Composite was up 1.8% and the TSX Venture Exchange (CDNX) gained a good 4.2%. In the EU, the London FTSE was up 0.9%, the EuroNext gained 2.2%, the Paris CAC 40 was up 2.2%, and the German DAX gained 2.4%. Both the CAC 40 and the DAX are not that far from new highs. A divergence? In Asia, China’s Shanghai Index (SSEC) was up 1.9, the Tokyo Nikkei Dow (TKN) gained 1.8%, and the Hong Kong Hang Seng (HSI) gained 2.8%. China opening again helped Asia. Although we are wondering what impact China’s added capital controls will have on markets. With tensions rising between the U.S. and China, some capital was fleeing.
With the S&P 500 finding support, we must look above to see if it can break out. Only over 4,100 are we poised to go higher. That would be confirmed with new highs above 4,200. But the danger is the downside. A breakdown under 3,900 is negative. But the real breakdown is under 3,700 and that would start to put in doubt the entire January effect of suggesting that 2023 might be a strong up year.
As we note under bonds, the U.S. 10-year broke over 4% this past week on fears that the Fed might hike 50 bp at the March 21–22 FOMC. But now the rumour dropped to 25 bp after some weaker-than-expected economic numbers. However, the labour market remains very tight and that keeps upward pressure on rates. We continue to believe that ultimately the Fed will need to hike above the rate of inflation to bring it down. But that in turn could turn a soft landing into a hard landing. The Fed prefers the former. Some believe the recession will start in Q3 but as long as the labour market remains tight that might delay it.
Stocks had a good week this past week, but upside follow-through is important if we are starting a new leg up. Unless we can get back over 4,100, the odds then favour a failure and return to test lower. And under 3,700 all bets are off for a new advance.
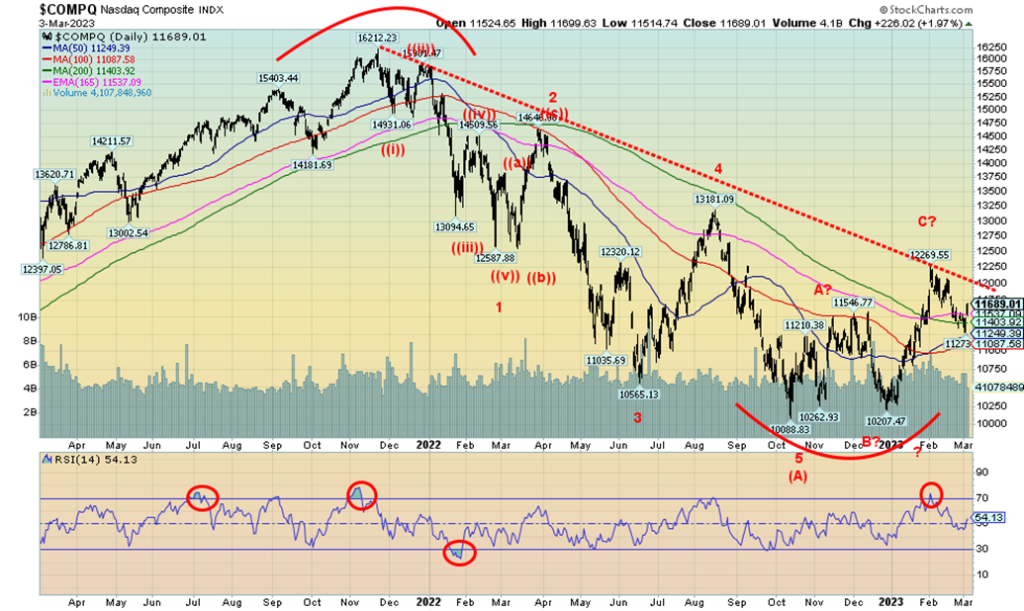
The NASDAQ jumped 2.6% this past week. The NY FANG Index was up 2.5%. Some of the FAANGs had a good week with Meta jumping 8.7%, Google up 5.2%, and the big winner Baidu gaining 15.8%. Chinese stocks coming to life again? There was only one loser, Netflix, down a small 0.6%. The NASDAQ successfully jumped off the rising 50/100-day MAs. The NASDAQ has been a big laggard as the 50-day MA is now just starting to cross over the 100-day MA, but is nowhere near the 200-day MA and the infamous “golden cross.” The 50-day is at 11,250 while the 200-day is at 11,404. Looming above is a potential breakout at 12,000. If that would happen, we might then be looking at the next level of resistance at 13,000/13,200. A reversal and breakdown under 11,270 would be negative, and under 10,750 would suggest the rebound rally is over.
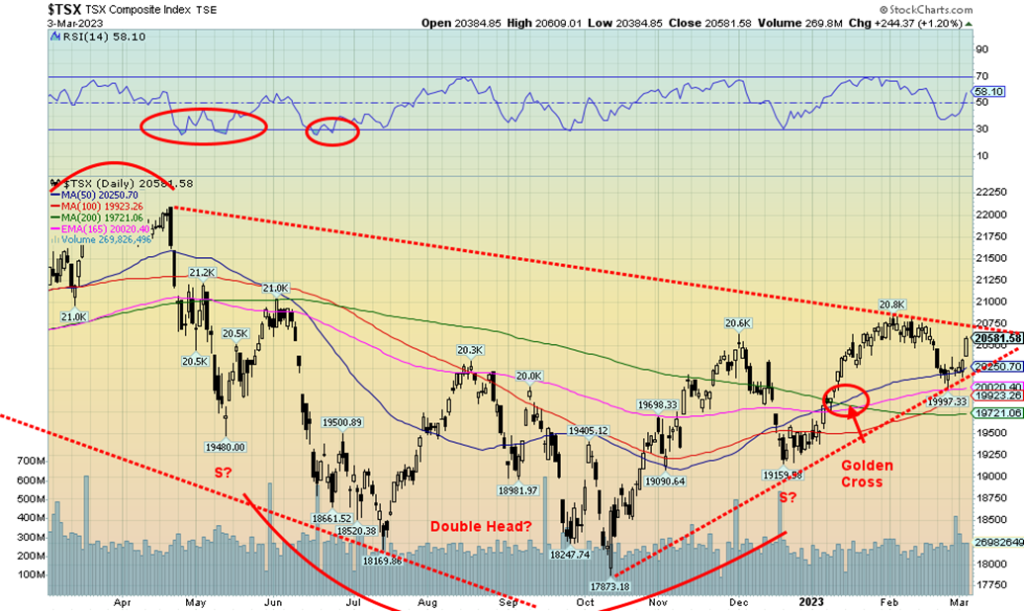
The TSX Composite gained 1.8% this past week. However, the TSX Venture Exchange (CDNX) had a good up week with a 4.2% gain. The CDNX is one of the better-performing indices in 2023, up 12.8% so far. That the junior market is performing so well is a positive. The TSX is now getting near a break over 20,750. But a return back down and breaking 20,000 would be a negative and we would go lower towards 19,700. The sub-indices were really mixed last week with 7 up and 7 down. Leading the way down was Health Care (THC), off 2.5% but the THC is also up a good 11.9% so far in 2023. However, the THC is a small component in the TSX. The big winners were the materials with Materials (TMT) up 7.3%, Metals & Mining gaining 7.9%, and Golds (TGD) up 5.1%. Energy (TEN), which is a larger component in the TSX, jumped 4.4%. So, the up theme this past week was commodities. Overall, they helped the TSX to a gain this past week. As we note, we sit on the edge of breaking out or failing here unless there is solid follow-through from Friday’s up day. Under 19,700 we’d consider this rebound over, and under 19,500 the bear would solidly resume.
U.S. 10-year Treasury Bond/Canadian 10-year Government Bond (CGB)
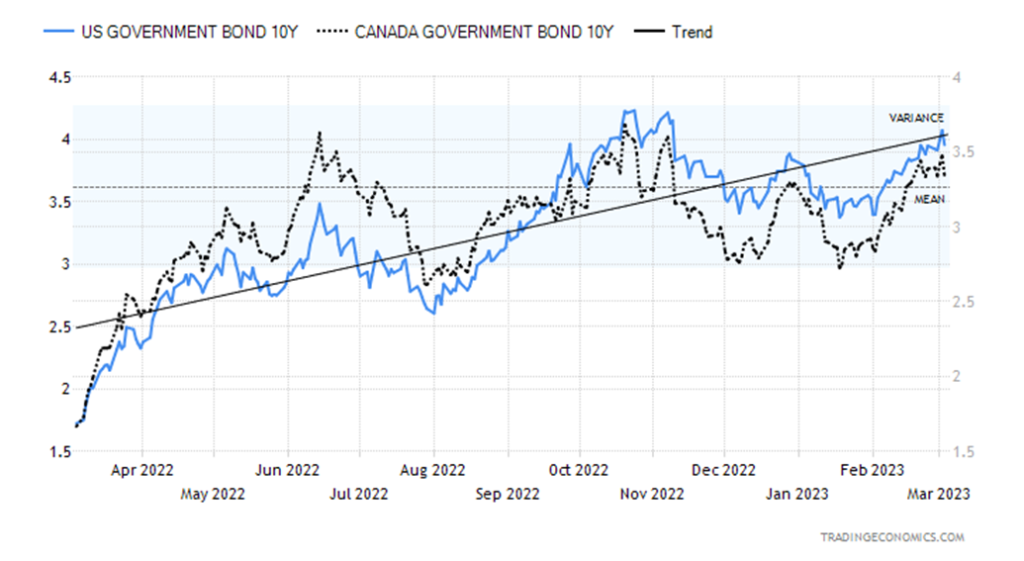
The U.S. 10-year treasury bond leaped over 4% this past week to a high of 4.07% before retreating and closing at 3.96%. A continued tight labour market was one of the prime reasons. The weekly claims fell further this past week to 190,000, down 2,000 on the week and the seventh consecutive week of claims under 200,000. Rarely ever has the weekly claims been under 200,000, let alone for weeks on end. Helping it along is the low labour force participation rate that is at levels last seen in the 1970s as more women were entering the work force. Couple that with near-record high job openings and you have the recipe for a tight job market and continued high employment. This Friday, the employment numbers come out and the expectation is for a nonfarm payroll gain of 200,000 after January’s blockbuster gain of 517,000 jobs. We expect downward revisions to that number, but it’s not going to drop to 200,000. The unemployment rate is expected to tick up to 3.5% from 3.4%. A tight labour market still has the Fed thinking a 50 bp hike on March 21–22 FOMC, but late in the week the rumour was dropping to only a 25 bp hike on some weak manufacturing numbers. That helped push the 10-year back under 4%. The Global PMI came in at a disappointing 47.3 and the manufacturing PMI at 47.7. Anything under 50 is signaling a potential recession. The non-manufacturing PMIs continued strong at 50 or higher. House price indices falling and the Chicago PMI falling to 43.6 when they expected 45 also helped bring the 10-year back down under 4%. But the labour market is maintaining upward pressure. The 2–10 spread remained relatively steady at negative 90 bp, up from negative 86 bp. Canada’s 10-year Government of Canada bond (CGB) fell to 3.35% from 3.39% while the 2–10 spread was at negative 88 bp. The 2–10 spread plus the 3 month–10 spread are all still pointing to recession. Many now expect a recession to start by at least the third quarter. A drop under 3.75% for the 10-year would be positive, but regaining back over 4% would be negative and suggest that we could see new highs. The high was 4.23% back in October 2022.
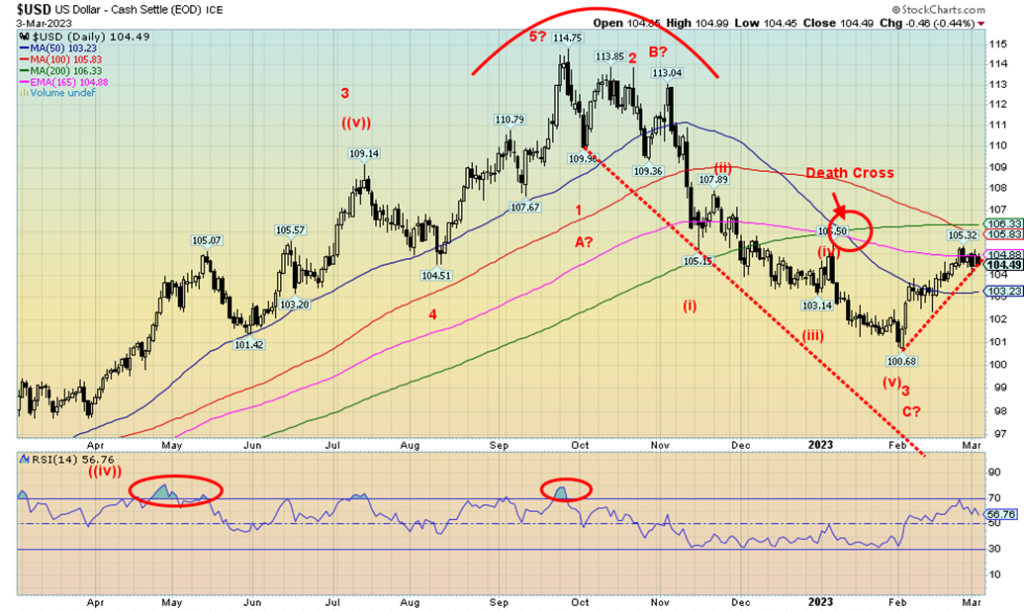
The US$ Index faltered this week at the 165-day exponential MA and still below the 200-day MA. We can’t help but notice the 100-day MA is in the process of crossing over the 200-day. Another sign that we could be in a bear market and not in the process of beginning a new bull? The US$ Index lost 0.6% this past week. The euro was up 0.8%, the Swiss franc gained 0.5%, the pound sterling was up 0.9%, and the Japanese yen up 0.4%. The Canadian dollar gained just under 0.2%. The US$ Index closed on the still-developing uptrend line. A firm break under 104.25 and especially under 104 could send us lower towards 103. Under 103 we could be looking at new lows under 100.68, the most recent low. Looming above is resistance at the 200-day MA near 106.30. If we got above that level, the next level would be 108. Above that level we’d say we are in a new strong up move. A weaker US$ Index would be good for gold. A stronger one and gold would normally fall. We are not sure this rally is over. This appears to be a correction to the downdraft from 114.75 to 100.68. Points it could reach are 106 but above that it could get to 108. Above 111.50 new highs are probable. We’d only turn down under 103 and especially under 102.
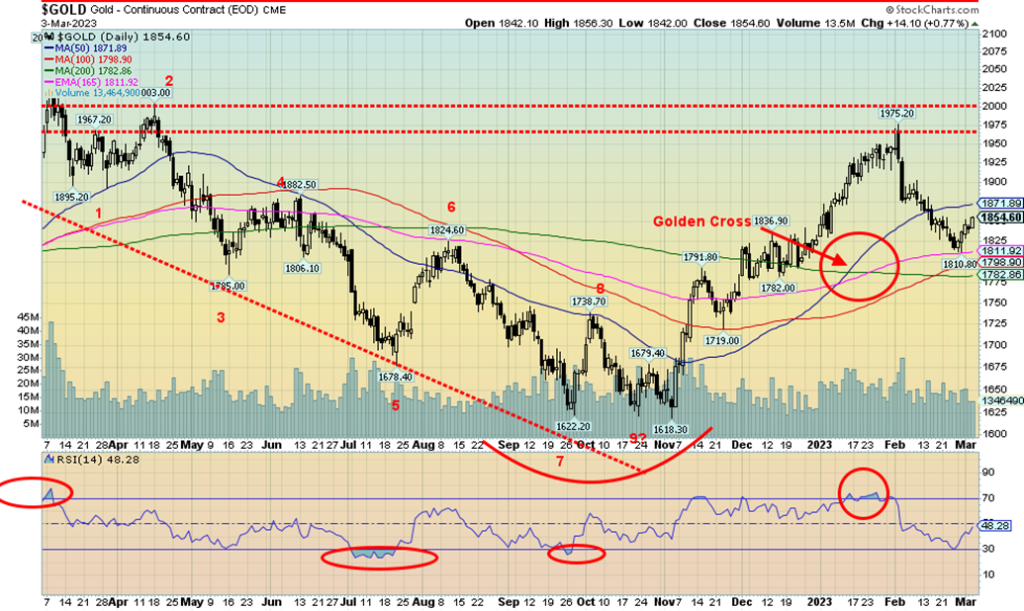
With the US$ Index easing a bit this past week, it helped gold to its best week since mid-January. What may have also helped gold into the latter part of the week was the U.S. 10-year leaping over 4% and then retreating to close at 3.96%. Finally, rumours of a 50 bp hike at the March 21–22 FOMC have eased to only a 25 bp hike. All that has helped gold prices.
We note that the CFTC COT report is still lagging as well. Currently, we are only up to February 7 (we should be at February 28). However, we couldn’t help but notice that the commercial COT for gold improved to 30% that week from 29%. Silver did even better as its commercial COT rose to 38% from 35%. Does it mean we are poised for a rally? Well, it is possible, but so far we are not seeing any clear signs of it. Monday, March 5 is the start of the annual Prospectors and Developers Association of Canada (PDAC) wind fest. It lasts until March 8. Normally, the gold market has rallied into PDAC then faded. Why? It was based on the premise that things were pumped up before PDAC, and then when it happened it was time to sell. Note last year’s rally peaked on March 8. So far this year we were early with a peak on February 2. Is it a classic buy the rumour, sell the news?
There have been a few mergers of late that are catching some attention. First is the Newmont pursuit of Australian Newcrest Mining. That’s a potential $17 billion if it gets consummated; however, that’s not a guarantee. A much smaller one was B2Gold’s takeover of junior Sabina Gold & Silver. But the $17 billion Newmont/Newcrest is the largest out of some $28 billion in potential deals as we go into PDAC. Could PDAC bring more?
Gold finally managed to close over $1,850, one of our points, which suggests to us that we may have made a low. But we are nowhere out of the woods. What would be better would be a close over $1,875 and especially over $1,900. All good, but we are going into PDAC, a period that usually sees a high in gold, not a low. Worse, silver was the worst-performing of the precious metals this past week. We want to see silver leading, not lagging. At least the gold stocks had a good week and, as with silver, we want to see them leading. The Gold Bugs Index (HUI) was up 5.8% and the TSX Gold Index (TGD) gained 5.1% this past week. Silver was up a paltry 1.4% while gold gained 2.1% and platinum jumped 7.9%. Palladium rebounded up 5.1% and copper, which should lead as well, was up 3.0%.
What’s key now is that we don’t go back under the recent low at $1,810. A breakdown under $1,775/$1,800 spells trouble and a potential drop towards $1,700. Under $1,700 new lows are probable under $1,618 and targets could be down to $1,500. Key dates for gold coming up are the job numbers out next Friday, March 10 and the FOMC on March 21–22. Either one could ignite a rally or the opposite—a down market. Elliot Wave International (www.elliottwave.com) believes we are still in a gold bear and believe this current rally is merely a bear market rebound. Looming above is the recent high at $1,975 and it would be essential for us to take out that level and also take out $2,000 above if we have any hope of a more significant up move. To even think about that we need to take out $1,900 first. There are a lot of bulls out there (always seem to be a lot of gold bulls even as the most of the market ignores the gold market), and any rebound seems to get them excited that we are now taking off into the stratosphere. They are persistent if nothing else.
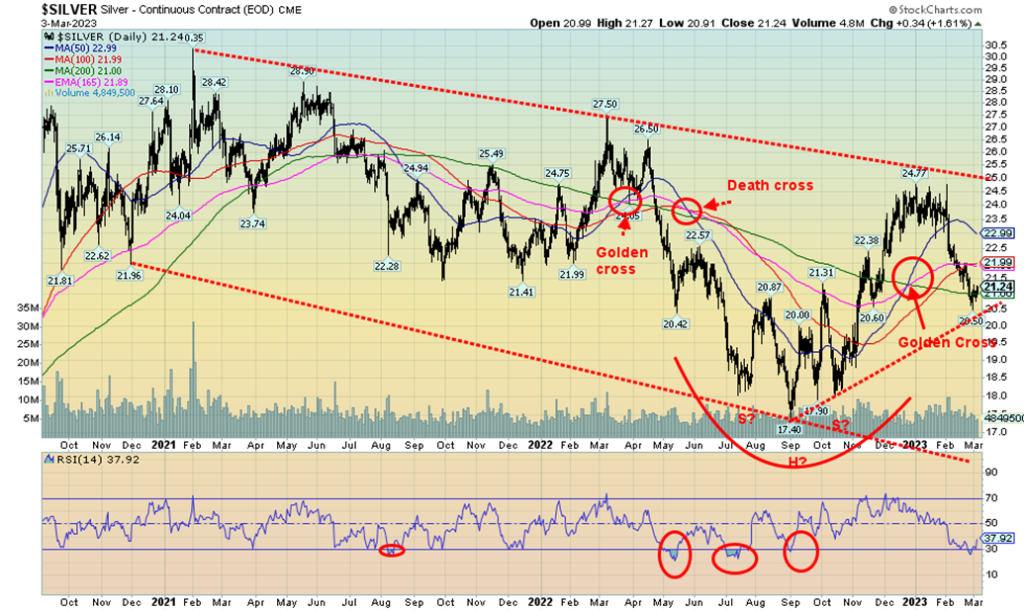
Silver gained 1.4% this past week but was a disappointment. Why? Because when the precious metals are rising, we’d like to see silver lead. Silver does normally lead in a bull market. But not only did silver lag gold, silver also lagged platinum, palladium, copper, and the gold stocks. The Gold/Silver ratio is at an expensive 87.32 as silver remains cheap compared to gold. The ratio needs to break under 70 to suggest that silver is finally leading. And it needs to break under 50 to suggest that silver is actually getting more expensive than gold. We haven’t seen the gold/silver ratio under 50 since the big runup in gold/silver prices into the 2011 high when silver hit almost $50. The high for silver in 1980, also near $50, remains the landmark high for silver. On an inflation-adjusted basis, we’ve rarely approached that again. A far cry from the gold/silver in nature which is closer to 16. At that famous 1980 high, the ratio actually fell to just under 16.
So far, silver appears to be holding that breakdown line, currently near $20.25. A breakdown under $20 for silver could be fatal. Under $19, new lows below the September low of $17.40 are almost assured. To the upside, a low would not be potentially in place until we break above $22. Above $23, silver could rise further towards $25. Over $25, we’d be in new territory and then could look higher towards $27/$30. Until over $22 at least, the risk remains to the downside. And we need to see silver take on some leadership. Its failure this past week suggests to us that we are not finished this recent downtrend yet.
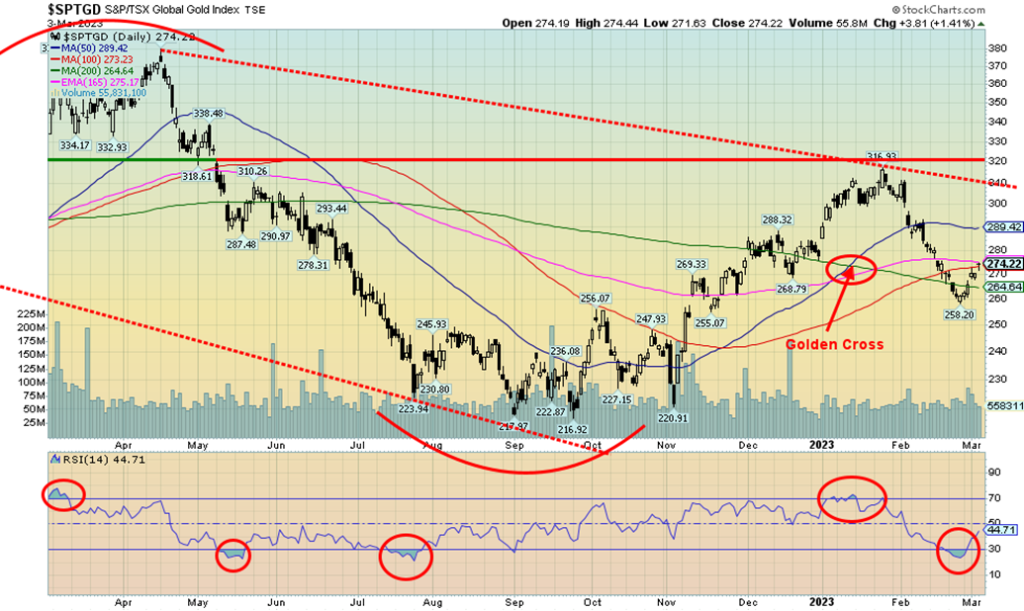
Finally, gold stocks had a good up week with the TSX Gold Index (TGD) gaining 5.1% and the Gold Bugs Index (HUI) up 5.8%. We are now up 6.2% from that recent low and for both the TGD and the HUI we are almost back to break even on the year. Hitting up to 275 saw the TGD run into a resistance zone, but above 280 we should run up to 290. We don’t really break out until we get over 310/320. The previous high was at 317. The RSI for the TGD was at 44.7, which is only approaching neutral and the Gold Miners Bullish Percent Index (BPGDM) was at 34, which is still nowhere near neutral. The recent high was only at 55, which is basically neutral for the gold stocks. The Gold/HUI ratio at 8.2 continues to suggest that the gold stocks are cheap compared to gold itself. Unfortunately, we’ve been like that since 2014 so it is now considered normal. But that wasn’t always the case as from 2002 to 2008 the gold stocks were considered expensive vs. gold. However, back then the gold stocks were leading gold higher. That’s not the case today. The gold stocks remain unloved and unowned. That’s especially true of the junior gold miners that trade primarily on the TSX Venture Exchange (CDNX). They could announce the greatest gold discovery in the world and the stock would sell off. When one looks at the action of meme stocks, cryptos, etc., one wonders why junior gold miners languish when they have something real. Such is the mixed-up market today. While we are working on a but signal (golden cross), it is no guarantee we’ll move higher. Ideally, we’d like to see gold stocks take leadership regarding gold. That would result in an improvement of the Gold/HUI ratio, but we’d need to break down under 5.5 on the ratio to suggest that maybe we are really going higher. Support for the TGD could be gathering in the 250/260 zone. But a breakdown under 260 once again could be trouble and new lows ahead.
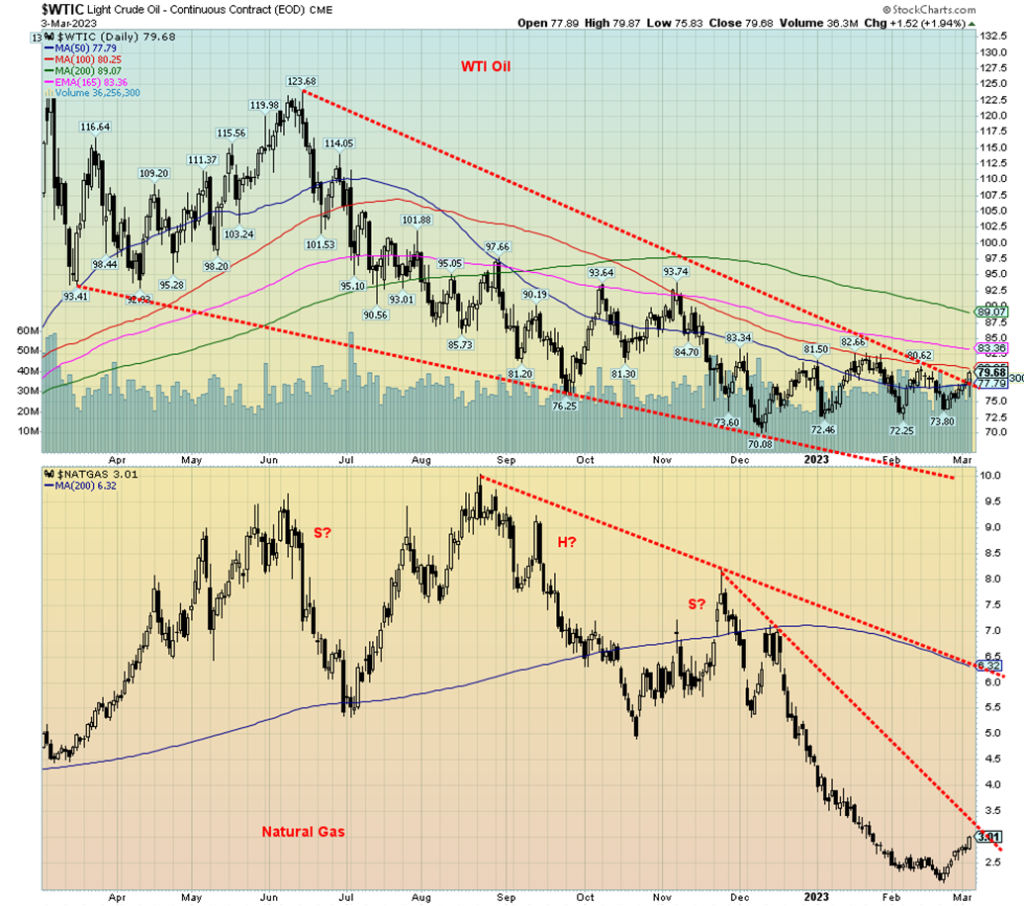
It was a mixed-up week for oil prices as rising inventories and a rumour that the UAE was considering leaving OPEC battled with inflation woes and a rebounding Chinese economy. In the end, oil prices finished the week higher as WTI oil gained over $3 on the week or 4.4%. Brent was up as well, but not as much, gaining 2.8%. But
the real star of the week was natural gas (NG) leaping on colder weather and winter storms, gaining 18%. In the space of a mere two weeks, NG has leaped 42.6% but is still down 70% from the August 2022 high. The outside week reversal two weeks ago appears poised now to break the downtrend line from November. That in turn could set our sights on the 200-day MA, currently up near $6.30. Rising NG prices do have some potentially negative impacts, particularly if the supply situation changes in the EU. Regardless of this, for the moment at least, EU NG at the Dutch Hub fell this past week, losing 11.8%, a significant divergence with NG at the Henry Hub in Louisiana.
Unless WTI oil breaks out, then NG and oil could begin to diverge. Nonetheless, WTI oil appeared to break out of its downtrend line on Friday so maybe it will be on its way higher. However, a reminder we’ve had that happen before only to see oil prices waffle and go back down. False breakouts. It happens. That 200-day MA for WTI at $89 still appears to be a long way away. Nonetheless, it is not unusual to see NG and WTI diverge with each other with one rising and the other falling.
The energy stocks liked it, however. The ARCA Oil & Gas Index (XOI) jumped 3.7% and the TSX Energy Index (TEN) was up 4.4%. A good week all around for WTI, NG, and the energy indices (stocks). What’s key now is that there is more follow-through for oil this coming week. If we could get through $84, then $89/$90 for WTI looks possible. But if it reverses once again and falls, then that recent low just under $74 must hold or we could see new lows below $70. We doubt it, but anything is possible. NG has resistance up to $3.25 and then up to $4. NG doesn’t really break out until over $4. A breakdown under $2.65 would be negative.
__
(Featured image by sergeitokmakov via Pixabay)
DISCLAIMER: This article was written by a third party contributor and does not reflect the opinion of Born2Invest, its management, staff or its associates. Please review our disclaimer for more information.
This article may include forward-looking statements. These forward-looking statements generally are identified by the words “believe,” “project,” “estimate,” “become,” “plan,” “will,” and similar expressions. These forward-looking statements involve known and unknown risks as well as uncertainties, including those discussed in the following cautionary statements and elsewhere in this article and on this site. Although the Company may believe that its expectations are based on reasonable assumptions, the actual results that the Company may achieve may differ materially from any forward-looking statements, which reflect the opinions of the management of the Company only as of the date hereof. Additionally, please make sure to read these important disclosures.
Copyright David Chapman 2023
David Chapman is not a registered advisory service and is not an exempt market dealer (EMD) nor a licensed financial advisor. He does not and cannot give individualised market advice. David Chapman has worked in the financial industry for over 40 years including large financial corporations, banks, and investment dealers. The information in this newsletter is intended only for informational and educational purposes. It should not be construed as an offer, a solicitation of an offer or sale of any security. Every effort is made to provide accurate and complete information. However, we cannot guarantee that there will be no errors. We make no claims, promises or guarantees about the accuracy, completeness, or adequacy of the contents of this commentary and expressly disclaim liability for errors and omissions in the contents of this commentary. David Chapman will always use his best efforts to ensure the accuracy and timeliness of all information. The reader assumes all risk when trading in securities and David Chapman advises consulting a licensed professional financial advisor or portfolio manager such as Enriched Investing Incorporated before proceeding with any trade or idea presented in this newsletter. David Chapman may own shares in companies mentioned in this newsletter. Before making an investment, prospective investors should review each security’s offering documents which summarize the objectives, fees, expenses and associated risks. David Chapman shares his ideas and opinions for informational and educational purposes only and expects the reader to perform due diligence before considering a position in any security. That includes consulting with your own licensed professional financial advisor such as Enriched Investing Incorporated. Performance is not guaranteed, values change frequently, and past performance may not be repeated.


Blockchain Evolves Toward AI, Finance and Quantum Security
Blockchain is evolving beyond crypto into finance, AI applications, and digital markets, while security and regulation remain challenges. Quantum threats...


The Italian Crowdinvesting Market Faces Sharp Decline in 2026
Italian crowdinvesting market continued to decline in 2026, with fundraising falling 36.8% year-on-year to €164.19 million. Platforms and active campaigns...


Sartorius Stedim Biotech Maintains Growth Momentum in H1 2026
Sartorius Stedim Biotech reported solid H1 2026 results, with revenue reaching €1.527 billion and EBITDA rising to €479 million. Growth...


Bank of Africa Launches BOA MDM Network to Boost Diaspora Investment in Morocco
Bank of Africa launched the BOA MDM Network to channel diaspora remittances into productive investment, aiming to raise their share...


Switzerland’s Medical Cannabis Reform Advances Access, But Barriers Remain
Switzerland’s 2022 medical cannabis reform improved patient access by removing federal approval requirements, but challenges remain. MEDCAN highlights barriers including...
 |
|
 |  |
 |
|
-

 Africa2 weeks ago
Morocco Cuts Card Fees to Spur Digital Payments, but Uncertainty Remains
-
 Biotech1 day ago
Sartorius Stedim Biotech Maintains Growth Momentum in H1 2026
-

 Cannabis1 week ago
Virginia Cannabis Market Could Reshape Regional Competition
-

 Impact Investing4 days ago
Ecobnb Turns Sustainable Tourism Into Measurable Impact