Business
Will the soybean market rise in 2017, despite bad weather conditions?
Can soybeans continue to hold positive structure?

What is new in the soybean market? After releasing the latest USDA report, many farmers began asking themselves – Will soybeans remain on the positive side?
Soybeans have been the recipient of notable buying interest over the past few months, originally stemming from concerns of adverse weather in key South American growing regions. The latest USDA figures highlighted production figures out of Brazil and Argentina that don’t appear to be as bad as originally expected. With a notable increase in 2017/2018 Soybean expected acreage and dissipating weather premiums in the soybean market, many participants find themselves asking “Can soybeans continue to hold positive structure?”
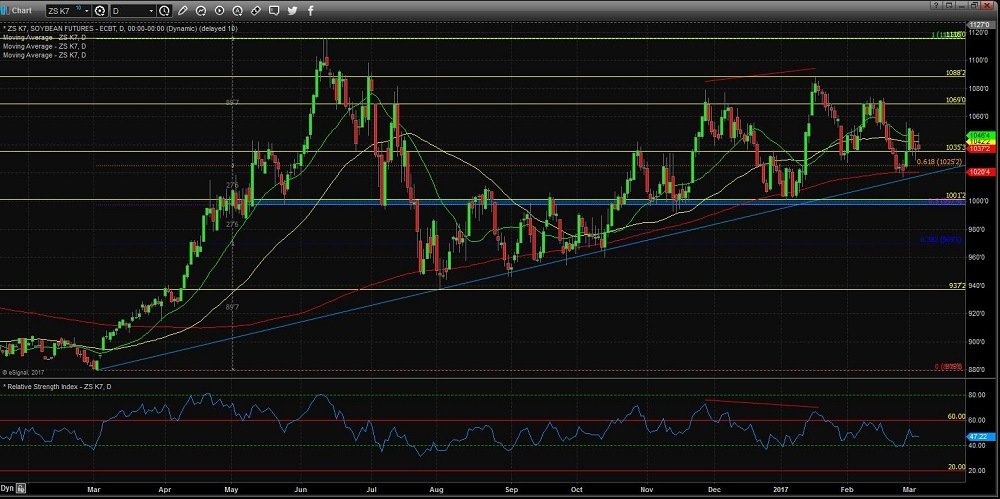
A quick look at the daily chart (K’17 Soybeans) shows a market that has been maintaining positive structure highlighted by consecutive high peaks and higher troughs. Following last spring’s blow-off top, the market hosted a fierce correction that eventually found a bottom around $9.40. Since then, soybean prices have consistently produced relatively higher peaks and higher troughs on an intermediate term basis, consistent with that of a bull market. While the market appears largely neutral to slightly negative from a longer term standpoint (dating back to the 2012 peak), certainly an argument could be made that the near-term bias is positive given the continual press higher since the August lows.
But why? Soybean 16/17 USDA ending stocks were pegged at 420 million bushels in the most recent USDA WASDE report with Brazil and Argentina pegged at 104.0 and 55.5 million tonnes respectively. Many analysts are already anticipating a 2-4 million ton revision higher in the Brazilian crop, further adding to the 16/17 world ending stock figures pegged at 80.4 million tonnes as of February 9th. Despite the strong supply situation seen in the bean market, many participants feel as though large money managers are to blame for the continual rise in bean prices. As we gear up for the 2017/2018, initial estimated for soybean acreage is seen near 88.6 million, up 5.2 million acres from the 2016 season. As more farmers switch to soybeans in search of more advantageous pricing, many participants are eager to see whether or not bean prices can maintain these prices.
From a technical standpoint, the market remains in a near-term positive environment; however, the $0.50 sell-off seen at the end of February tested a critical area of support that will need to hold is soybean prices are to avoid further declines. The 200 day moving average comes into play around the 1020’4 level, which appears to be in the same area as the ascending trend line originating from the March 2016 low. If soybeans are to avoid a retest of the $10.00 level, look for prices to remain above the $10.20 area on a closing basis. Should the market begin to rollover below this support area, a sharp move down to $10 cannot be counted out given the lack of support levels between $10.20 and $10.00.

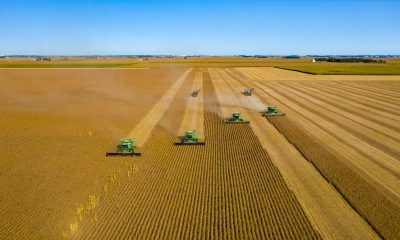
Photo © Erik Tatje
Despite a strong argument for lower prices in the soybean markets, the reality is that beans continue to be in a firm near-term bull trend and the bias remains positive. Recent strength in the market highlights a firm bounce off of previously noted support around $10.20 in the May contract, which will be the key area to watch in the coming weeks. Initial upside targets in this market can be seen around $10.55, $10.70 and $10.88. A final note to consider is the action in the RSI indicator, specifically relative to price action. The relatively higher peak on January 18th corresponded to a relatively lower peak in the RSI indicator, highlight a bearish divergence signal that played out nicely from Jan. 18th through the 30th. The RSI has continued to put in lower peaks since this signal was generated and appears to be having a hard time holding above 60, which often times can be looked at as the “overbought” level in a bearish market environment (per a 80/40 and 60/20 rule for bull / bear market environments). While the indicator hasn’t given a definitive indication of a reversal in trend, the ADX indicator has declined to a sub-20 reading (currently at ~12.70) which indicates a lack of trend. Participants should consider monitoring these key indicators going forward as they have the potential to provide useful signals and direction in the market.
—
DISCLAIMER: This article expresses my own ideas and opinions. Any information I have shared are from sources that I believe to be reliable and accurate. I did not receive any financial compensation in writing this post, nor do I own any shares in any company I’ve mentioned. I encourage any reader to do their own diligent research first before making any investment decisions.
For a comprehensive outlook of the entire Agricultural sector, I encourage readers to request our free 2017 Agricultural Outlook Guide, which can be found here.

-

 Fintech2 weeks ago
Fintower Secures €1.5M Seed Funding to Transform Financial Planning
-

 Impact Investing7 days ago
BNP Paribas Delivers Record 2025 Results and Surpasses Sustainable Finance Targets
-

 Biotech2 weeks ago
Twogee Biotech Advances Industrial Enzyme Solutions for Circular Production
-

 Crypto4 days ago
Uniswap and BlackRock Partner to Launch BUIDL in DeFi


You must be logged in to post a comment Login