Markets
I’m Not a Bear on the Stock Market Just Yet
The Dow Jones has been in a strong position, advancing 17.2% since November 2022. However, rising daily volatility suggests caution, reminiscent of the 2020 market crash. Despite short-term bullishness, there are concerns about overvaluation and potential future downturns. The market’s current stability is fragile, and further monetary intervention could exacerbate risks.

This week the market was down big, with lots of people selling. Of course, with every trade there always is a seller, and a buyer. But this week the buyers were offering less, which the sellers were willing to take.
In my usual surfing of the internet, I’ve seen people who usually don’t cover the market, comment on how the market was going down this week. But I know what everyone who reads my market commentary wants to know; is the magma beneath Wall Street stirring once again, soon to erupt in a monster flow of lava? Such a market event could raise Earth’s temperature by one hundred, or more degrees, melting the Artic Ice Cap, resulting in a mass polar bear migration towards California and Florida.
Hey, I’m just a high-school graduate who spent 20 years as an enlistedman in the US Navy. I don’t know nothing about that magma or polar bear stuff. So, maybe it will, and maybe it won’t. But melting ice caps and migrating polar bears does sound scary. So, seeing this on the internet, it could be true. At Friday’s close, all I can say for a fact is, after over 100 years of Democratic Party control over New York City, a few meters of lava covering lower Manhattan, could only help draw tourism back to that once magnificent city.
But Mark! What about the stock market? Are we teetering on the edge of the abyss? Oh that. Let’s look at the Dow Jones’ BEV chart below. It closed the week with a BEV of -3.55%, well within scoring position. The Dow Jones has been in scoring position since last November 20th, where it has since advanced from 35,151 to 41,198 on July 23rd. This is an advance of 6047 points, a gain of 17.2% in the past nine months.
So, as long as the Dow Jones remains in scoring position, there is reason to believe the Dow Jones still has a few new, or maybe many new all-time highs to come, before my readers need to fear about any polar bears walking down their streets, as they migrate towards San Diego, California.
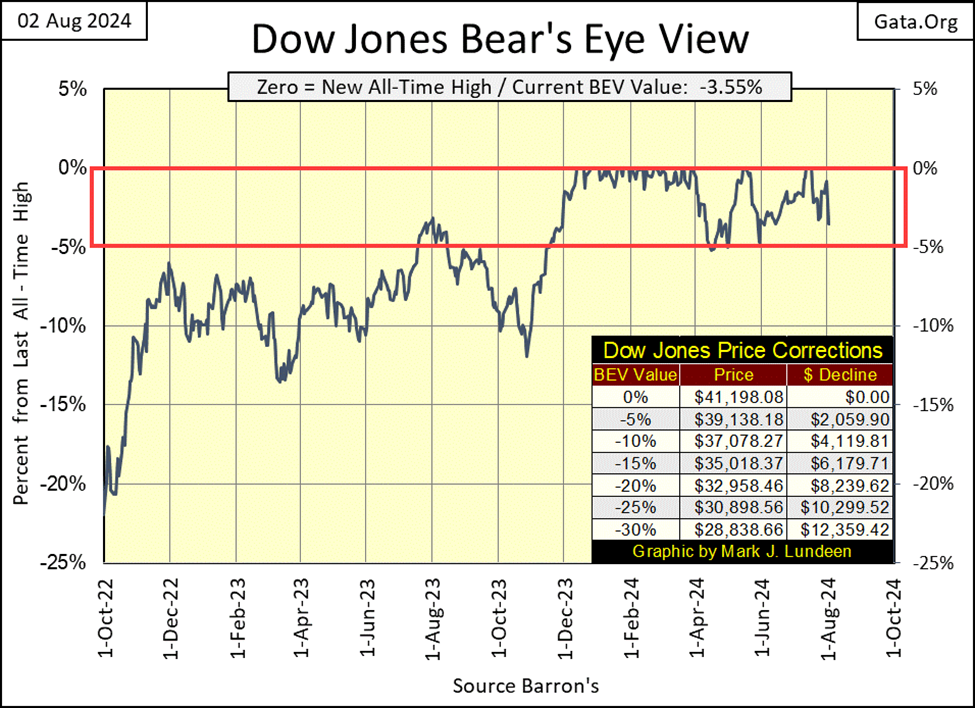
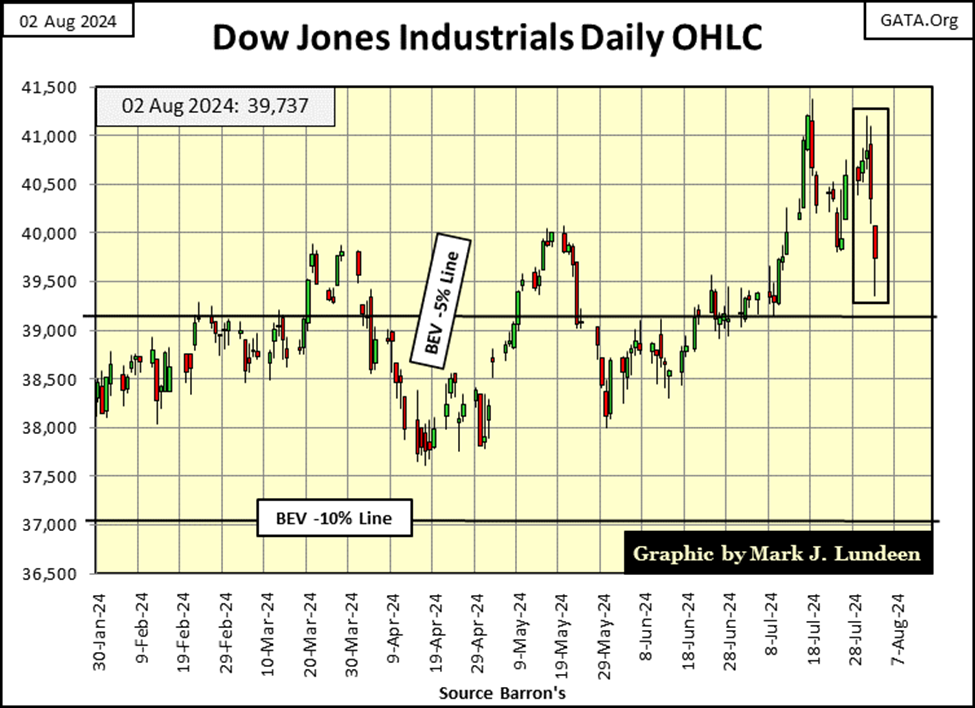
But that is the view of the market via the Dow Jones’ BEV chart. The market can look different from one chart to another. Such as with the Dow Jones in daily bars below.
The feature to note in the chart below, is how daily volatility; the daily moves up and down for the Dow Jones has increased these past three weeks. We’ve not seen any actual days of extreme volatility, Dow Jones 2% days, and haven’t since 02 June 2023, over a year ago, when the Dow Jones moved up 2.13% from its previous day’s close. Though on Friday, we would have seen a negative Dow Jones’ 2% day, had the Dow Jones closed at its lows of the day.
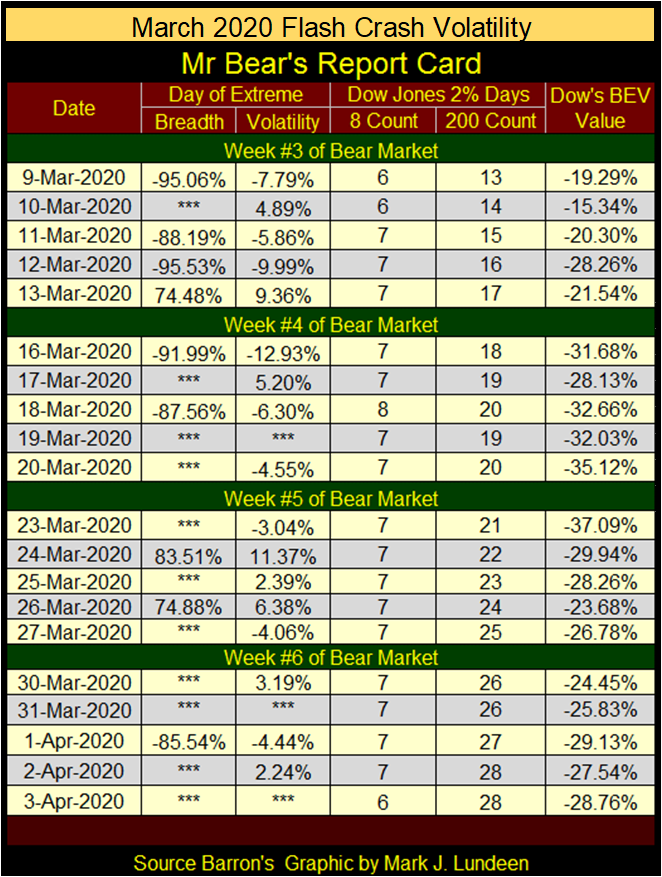
Why rising daily volatility is something to keep tract of, can be seen below in Mr Bear’s report card from the March 2020 Flash Crash. Look at the Days of Extreme Volatility during March and April of 2020. For weeks on end, the Dow Jones daily moved more than +/- 2%, from one day to the next. This was a vicious mauling of the market by Mr Bear, that four years later, everyone has forgotten about – except me.
This is what happens when the magma beneath Wall Street begins to shift, and why FOMC Idiot Primate Powell began “injecting” trillions-of-dollars of “liquidity” (monetary inflation) into the market with his Not QE#4 four years ago, to “stabilize market valuation” in March / April 2020.
Had he not, I believe in 2020 we would have seen a repeat of the Great Depression’s 90% crash in the Dow Jones. That FOMC Idiot Primate Powell was successful in “stabilizing market valuations” four years ago with his Not QE#4, only deferred the pending flow of magma on Wall Street seen below. Because in August 2024, market valuations remain grotesquely overvalued, only more so than it was in 2020.
Ultimately, Mr Bear will get his way, and he will then claw-back market valuation to such a degree that “market experts” today would think impossible. Either that, or Idiot Primate Powell will do another, and then another QE to “stabilize market valuations,” until the US Dollar ceases to be money, and quite possibly both.
But all this is in our uncertain future. For now, things in the market are nice. Looking at the BEV values for the major market indexes I follow below, we saw some new all-time highs (BEV Zeros = 0.00%) this week, and the week closed with eight of these indexes in scoring position (BEVs of -0.01% to -4.99%).
Okay, no one in the stock market was raking in the chips this week. But pull backs, exactly like this one, are only to be expected during any prolonged market advance. Until the Dow Jones begins seeing days of extreme market volatility, those dreaded Dow Jones 2% days, and we see these market indexes begin slipping beneath their BEV -10% levels in the table below, I can, and will remain short term bullish.
But should someone want to get the heck out of this market completely right now – I wouldn’t talk them out of it.
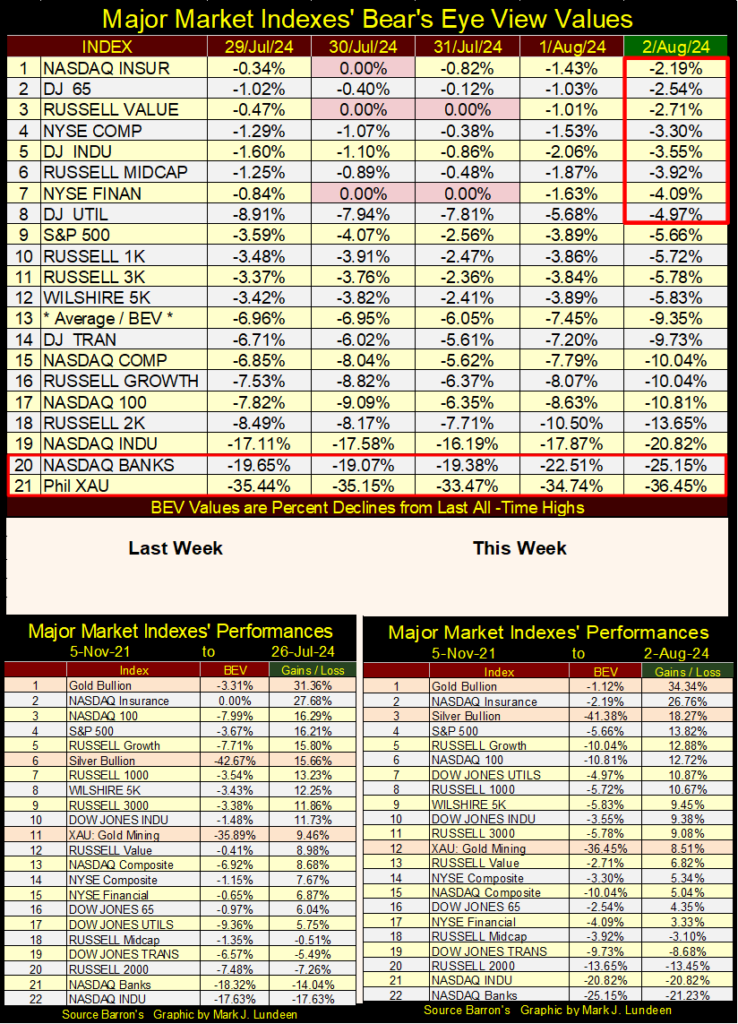
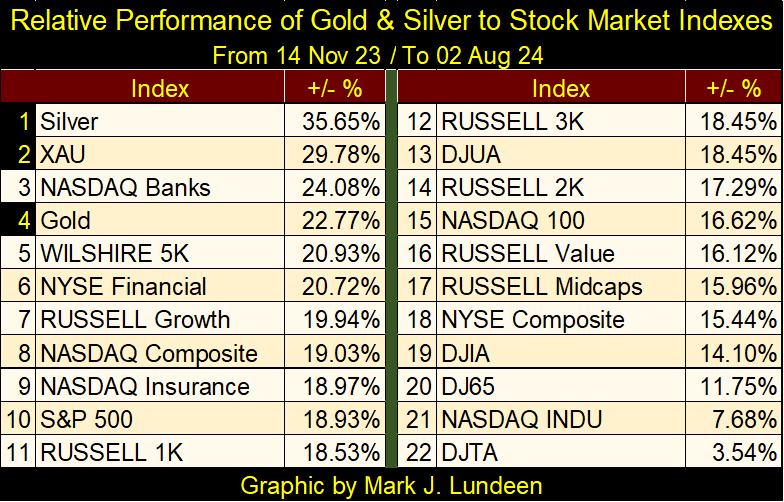
This week gold and silver were up nicely in the performance tables above, while the XAU was down slightly, but less than most of the indexes seen above. Note these performance tables are based on 05 November 2021, at the top of the Post March 2020 Flash Crash Rally, the advance made possible by Powell’s multi-trillion-dollar Not QE#4.
I was curious how these indexes have performed since gold first closed in scoring position last November, so I constructed the performance table below. For the nine months that followed, silver and the XAU are now at #1&2, with gold at #4. I know it doesn’t feel like it, but precious metal assets have been in a stealth bull market since last November.
America’s national debt increased to over $35 trillion dollars this week, as the idiots at the FOMC continue stirring their witches’ brew called “monetary policy” (see chart below). What can go wrong?
Look at this chart, as it is very informative of the situation today. Previous to 2007, before the sub-prime mortgage market melted down, “monetary policy” only required a few billion dollars every week to inflate historic bubbles in the high-tech stocks in the 1990s, or in single family housing in the 2000s.
However, beginning in 2008, things began getting out of hand when it came to matters of “policy.” Someone doesn’t have to have a Ph.D. in economics to understand, how since Bear Stearns went under in March 2008, a major Wall Street House that choked to death on its own sub-prime mortgage portfolio, something changed in monetary policy (far left red circle), as seen in the chart below.
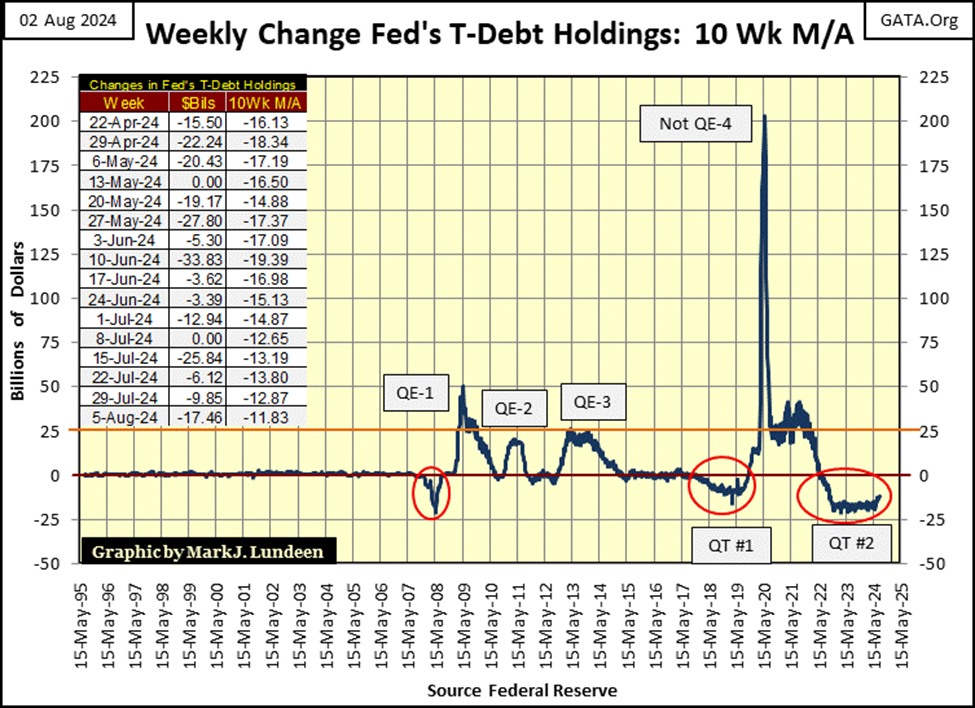
Today, the idiots continue with the QT #2, which they say they began in May of 2022, as seen in the chart above.
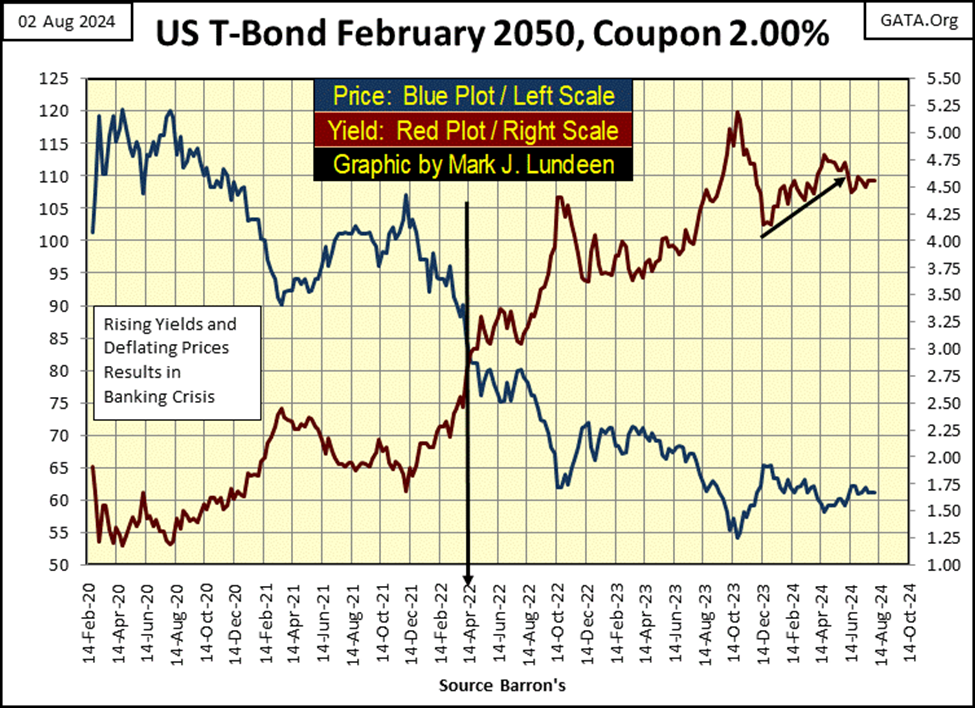
During QEs, the FOMC * BUYS * T-bonds. QEs create demand for Treasury debt, and increases in demand for anything, even T-bonds, results in * HIGHER PRICES. * With bonds, rising prices always result in declining yields.
During QTs, the FOMC * SELLS * its T-bonds. QTs create supply for Treasury debt, and with increases in supply for anything, even T-bonds, results in * LOWER PRICES. * With bonds, declining prices always results in rising yields.
So, since May 2022, the US National Debt has increased by $5 trillion dollars, as the FOMC sold $1.7 trillion additional T-bonds into the Treasury Bond Market. In the past two years, this is an increase of $7 trillion dollars of supply in the US Treasury market. An enormous source of supply, that logically should have depressed T-bond valuations, and increased T-bond yields.
But for the 30Yr T-bond below, most of the loss in valuation (Blue Plot), and increase in yields (Red Plot), happened before May 2022, not after. Something I find odd.
Also, bond yields for 2024 peaked (bond prices bottomed), in April of this year, red tabs in the table below. Except for the Muni-Bonds, these bonds’ yields for 2024 bottomed this week (green tabs), meaning bond prices have been rising since April, even as the FOMC’s QT#2 continued into its 3rd year. This is odd, something not to be expected.
This reminds me of something from my days in the Navy, when down in #2-Fire Room, the Second Stage Bilge-Amoeba Detector began howling like a banshee, as the De-airing-Feed Tank glowed in a fiendish blue light. No one ever figured out what the hell the problem was, but everyone knew whenever this happen, something was horribly wrong!
Okay, all of the above is total nautical nonsense; it never happened. But this is no more nonsense than believing the FOMC has reduced their holdings of T-bonds in their portfolio for the past two years, with their so-called QT.
It took more buying in the T-bond market, in excess to what the US Treasury and Federal Reserve were selling into it, to drive these bond yields down in the table below from last April’s highs, and I doubt it was foreigners buying them.
So, I’m thinking it must be the FOMC selling their T-bond from one of their portfolios, the one they publish every week on the internet. They then buy these same bonds back, and more for another portfolio of theirs, one that no one knows anything about, because it’s their little secret. The Federal Reserve has never been audited, so why wouldn’t they?
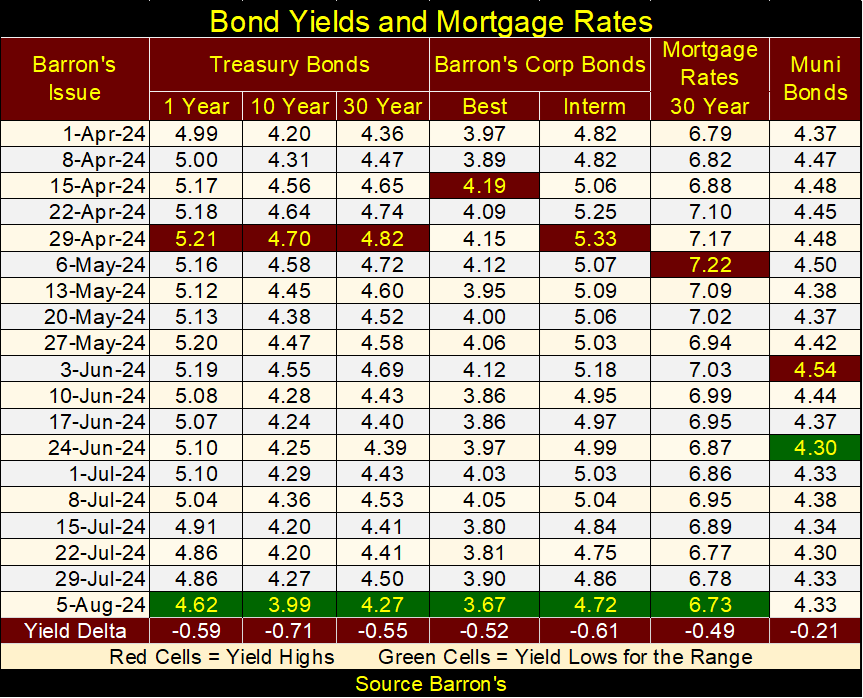
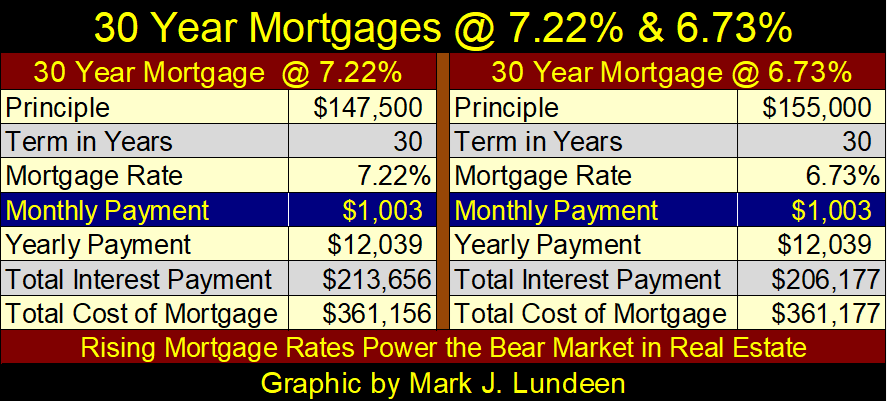
The yield changes are significant too. Looking at mortgages in the table below, since May, rates have fallen from 7.22% down to 6.73%. That change in rates in the mortgage market allowed an increase in 30Yr mortgages, whose monthly payment of $1,003, went from $147,500 to $155,000.
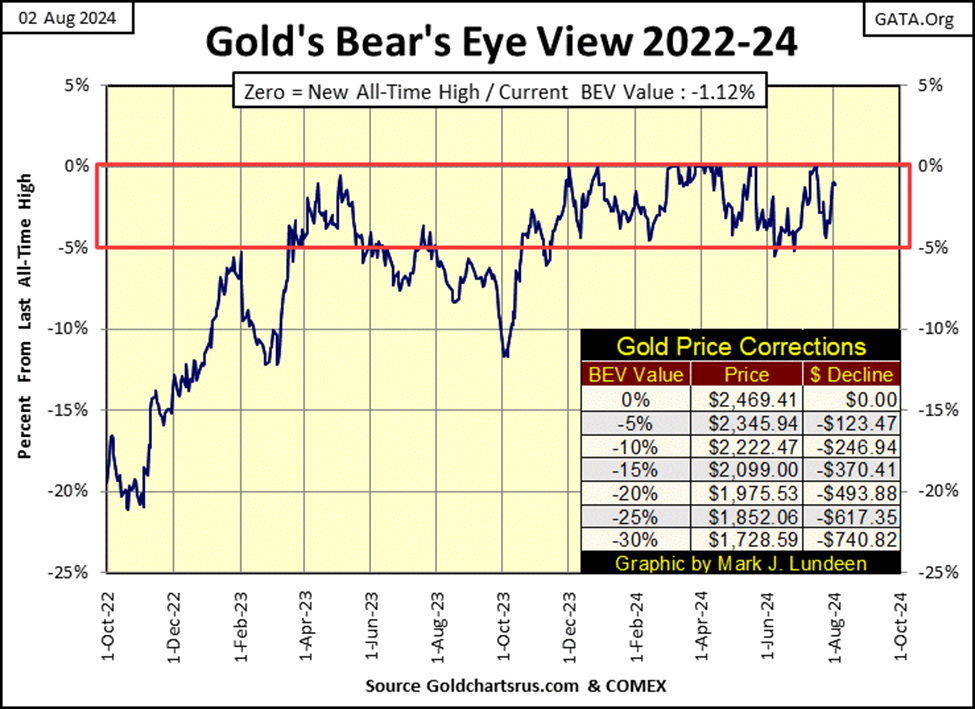
Next is gold’s BEV chart. Gold this week closed with a BEV of -1.12%. If gold wanted to, it could close at a new all-time high on Monday. That isn’t a prediction, I’m just noting how close to a new all-time high a BEV of -1.12% is; 1.13% from making one. I’m a bull on gold, so I’m thinking we’ll see one or two new BEV Zeros next week.
You may think I’m counting my chickens before they hatch, but making new all-time highs is something a market does when it is in scoring position, as gold, and the Dow Jones have since mid-November of last year. As long as gold, and the Dow Jones remains above their BEV -5% lines, in their BEV charts, we should anticipate these markets going to new all-time highs. Let’s not make this harder than it has to be.
In gold and silver’s indexed plots below, where 1.00 = 02 January 1969, gold closed the week with a factor of 56.13 ($2,441.87). After clearing 55, gold is now advancing, or should be in the weeks and months to come.
Gold at $3000 (69 in the chart below) by Christmas? That is a big advance in the next four months to come, so I’m not counting on it happening. But the world is having many problems now in August. Something getting out of control, say a war somewhere, or an unexpected economic crisis arising, and possibly gold could do better than $3000 by Christmas.
Look at the chart. Since February 2002, gold has been in a bull market. Gold has just cleared its second of two major corrections, so it should be ready to make a run toward much higher prices. So, I’m doing what I’m supposed to do; looking for reasons to hold, or even buying more.
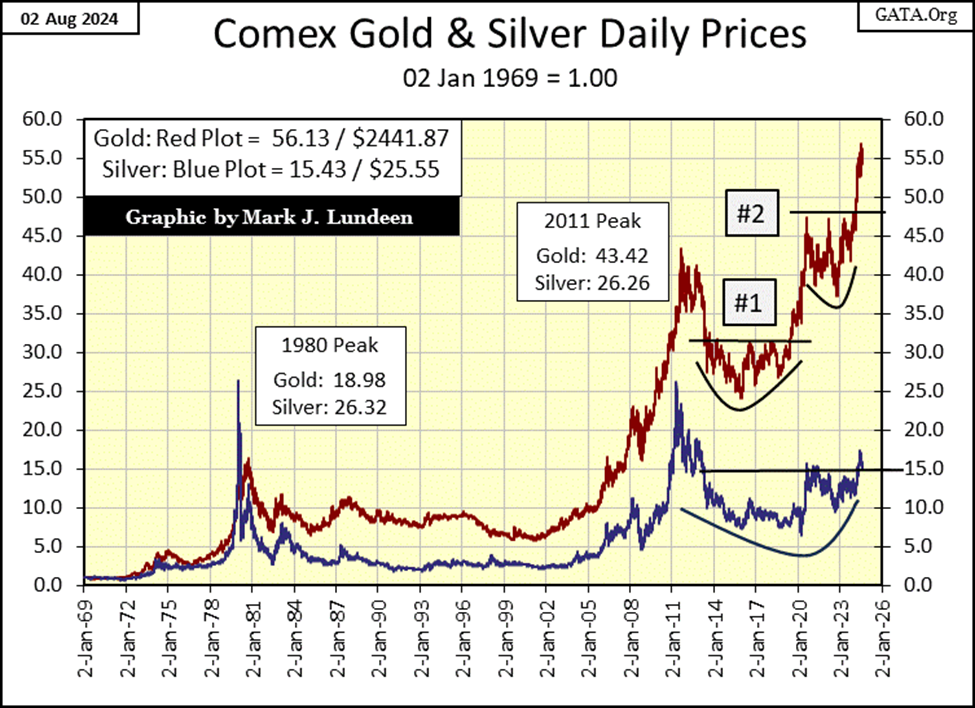
Silver above, as usual is being difficult. It cleared its 15 level on May 9th ($28) and so far, hasn’t fallen below it. But that was three months ago. For all this time, silver has done nothing to create any excitement for investors, inviting them to take a position in the silver market. I’m not surprised, as that is exactly how the goons in the COMEX silver’s futures market want the silver market’s psychology to be, to keep people from buying silver as an investment.
The COMEX goons have been doing this for a long time. But one day they will faulter, and silver will then break free. We’ll know exactly when that day comes, when silver in the chart above spikes upwards towards gold.
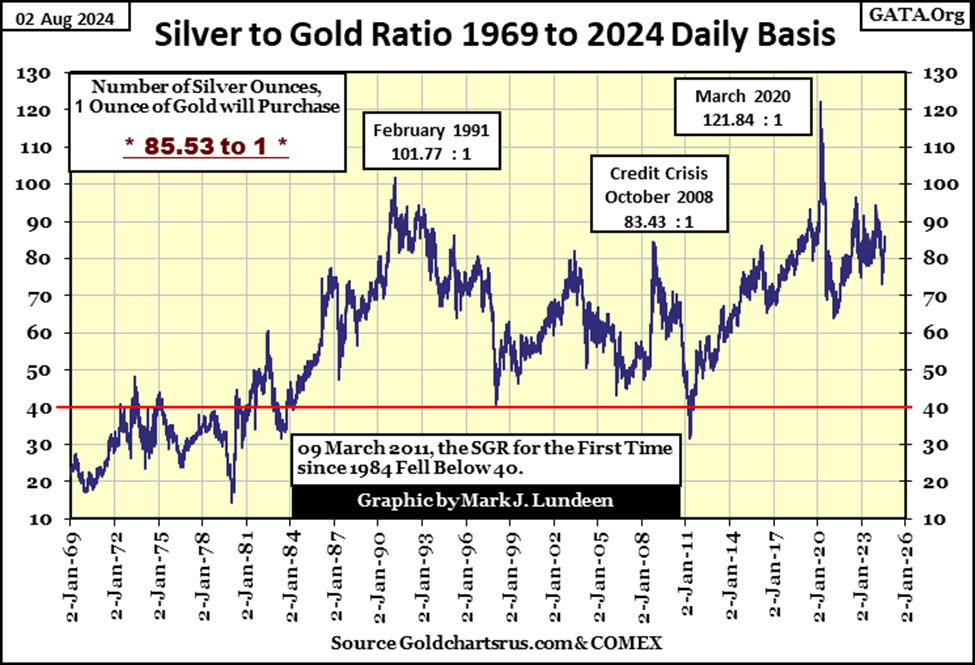
Of the two, gold and silver, I think silver is the much better bargain at today’s prices. Looking at the Silver to Gold Ratio chart below, for what an ounce of gold goes for, someone could get 85.58 ounces of silver. That is called cheap, and when one is buying, cheap is good.
Looking at gold’s step sum table below, gold is no longer overbought, not with a 15-count of +1 on Friday’s close. Gold lost only $28 in valuation, a 1.12% decline in valuation to correct this; to bring down its 15-count from a +7 to a +1. I think this is bullish, so I’m expecting good things for the gold bulls in the weeks to come.
I’m still waiting for gold to see some days of extreme volatility, days where gold moves +/-3% from its previous day’s closing price, extreme volatility that will result in gold’s daily volatility’s 200D M/A to rise above 1.00%.
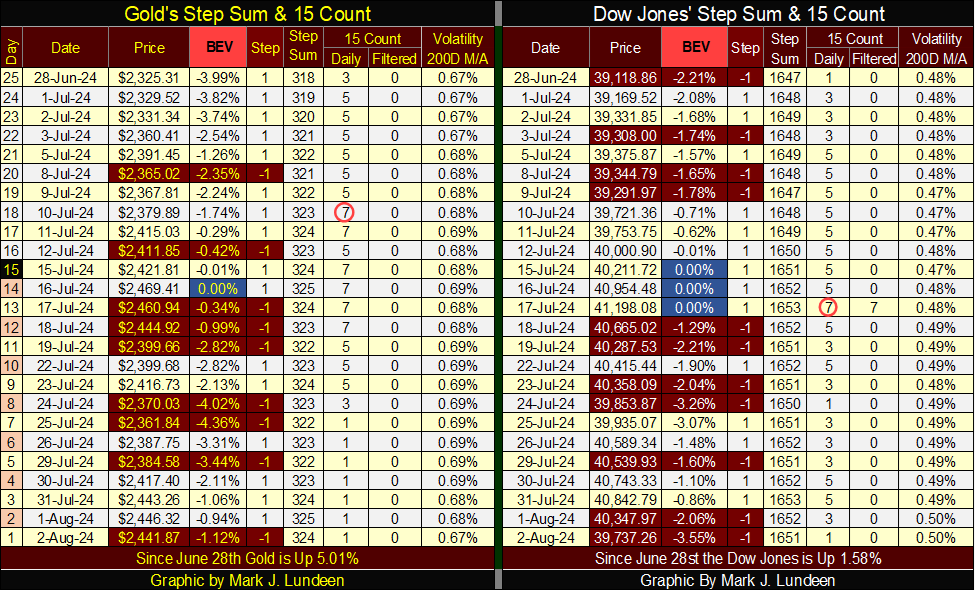
Like gold, the Dow Jones too saw its 15-count increase to an overbought +7, and closed the week with a 15-count of +1. But the Dow Jones had to shed 1,461 points, decline 3.55% to get this done. This is nothing terrible, but between gold and the Dow Jones, I think gold is better poised for future advances from here.
Daily volatility for the Dow Jones is creeping up, and unlike gold, a market that thrives in rising daily volatility, the Dow Jones never benefits from rising volatility. But the Dow Jones remains in scoring position, with a BEV of -3.55%. Until it closes below its BEV -5% line, I’m going to remain bullish on the stock market as a whole. What I’m watching for in the near-term future is; if the Dow Jones begin seeing its dreaded Dow Jones 2% days, Mr Bear’s calling card of bad things to come on Wall Street.
Before the pending bear market sees it ultimate bottom, I believe it will compete with the bear-market decline of the Great Depression; an 89% bear market bottom. I don’t see how it couldn’t, the financial system, governments, corporation, and individuals in 2024, are all servicing more debt than reasonable people decades ago would believe is possible.
The table below illustrates what a 90% decline in the Dow Jones would look like. Pay close attention to its Early Reeentry Penalty column. For example, should someone reenter the market when the Dow Jones was down by 50%, and held on until the 90% market bottom, they would lose 80% of their invested funds. Buying when the Dow Jones was down by 80%, and investors would lose 50% of their invested funds, if they held on to the 90% bottom.
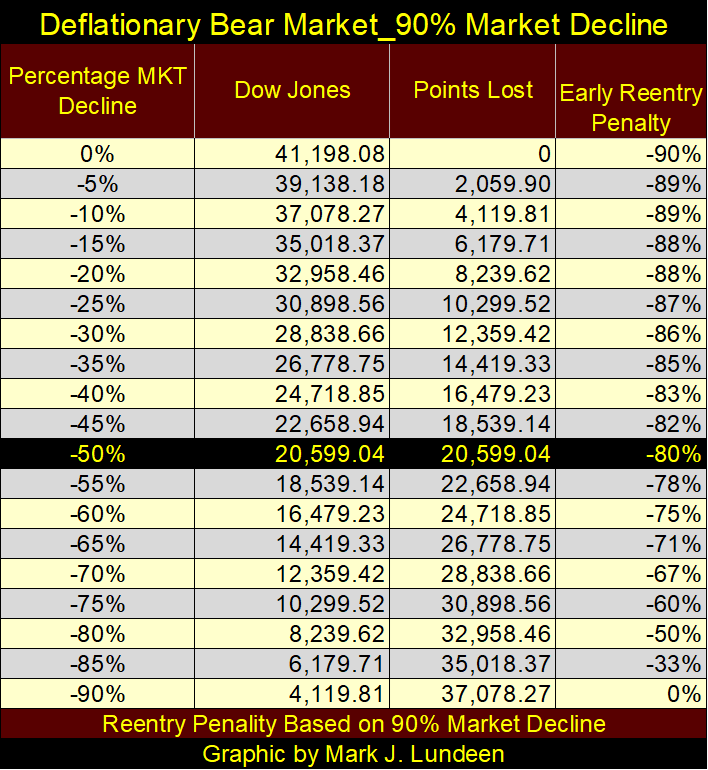
No doubt about it; the mathematics for a massive deflationary-bear market, as seen in the depressing 1930s, and what I’m anticipating we’ll also see in our not to distance future, is grizzly.
__
(Featured image by Lo Lo via Unsplash)
DISCLAIMER: This article was written by a third party contributor and does not reflect the opinion of Born2Invest, its management, staff or its associates. Please review our disclaimer for more information.
This article may include forward-looking statements. These forward-looking statements generally are identified by the words “believe,” “project,” “estimate,” “become,” “plan,” “will,” and similar expressions, including with regards to potential earnings in the Empire Flippers affiliate program. These forward-looking statements involve known and unknown risks as well as uncertainties, including those discussed in the following cautionary statements and elsewhere in this article and on this site. Although the Company may believe that its expectations are based on reasonable assumptions, the actual results that the Company may achieve may differ materially from any forward-looking statements, which reflect the opinions of the management of the Company only as of the date hereof. Additionally, please make sure to read these important disclosures.


Blockchain Adoption Accelerates as SwissChain and Amundi Launch Tokenized Financial Solutions
SwissChain Holding SA has digitized its share certificates using blockchain, improving transparency, efficiency, and ownership tracking while maintaining Swiss legal...


Cocoa Markets Steady as Weak Demand and Rising Supply Signal Potential Surplus
New York and London markets higher range trading, with mixed short term trends. Strong West African harvests and favorable rains...


Global Markets on Edge as Iran Conflict, Inflation Pressures, and Financial Risks Intensify
Iran conflict threatens economy disruptions beyond energy to agriculture and goods. Rising PPI signals persistent inflation, risking stagflation reminiscent of...

The Iran War Tests Bitcoin and Crypto Market Resilience
The Iran war has driven oil prices higher and disrupted crypto markets. Bitcoin rose despite volatility, while mining activity declined....


Italy’s Pharmaceutical Sector Drives Innovation, Sustainability, and European Leadership
Italy’s pharmaceutical sector invests €4 billion annually, including €2.3 billion in R&D and €1.7 billion in industrial technologies, up 21%...
 |
|
 |  |
 |
|
-

 Markets2 weeks ago
Stagflation Fears Rise as Energy Shock and Iran Conflict Shake Markets
-

 Biotech1 week ago
AI Boosts Cancer Detection While Cutting Radiologists’ Workload
-

 Africa2 weeks ago
African Bank Appoints Manyathi as Interim CEO After Bungane’s Departure
-

 Crowdfunding5 days ago
Peru’s Crowdfunding Sector Shrinks Amid License Revocation