Featured
Stock market on upward trajectory thanks to low interest rates, debt growth
Another factor in the upsurge of the stock market is the high expectations of reforms from the Trump government.
The U.S. stock market is strengthening with the help of low-interest rates and even the anticipation surrounding the Trump government’s reforms, which can give the stock market a substantial boost.
Weekly Update
For those who may remember, October 19 was the 30th anniversary of Black Monday, the 1987 stock market crash—the day when stock markets around the world crashed in unison. The crash got underway in Hong Kong and then spread to Europe before hitting North American markets. The Dow Jones Industrials (DJI) fell 508 points that day, a decline of 22.6%. As dramatic as it was, most people probably forget the run-up that preceded the crash. The run-up got underway with a low on 12 September 1986, at 1,733.55 and didn’t top until 347 days later on 25 August 1987 at 2,746.64 for a gain of 58%.
Sounds impressive? Well, yes and no. One might call it a blow-off before the crash, but it certainly wasn’t the most spectacular blow-off seen over the past century. That honor lies with gold that started a rally on 16 November 1978, at $195.80 and barely paused for the next 431 days topping on 21 January 1980 at $875 for a gain of 347%.
Back on June 23, 2017, we wrote an essay titled “Blow-off Top: Could it Happen?” The DJI average that day stood at 21,395. Since then the DJI has gained almost 9% in 119 days. Decent, but hardly the stuff of blow-offs. For a better perspective, it might be better to go back to the low seen on Election Day 2016 at 17,884. Since then the DJI has seen only shallow pauses as it climbs higher. The gain since Election Day is about 30% in 350 days. Again decent, but not the stuff of legendary blow-offs.
The Grand Daddy of blow-offs was probably the final run-up in the “Roaring Twenties.” The DJI gained 165% in 1050 days from an important low on (ironically) 19 October 1926 to its top on 3 September 1929. The dot.com blow-off for the NASDAQ at the end of the 1990s might rank as the fastest ascent. The NASDAQ made a key low on 18 October 1999, and then topped 144 days later on 10 March 2000, for a gain of 95%.
Three other blow-offs are worth mentioning. First was the Tokyo Nikkei Dow (TKN) rise from an important low on 28 December 1987, to its top on 3 January 1990, 737 days later for a gain of 80%. Even more interesting was WTI oil that started from a low of $50.55 on 16 January 2007 and topped 542 days later at $147.27 for a gain of 191%. Gold also had what many consider another blow-off. Starting from the depths of the 2008 financial crash, gold rose 182% from 24 October 2008, to its top on September 6, 2011, a period of 1,047 days.
If the current market is truly in a blow-off, the DJI has further to rise. The average gain of the aforementioned blow-offs was 176% over a period on average of 658 days. That suggests this market could have further to rise and last into the first quarter of 2018. But keep in mind none of the above markets ended well. The “Roaring Twenties” market topped in 1929 and three years later, it was down 89%. It took until 1954 before the DJI finally surpassed the 1929-high. Gold topped in January 1980 and by 1985 had collapsed 65%. Gold did not make its final bottom until 2001 and was down from the January 1980 high 71%. Gold finally surpassed the 1980 high in 2007.
Following the dot.com/high tech boom of the 1990s, the NASDAQ lost 78% in the 2000–2002 collapse. The NASDAQ finally surpassed the 2000 high in 2015. The TKN has never recovered and remains down some 46% from the 1990-high. WTI oil has also never seen the heights of 2008 again, either. Oil today is down 65% from those highs. The 2008–2011 gold bull collapsed in 2013 and at one point, it was down about 46%. Gold is still down roughly 33% from the 2011-high. Yet gold has been one of the best-performing assets of the 21st century with a gain of about 342% since 1 January 2000, vs. a gain of 103% for the DJI in the same period. The lesson appears to be that what goes up in a vertical fashion can fall even harder and remain down longer than everyone expects.
Today’s stock market has been driven higher by historically low-interest rates, good corporate earnings, high expectations of reforms from the Trump administration that would benefit the stock market, and unprecedented debt growth. Following the financial collapse of 2007–2009 central banks turned on the spigots in an unprecedented wave of quantitative easing (QE) that poured billions into the financial system. Evidence suggests more of the funds found their way into “Wall Street” rather than “Main Street.” It worked as the DJI is up 259% from the March 2009 low. The DJI surpassed the October 2007 high in 2013 and is up 64% from that high. The recent leap to new highs has been spurred by the expectation of Congress and the Senate passing tax reform. This past week the Senate passed Trump’s budget resolution, which clears the path to pass tax reform.
The stock market has also benefitted from reforms put in place after the 1987 stock market crash. No, the reforms cannot prevent bear markets but they can mitigate crashes. The SEC put in place circuit breakers that stop trading when the market falls by a certain percentage. The federal government can also intervene in the market to keep it from collapsing. The Working Group on Financial Markets (WGFM) was formed after the 1987 stock market crash. The WGFM is affectionately known as the “Plunge Protection Team.” The US government is essentially a “put” on the market.
While many analysts are screaming the stock market is overvalued and it is in a bubble, many economists expect the current rise to continue. The risks are clearly known. While interest rates are rising, the increases are primarily in the US with possibly some further ones due in Canada as well. Hiking interest rates too fast could result in a negative yield curve and subsequently spark a recession along with a bear market. But interest rates have already been lower than expected for far too long which has helped spur the stock markets. So far, the Fed’s interest rate hikes have been measured, targeted, and forewarned. This has allowed the markets to adapt, as they know what to expect. The appointment of a new Fed Chair to replace Janet Yellen will be greeted positively if whoever is appointed continues the same measured approach.
Other risks are political, including the uncertainty being created by the Brexit and the ongoing separation fight between Spain and Catalonia. As well, the EU, particularly in Germany and Austria, has seen the rise of far-right parties that could eventually prove to be destabilizing. Despite all the political hand-wringing over the Trump administration and Trump’s erraticism and controversy, the agenda has been generally positive for stock markets. The one real risk is the potential cancellation of NAFTA that could create considerable uncertainty and trade wars. Trade wars are not positive and could be economically disruptive for Canada, the US, Mexico, and the world, as this would be a lose-lose-lose-lose situation.
Other political risks include the rhetoric and threat of war with North Korea and now possibly Iran too. As well, the US continues to play cat-and-mouse war games and rhetoric with Russia and China. The risk with all of this is an accident that turns the rhetoric into a real shooting war. That, in turn, could spark a stock market panic.
While the stock markets are historically overvalued according to the Case-Shiller P/E ratio, they can remain that way for some time given the continuation of historically low-interest rates, continued global economic growth—tepid as it may be—and continued earnings growth. Warning signs abound. But that doesn’t necessarily translate into a recession and stock market bear market. One of the biggest warning signs has been the unprecedented debt growth since the 2007–2009 recession and the financial collapse of 2008.
Debt growth of upwards of $100 trillion in a mere nine years is not necessarily healthy in the long term, even if it has resulted in keeping economies afloat and benefitted global stock markets. An unexpected debt collapse somewhere could be a trigger that once again threatens the global financial system. We saw previously how debt collapses triggered panics and bailouts in 1998, the collapse of the dot.com/high tech market in 2000–2002, and the financial collapse triggered by the collapse of the housing market and related debt in 2007.
One potential trigger that is rarely discussed is the potential for currency wars. Currency wars would be a by-product of trade wars as countries try to gain a competitive advantage relative to each other. Countries would set out to devalue their currency to gain some trade advantage vs. others. We have already seen that play out numerous times. The US’s constant threatening of trade retaliation, accusations of currency manipulation, and the current threat to tear up NAFTA are all a part of this dangerous game. While currency wars between Canada and the US would not be too earth-shattering for the world, currency wars between China and the US would have potentially global consequences.
They always say “this time it’s different.” In the end, the only thing that might well be different is what sparks the next collapse.
© David Chapman
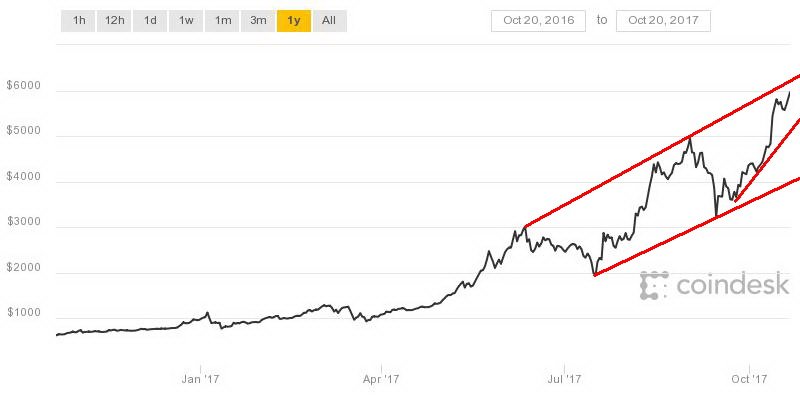
Bitcoin continues to climb and it is now approaching $6,000. Bitcoin is up about 500% so far in 2017. Bitcoin is rapidly approaching the top of the bull channel so that zone, currently just over $6,000, may act as resistance. Bitcoin did trade briefly over $6,000 on Friday. Given the bull channel, Bitcoin could well just continue to rise within the context of that channel. The steep rise since lows seen back on 21 September 2017, near $3,600 could prove to be the formation of an ascending wedge triangle pattern. Bears watching. Current support on any downside move is near $4,500.
Bitcoin continues to rise. It wavered earlier in the week on news that the CFTC was looking into regulation of Bitcoin. While regulation of Bitcoin and other cryptocurrencies per se would not be a death knell it would throw a wrench into something that was to be outside the financial system. And therein continues to lie a problem. As we have noted, governments, central banks, and here in Canada FINTRAC have considerable interest in Bitcoin and other cryptocurrencies because they trade outside their realm of control and oversight. In the US, besides the CFTC, the Fed and the SEC are looking at Bitcoin and cryptocurrencies. The SEC has already charged some ICOs with fraud.
But all the talk of regulation seems moot when Bitcoin and other cryptocurrencies recover quickly and move to new highs.
The entire cryptocurrency market is small, but as it gets bigger and there are more participants, the financial regulators will increasingly have interest and a desire for control. News of the issuance of cryptocurrencies in Rubles in Russia is somewhat bogus as it comes with a high degree of control from the Russian central bank.
Another problem with Bitcoin and other cryptocurrencies is—how do you value them? Research studies have already concluded that their true value is impossible to assess. And there are far too many of them with an estimated upwards of 1,500 and growing. New Initial Coin Offerings (ICOs) are almost a daily occurrence. With so many, how is one to know which one to pick and how does one know which ones might be successful and which ones will go bust? Most will go bust. There is also an increased risk of frauds and scams. It seems to come with the territory. Yet money continues to flow into these ICOs. The market is like the “wild west.” Get rich quick schemes abound.
Markets and Trends
|
|
Percentage Gains Trends
|
|||||||
| Stock Market Indices | Close
Dec 31/16 |
Close
Oct 20/17 |
Week | YTD | Daily (Short Term) | Weekly (Intermediate) | Monthly (Long Term) | |
| S&P 500 | 2,238.83 | 2,575.21 (new highs) | 0.9 | 15.0 | up | up | up (topping) | |
| Dow Jones Industrials | 19,762.60 | 23,328.63 (new highs) | 2.0 | 18.0
|
up | up | up (topping) | |
| Dow Jones Transports | 9,043.90 | 9,972.10 | 0.4 | 10.3 | up | up | up (topping) | |
| NASDAQ | 5,383.12 | 6,629.05 (new highs) | 0.4 | 23.2 | up | up | up (topping) | |
| S&P/TSX Composite | 15,287.59 | 15,857.22 | 0.3 | 3.7 | up | up | up | |
| S&P/TSX Venture (CDNX) | 762.37 | 789.51 | (1.0) | 3.6 | up | neutral | up (weak) | |
| Russell 2000 | 1,357.14 | 1,509.25 | 0.4 | 11.2 | up | up | up (topping) | |
| MSCI World Index | 1,690.93 | 1,993.11 (new highs) | (0.3) | 17.9 | up | up | up | |
| Gold Mining Stock Indices | ||||||||
| Gold Bugs Index (HUI) | 182.31 | 197.53 | (2.6) | 8.4 | down | neutral | up (weak) | |
| TSX Gold Index (TGD) | 194.35 | 198.52 | (2.1) | 2.2 | down | down | up (weak) | |
| Fixed Income Yields | ||||||||
| U.S. 10-Year Treasury yield | 2.45 | 2.37
|
4.8 | (2.5) | ||||
| Cdn. 10-Year Bond yield | 1.72 | 2.02 | (2.9) | 17.4 | ||||
| Currencies | ||||||||
| US$ Index | 102.28 | 93.58 | 0.8 | (8.5) | up | down | down (weak) | |
| Canadian $ | 0.7440 | 0.7920 | (1.3) | 6.5 | down | up | neutral | |
| Euro | 105.22 | 117.78 | (0.4) | 11.9 | down | up | up | |
| British Pound | 123.21 | 131.88 | (0.8) | 7.0 | neutral | up | down | |
| Japanese Yen | 85.57 | 88.13 | (1.4)
|
3.0 | down | down | neutral | |
| Precious Metals | ||||||||
| Gold | 1,151.70 | 1,280.50 | (1.9) | 11.2 | down | up | up | |
| Silver | 15.99 | 17.08 | (1.9) | 6.8 | down (weak) | neutral | neutral | |
| Platinum | 905.70 | 926.80 | (2.2) | 2.3
|
down | down | down | |
| Base Metals | ||||||||
| Palladium | 683.25 | 969.85 | (1.6)
|
42.0 | up | up | up | |
| Copper | 2.5055 | 3.17 | 1.3 | 26.5 | up | up | up | |
| Energy | ||||||||
| WTI Oil | 53.72 | 51.84 | 0.8 | (3.5) | up | up | neutral | |
| Natural Gas | 3.72 | 2.91 | (3.0) | (21.8) | down | down | neutral | |
© David Chapman
Note: For an explanation of the trends, see the glossary at the end of this article.
New highs/lows refer to new 52-week highs/lows.
© David Chapman
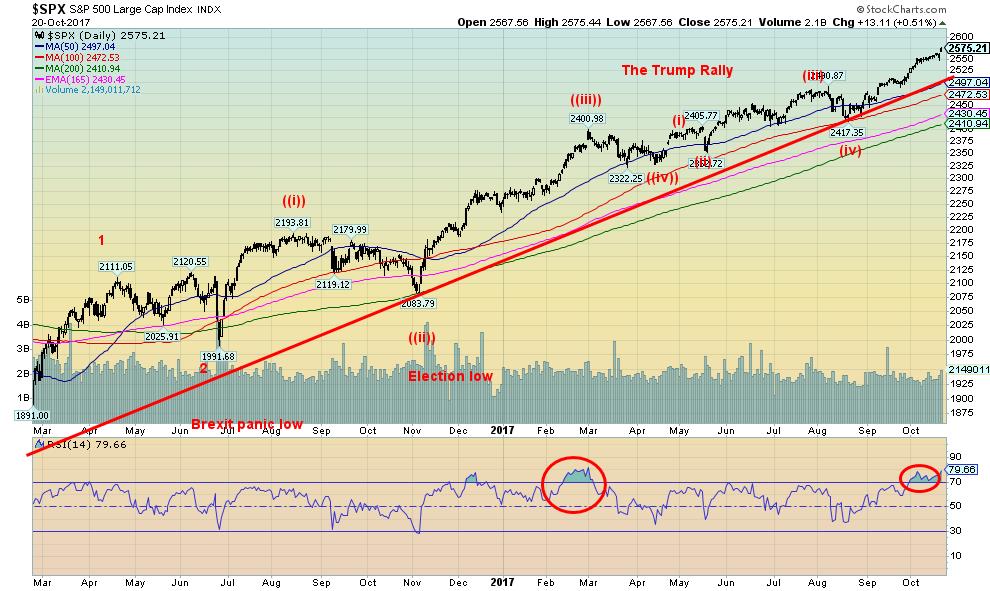
The passage of the “budget resolution” helped push the markets to yet another all-time high. Both the S&P 500 and the Dow Jones Industrials (DJI) surged to new highs, as did the NASDAQ, but the Dow Jones Transportations (DJT) did not. With the failure of the DJT to confirm the DJI, it set up the potential for another divergence between the two prime Dow indices. The passage of the “budget resolution” cleared the way for tax reform. One of the key issues was tax reform was going to need the two-thirds majority to pass (60 votes). Now, with the passage of the “budget resolution,” it will need only to pass, meaning 51 votes.
The passage of the “budget resolution” is not the 2018 budget. The 2018 budget year is now underway. The deficit for 2017 was some $666 billion higher than expected despite Trump saying it would fall. The differences for passage of the budget are monumental. Trump’s border wall, Planned Parenthood, Obamacare insurance bailouts, sanctuary cities, and “Dreamers” are a few of the major issues that need to be determined in the budget talks. And there is no middle ground on these issues with the Democrats, meaning the Republicans cannot afford to have any defectors.
The deadline date is December 8, just 50 days away. That is the day the congressional authority to keep the government running expires. With that, you are going to need 60 votes so without Democrats it is potentially going to fail. The budget is also indicating there could be deficits totaling $1.5 trillion over the next decade. With last year’s (2017) deficit at $666 billion and rising that is not going to sit well with many. December is shaping up to be a potentially explosive month. Note long-term interest rates were rising again this week as a result of all the machinations this past week. December could be a month of reckoning for the stock market.
The RSI indicator is showing a very overbought market as it has been almost consistently above 70 since September. That can go on for a while, but eventually, it is a signal the market could be poised for a fall. Maybe it will be shallow but then again maybe it won’t. A break under 2,550 would be a short-term sell signal only. The key breakdown zone could well be under 2,500. The major breakdown zone would not occur until the S&P 500 broke under 2,400. In the interim, it is onward and upward. Short-term targets appear to be 2,600, but a firm break-through that level could target as high as 2,660 next.
We should mention that this was the sixth straight week the markets have closed at new all-time highs. Also, it has been indicated that the number of new highs this year are now on par with the number of new all-time highs seen back in 1999. We all know how that market ended although it did not end officially until March 2000. As we indicated in our opening essay, this market could well go into the New Year before finding its final top.
© David Chapman
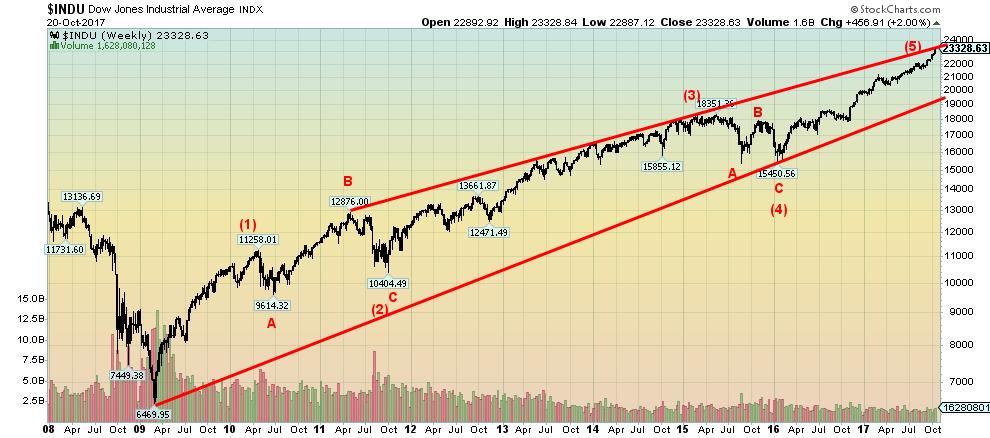
Here is the big picture. The Dow Jones Industrials (DJI) since the major low of March 2009. The chart shows four complete waves to the upside. The wave 2 correction was the EU/Greek credit crisis of 2011 while the wave 4 correction was the end of QE in 2015. Wave 4 ended in February 2016. We appear now to be at or very near the top of the upper boundary channel. So that area might act as resistance. However, as one can see, wave 3 consistently hit the top of the bull channel, but instead of breaking down it just kept on rising between shallow pullbacks. On the other hand, the current market appears to be just going straight up barely pausing.
© David Chapman
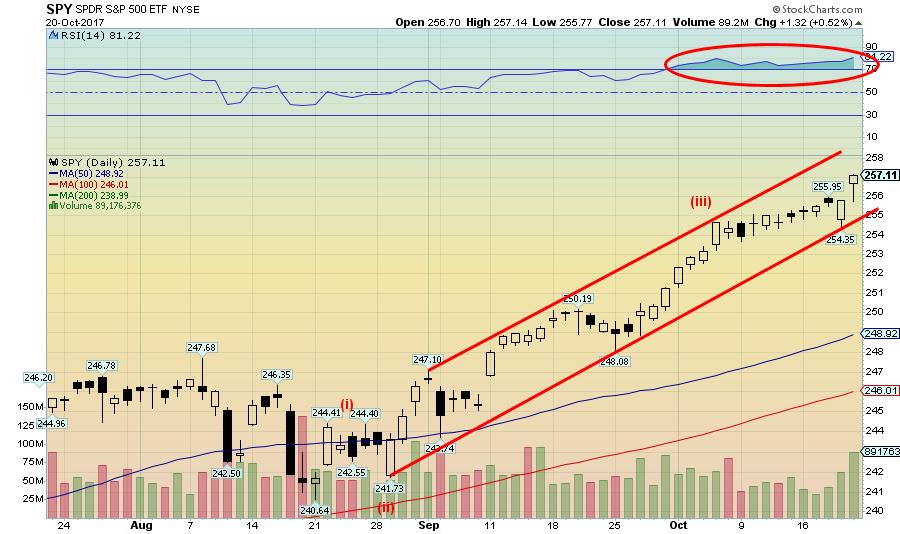
Here is the SPDR S&P 500 ETF (SPY-NYSE) over the past couple of months. It is tricky trying to discern the wave count here as what appeared to be the end of wave 3 (labeled (iii)) is merely a pause. So maybe wave 3 is not as yet complete. That suggests wave 4 and 5 are still to come. The SPY left an interesting hammer pattern on the chart on Friday. That might signal a top but we really won’t know until this coming week unfolds. Right now is onward and upward.
© David Chapman
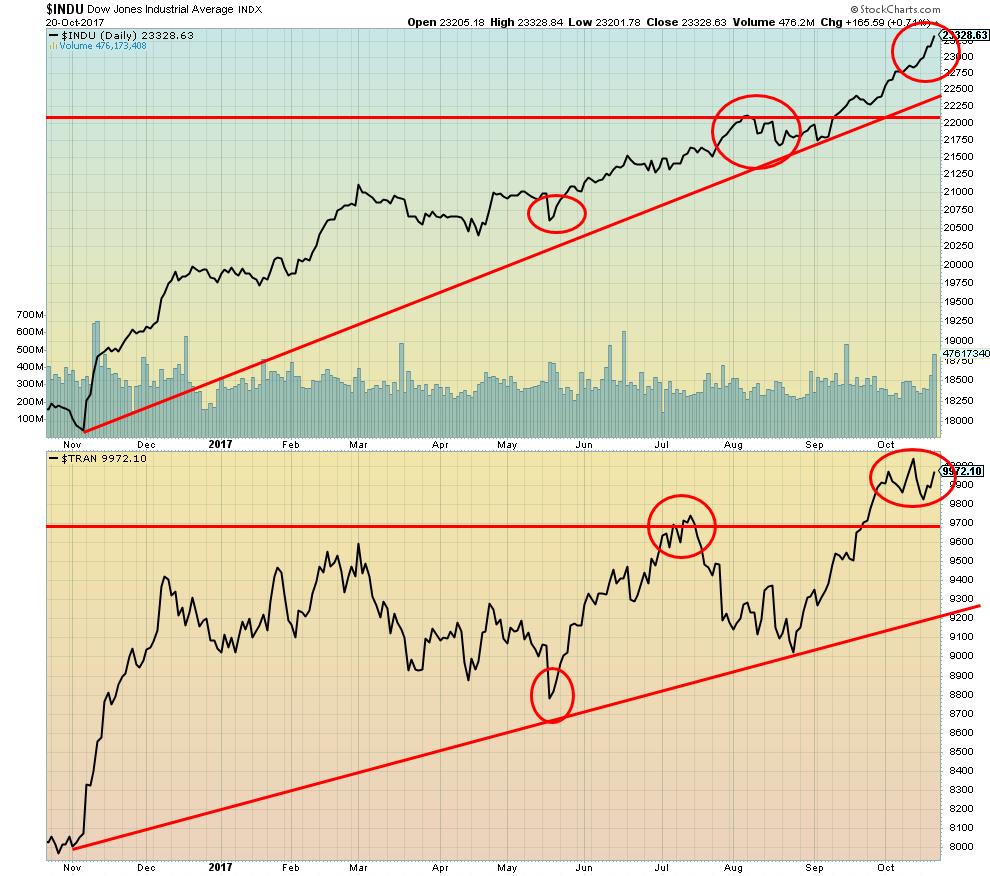
The DJI and the DJT are diverging once again. The DJI made another new all-time high on Friday but the DJT did not. This is what is known as a non-confirmation. It may well be the DJT confirms the DJI new highs this week. But if things turn down and the DJI breaks under 23,000 while the DJT breaks under 9,800 we may have a confirmation of the non-confirmation. Notice the steep rise of the DJI vs. the gentler rise of the DJT. The DJT may also be forming a small head-and-shoulders top pattern. A break of 9,800 would suggest a breakdown to at least 9,600 for the DJT.
© David Chapman
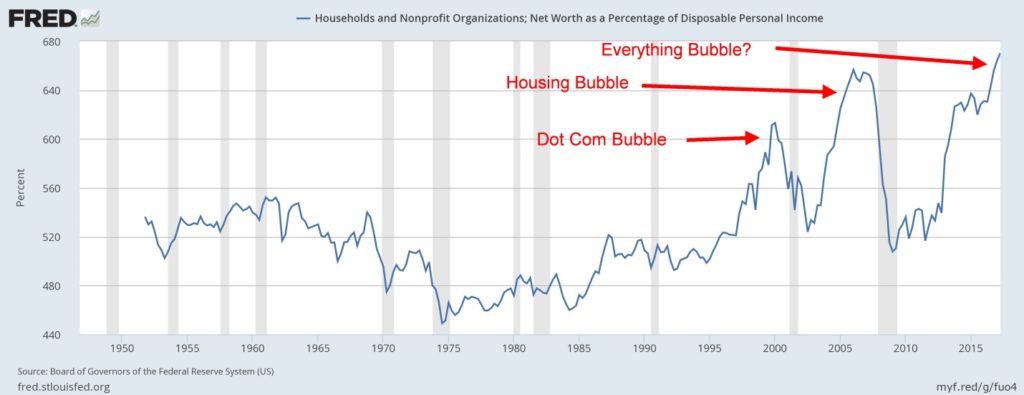
We saw this chart in a huge presentation of Incrementum AG titled Chartbook “In Gold We Trust 2017.” The chart was found at the Federal Reserve Bank of St. Louis`s website. We found it intriguing enough to present here as well. It is amazing how the ratio of households’ and non-profit organizations’ net worth as a percentage of disposable personal income soared during the dot.com bubble, the housing bubble, and now what some are calling the everything bubble.
Each sharp rise in the ratio was followed by a crash. Is this time different? Probably not. Note the tight trading range throughout the 1950s and 1960s. That was followed by the decade-long decline throughout the 1970s and into the mid-1980s. The ratio took off during the 1990s during the dot.com boom. While the bounce-backs have been impressive the crash that followed was not pretty.
© David Chapman
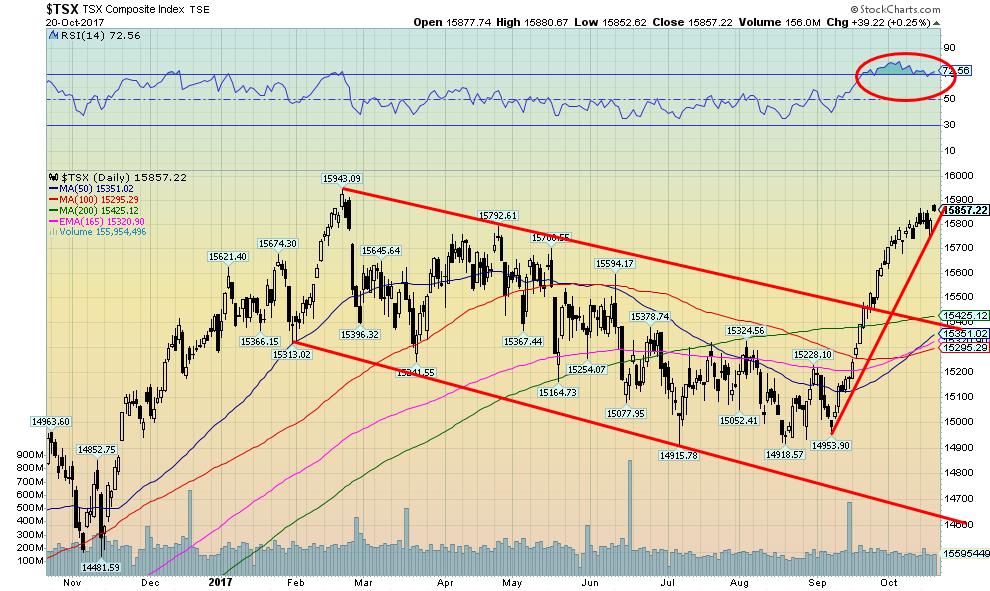
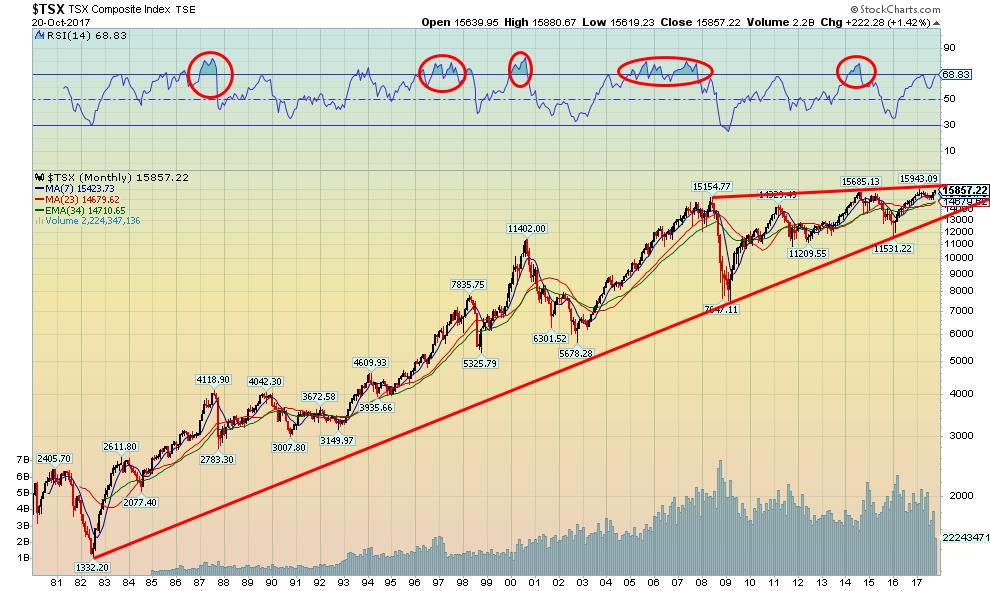
The TSX Composite is just shy of its all-time high of 15,943 set back on February 21, 2017. Odds are good the TSX should take out that high this coming week. Ultimate targets appear to be up at 16,480. But if the US markets falter usually the TSX falters as well. But the TSX is dominated by materials and energy. They tend to be countertrend banks, industrials, and consumers that one would normally associate with an ongoing rally. Still, the rise has been steep and the RSI has been registering over 70 since around September 21, 2017. Overbought levels don’t remain around forever.
© David Chapman
We thought it would be interesting to show a very long-term chart of the TSX Composite. This chart dates from 1980. A trend line drawn from the major low in 1982 at 1,332 connects with the 2008 financial crash low at 7,647 then nicely catches the January 2016 low at 11,531. The major uptrend line now comes in around 13,000. What is interesting are two things.
First, the monthly RSI reached over 70 at the July 2014 top just as it had back in 1987 before the 1987 stock market crash and from February 2005 to October 2007 during the great run-up before the 2008 financial crash. The RSI is returning towards 70 once again while the TSX makes higher highs. The RSI staying over 70 from 2005 to 2007 is a prime example of a market that can actually go higher and last longer than most people realize is possible.
Secondly, when one connects the high of 2007 with the high of 2014 the line comes in just above current levels. The pattern that appears to be forming is a huge ascending wedge. The pattern is bearish. A solid break of the uptrend line currently near 13,000 could imply a decline back to the 2008 financial crash lows. Resistance appears to be quite strong above. Something to keep in mind going forward. What could change it? A solid break above the February 2017 high could persuade us that the bull is quite powerful.
© David Chapman
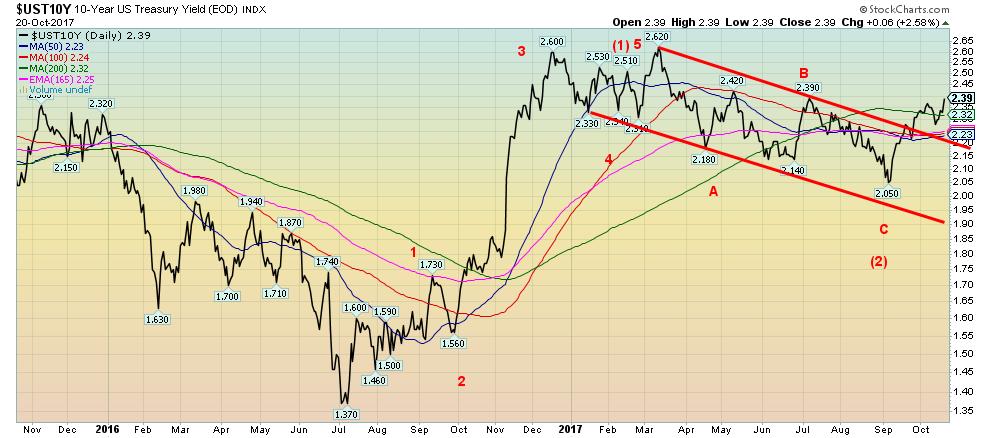
US 10-year Treasury note yields rose this past week to 2.39% up from 2.28% the previous week. The spark may have been the realization that the proposed budget could create deficits of $1.5 trillion over the next decade. The deficits are to pay for the Trump tax cuts. As we noted earlier the deficit for fiscal 2017 was $666 billion. Already the deficit for 2018 is likely to rise to at least $700 billion, possibly more. It wouldn’t be surprising to see deficits of upwards of $1 trillion again and that is without a financial crisis comparable to 2008. It was surprising to see that the Canadian Government 10-year bond (CGBs) actually fell this past week to 2.02% from 2.08%. If rates are rising in the US then the likelihood of rates falling in Canada is probably low.
But another reason rates may have jumped this past week is that Stanford University professor of economics John Taylor has suddenly jumped to the forefront as a possible replacement for Fed Chair Janet Yellen. Taylor would be a controversial choice given his frequent criticisms of the Fed since the financial crisis of 2008. He was a firm believer that QE should not have been brought in and also believes interest rates should be much higher than they are currently. Taylor is known for his development of a formula for interest rates and that current rates should be closer to his formula. Currently, the Fed rate is 1–1.25%. According to the Taylor formula, they should up around 3.75%.
Taylor has been a vocal critic of the Fed, a group that is known for its consensus-building and collegiality. Taylor has been known to oppose pretty well all of the Fed’s moves over the past number of years. His views align more closely with Republicans who have been calling for the overhaul and control of the Fed. Appointing Taylor would be a break from appointing Fed Chairs from within. But it would be in keeping with Trump’s appointments of outsiders who look to overturn everything their predecessors did. Think Pruitt at the EPA and Trump himself. The appointment of Taylor could prove to be disruptive as a result and create market uncertainty. The bond market reacts accordingly. A sudden sharp jump in bond yields could spark a panic and collapses.
We continue to see longer rates rising and we are targeting at least 3% for the 10-year Treasury note.
© David Chapman
Spread watch
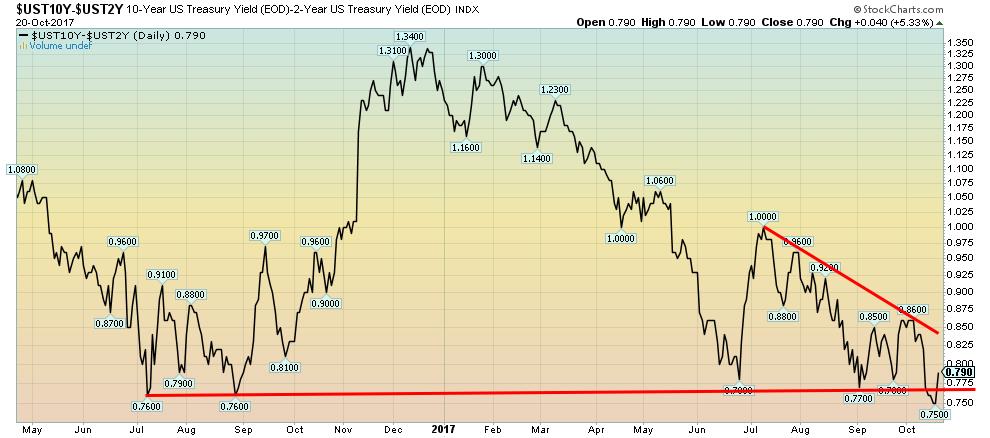
After breaking under long-term support at 0.76% to 0.77%, the 2–10 spread rebounded sharply back up to close the week at 0.79%, up from 0.77% the previous week. If John Taylor were to become Fed Chair as we note under our bond comment then he might hike interest rates faster and higher then what might be the case under Janet Yellen. Naturally, Taylor needs to persuade his fellow Fed board governors that this is the right policy. Since Trump is replacing almost all seven Fed governors the ability to pursue a more aggressive policy could become a fait accompli. That could, in turn, send the 2–10 spread plummeting and eventually trigger a Fed-induced recession.
© David Chapman
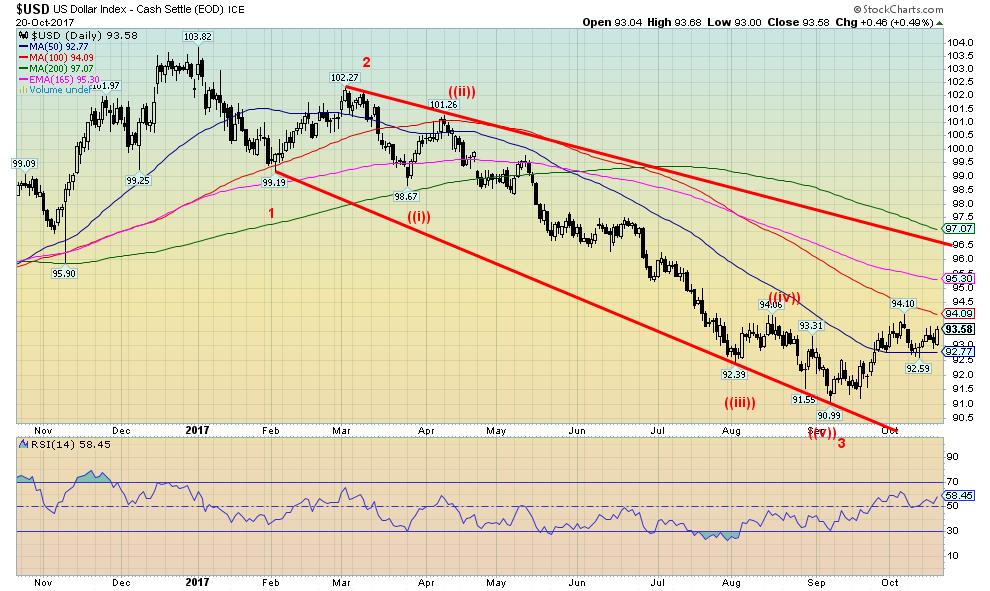
With thoughts of $1.5 trillion deficits, higher interest rates, and the potential appointment of interest rate hawk John Taylor the US$ Index rebounded this past week closing up 0.7%. Other currencies suffered as a result with the Euro down 0.4%, the Pound off 0.8%, the Japanese Yen down 1.4%, and the Cdn$ slipping almost 1.3%. This continues our thoughts that the US$ Index is in a corrective mode following the long decline from the January 2017 of 103.82.
The US$ Index remains down 8.5% in 2017. We view this rebound strictly as a corrective to the long decline. Potential targets could be 95.30 and the 165-day EMA. Minimum objectives would be 93.70, a level that has already been achieved. Above 95.30 targets could be 96.60 and the downtrend line from the February 2017 top at 102.27. The 200-day MA is just above 97. A return back under 92.60 would indicate that more corrective action might be needed before further advances. Under 92 would indicate that the rebound is most likely over.
© David Chapman
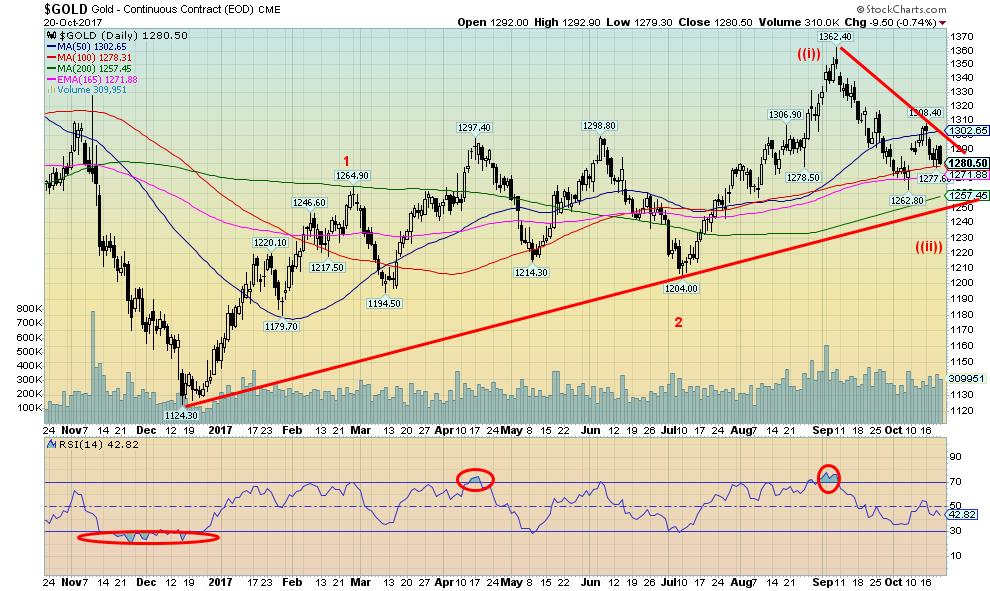
Gold withers in the face of an advancing US$. With the US$ Index higher on fears of higher interest rates and the possible appointment of an interest rate hawk at the Fed, it is probably not surprising that gold slipped again this past week losing 1.9%. Silver also dropped 1.9%. Gold is still positive for 2017 up 11.2%. After topping at $1,362 in September gold has been on a downswing. Gold’s seasonals often see a good rise in the price from roughly July to September even October before a correction sets in.
Following a correction gold’s seasonals turn positive once again, sometimes starting in late November and then topping out in February or March of the next year. The pattern has worked well this past year with a strong rally from December 2015 to a high in February than a secondary higher high in April. The low came in July followed by the top in September. If the pattern is correct gold could have further corrective action into November before finding a final low.
Once this low is established gold should embark on a strong rally into Q1 2018. Gold could fall below its recent low of $1,262, but we see strong support down to $1,240 to $1,250. Below that there is even stronger support down to $1,200. We would be quite surprised if gold fell that low as we believe the current decline is a correction to the rise from $1,204 to $1,362. A decline below $1,240, however, could indicate this drop is a lot weaker than we thought.
© David Chapman
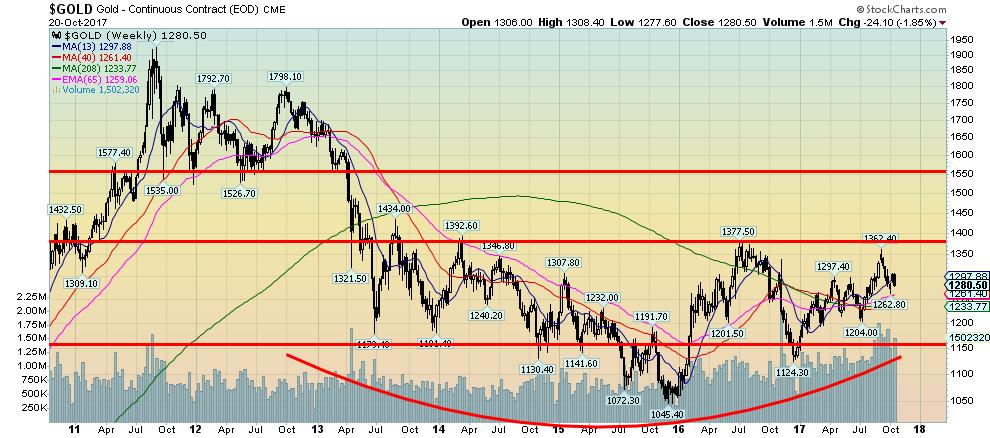
What strikes us about this longer weekly chart of gold is how long gold appears to have traded roughly between $1,150 and $1,375 over the past five years. Between $1,375 and $1,550 gold has hardly traded at all. On its way to the high of $1,924 in September 2011 high, gold plowed right through that zone. Similarly, when it collapsed in 2013 gold dropped right through the zone. It is as if it is a dead zone for gold. Instead, what we are seeing here is a massive base building as a potential launch pad.
Argumentatively, one could say it is forming a huge head-and-shoulders bottom with the head down at the December 2015 low. That low came 7 years and 2 months after the October 2008 low. In turn, the 2008 low was 7 years 7 months after the April 2001 low. Gold has an interesting history of cycle lows roughly 7 years 10 months apart, give or take 8 months. Previously, key lows were seen in late 1976, 1985, 1993, and then 2001. Merriman has noted a potential 7.83-year cycle.
If that is correct then we are embarking on a new 7.83-year cycle and the next cycle low is not due until at least 2023. The 2001 cycle low may have been a longer 23.5-year cycle low. If correct, then this is the third phase of the longer 23.5-year cycle. The third phase can be both the most bullish and most bearish cycle. If a huge head-and-shoulders pattern is forming, then a potential minimum target for gold, once it breaks up through $1,360 to $1,400, could be at least $1,750. It is not expected that gold should fall below $1,200 going forward.
Within the 7.83 cycle, there is, according to Merriman, a 32.5-month cycle with an orb of 5.5 months. Note that following the 2013 crash gold made a key low at $1,179 in June 2013. Thirty months later gold made its key low in December 2015. Going forward that would put the next 32.5-month cycle low in August 2018, give or take 5.5 months. That low, however, could be a higher low. Something to keep in mind going forward.
© David Chapman
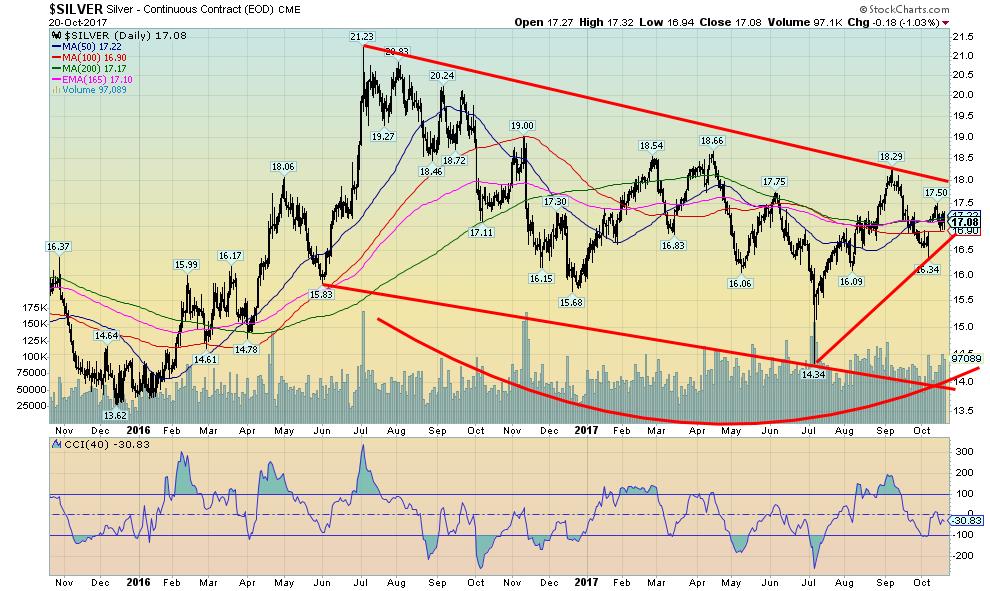
Silver is in the same position as gold. After going from a low of $14.34 in July to the high of $18.29 in September, silver has pulled back. The recent low was seen at $16.34 roughly a 50% retracement of the entire move from $14.34 to $18.29. If silver prices were to fall below $16.34, and we can’t rule that out on this pullback, then the next target might be down to $15.85. There appears to be strong support down to $16. While sentiment for gold and silver has fallen with the price, sentiment is not yet at levels where we might say a bottom is in.
© David Chapman
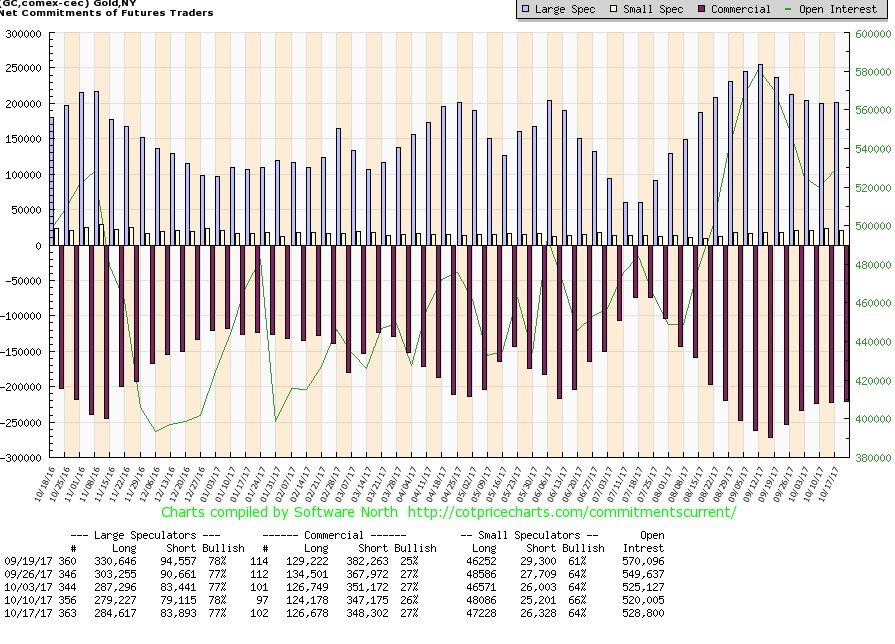
Gold`s commercial COT improved slightly this past week to 27% from 26%. The large speculators COT (hedge funds, managed futures, etc.) slipped to 77% from 78%. Movement was small as short open interest rose about 1,000 contracts while long open interest was up about 2,500 contracts. The improvement is encouraging, but the commercial COT is not yet at levels where we could say with confidence that a low is most likely in. We continue to monitor.
© David Chapman
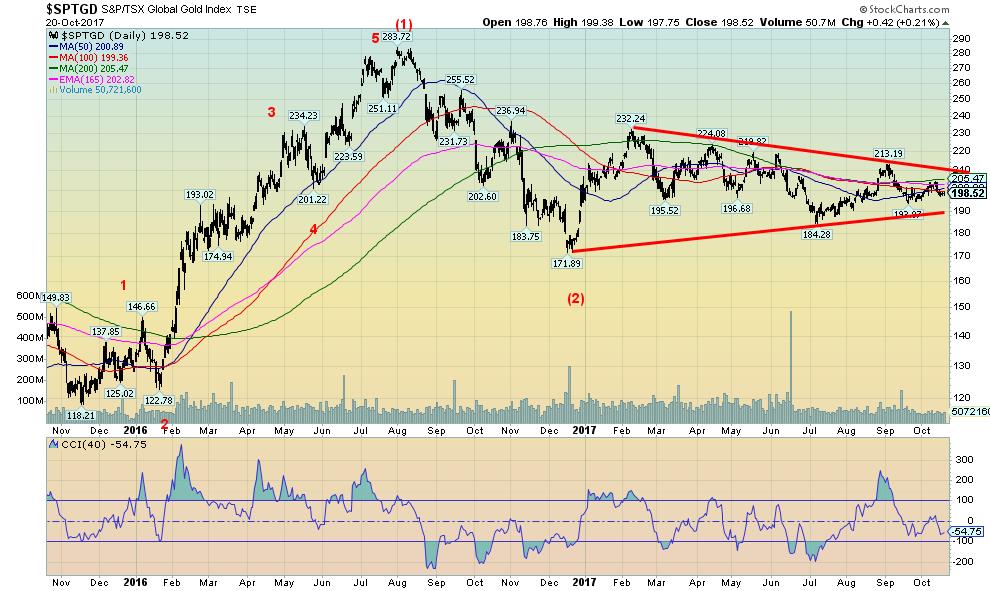
Gold stocks continue to be frustrating as this two-year chart attests. After rising in what appears as five waves (bullish) from the lows of 2015 to a top in July 2016 the gold stocks as represented here by the TSX Gold Index (TGD) have been in a long corrective mode. It is possible that wave (2) bottom in December 2016 at 171.89. The pattern formed since then is either the start of a new bull move to the upside or a continuation of the correction that got underway in July 2016. The pattern does not appear as an ascending wedge (bearish). While rather awkward-looking it may very well be an ascending triangle (bullish). We expect once this pattern is complete the break should be to the upside with potential targets up to at least 260 to 270. There appears to be solid support down to 190. However, a break below that level (not expected) could suggest new lows below 172.
GLOSSARY
Trends
Daily – Short-term trend (For swing traders)
Weekly – Intermediate-term trend (For long-term trend followers)
Monthly – Long-term secular trend (For long-term trend followers)
Up – The trend is up.
Down – The trend is down
Neutral – Indicators are mostly neutral. A trend change might be in the offing.
Weak – The trend is still up or down but it is weakening. It is also a sign that the trend might change.
Topping – Indicators are suggesting that while the trend remains up there are considerable signs that suggest that the market is topping.
Bottoming – Indicators are suggesting that while the trend is down there are considerable signs that suggest that the market is bottoming.
(Featured image via Deposit Photos. All charts are courtesy of Federal Reserve Bank of St. Louis, Coin Desk, Stock Charts and COT Price Charts.)
__
DISCLAIMER: David Chapman is not a registered advisory service and is not an exempt market dealer (EMD). We do not and cannot give individualised market advice. The information in this newsletter is intended only for informational and educational purposes. It should not be considered a solicitation of an offer or sale of any security. The reader assumes all risk when trading in securities and David Chapman advises consulting a licensed professional financial advisor before proceeding with any trade or idea presented in this newsletter. We share our ideas and opinions for informational and educational purposes only and expect the reader to perform due diligence before considering a position in any security. That includes consulting with your own licensed professional financial advisor.

-

 Impact Investing2 weeks ago
Enfinity Launches First Solar Plant in Italy with Microsoft
-

 Crypto5 hours ago
Bitcoin Wavers Below $70K as Crypto Market Struggles for Momentum
-

 Markets1 week ago
Silver Dips Sharply, While Gold Gains Amid Mixed Stock Market
-

 Crowdfunding2 weeks ago
EvenFi Launches Run-Off Service to Protect Investors as Crowdfunding Platforms Exit





You must be logged in to post a comment Login