Featured
Stock markets affected by the pandemic and the growing military tensions between the Great Powers
Stock markets continue to rise but divergences are growing and margin debt is at another record. Negative patterns are developing. The market needs a rest. Gold continues to rise slowly and could take off particularly if the U.S. dollar breaks down as it appears poised to do. Oil prices are wavering and demand forecasts have dropped particularly given the surging COVID in India.

We confess we had never heard of Deagel (www.deagel.com). So, who is Deagel, and what caught our attention? Deagel is apparently a highly regarded intelligence organization of news and research on international aviation, advanced technologies, and the military capabilities of the world’s nation-states. It sounds most similar to Janes (www.janes.com),another highly regarded global intelligence company specializing in military, national security, aerospace, and transport topics. Who owns Deagel? It doesn’t really say but its client list reportedly includes amongst others the National Security Agency (NSA), NATO, Organization for Economic Co-operation and Development (OECD), Russian Defense Procurement (RDP), Stratfor, the World Bank, and the United Nations. Deagel reports are supposedly provided to the president of the United States.
Why do we care what Deagel has to say? We are not writing on military intelligence. We have, though, been readers of Stratfor (www.stratfor.com),a U.S. research group and publisher providing geopolitical intelligence and Geopolitical Futures (www.geopoliticalfutures.com),a strategic forecasting publication of geopolitical and world events. George Freidman, the founder and Chairman of Geopolitical Futures (2015)also was a founder and chairman of Stratfor (1996).
So, what caught our attention about Deagel? We became aware of Deagel in reading a report from Doug Casey, an American writer, speculator, and founder and chairman of Casey Research (www.caseyresearch.com). Casey has a well-developed following for his views that he describes as anarcho-capitalist. This is not necessarily an endorsement of Mr. Casey’s views, which can be controversial. And what is Deagel forecasting?Well, it is a shocking 5-year forecast apparently written back in 2014-2015 that projects countries’ population size, defense budget, GDP, and more. And what’s shocking? The forecast is quite controversial. Upwards of a 70% reduction in the population of the U.S.A. by 2025. Don’t worry, Canada, as we are only going to fall by roughly 25%. Europe is also negatively impacted. All of this is an eye-opener, even if it is a Nostradamus-like prophesy. A check of Deagel’s website revealed no mention of this particular report, although others including Casey had documented it.
Of course, the first reaction is, “What is this? A QAnon conspiracy theory—a plot of the elites and the Illuminati? Is it the Deep State? A zombie apocalypse?” But no, not only will the U.S. contract its population, but most of the globe will as well. So, is this crazy? Well, when its clients are defense contractors, government agencies including the CIA, and others, can it really be considered “loony tune” predictions? And is it even possible? The answer is yes.
We do emphasize that they could be wrong and this could be just a well-placed hoax, but still, just picking this up was a bit of a surprise, given the pandemic we have been going through for the past year. Given the recent global surge in cases particularly in India and the presence of mutants and variants and some pandemic history that has seen population declines in the past, maybe this is not so far fetched after all. Even vaccines are not infallible if the virus mutates into something more deadly.
Many have called the current pandemic a hoax while others accuse China of spreading the disease, resulting in an uptick of attacks on immigration, the Chinese, and others of South Asian descent. Maybe 2025 was used as a potential date even if it doesn’t exactly fall during this time period. So, is it real, or as we noted another QAnon conspiracy theory? Or is this another in the long line of conspiracy theories associated with George Soros and Bill Gates to depopulate the world? And that the vaccine against the coronavirus is the “mark of the beast – 666”, and that Mr. Gates wants to microchip us all? We have to look no further back than a 200-page report presented in Dec. 10, 1974, by the U.S. National Security Council under Henry Kissinger titled “National Security Study Memorandum 200: Implications of Worldwide Population Growth for U.S. Security and Overseas Interests.”
The report presented a theory that population growth in lesser developed countries such as India along with a number of other populous countries was a threat to U.S. national security. The report was adopted and became official policy of the administration of President Gerald Ford. The policy and plan outlined a covert plan to reduce population growth through war and famine, amongst other means. We are uncertain as to whether this report remains U.S. official policy.
We have seen numerous theories on how the world population needs to be reduced if we as the human race are to survive. If this was QAnon we’d ignore it, but we live in a world whose population is 7.8 billion and expected to grow to 10 billion. Besides overpopulation, the world is facing serious environmental degradation and global warming that alone poses a threat to human survival. And, effectively, what this says is we could be facing the collapse of Western civilization as predicted by an intelligence unit whose reports go to the highest levels. In three years? The time frame may be out and it may never happen. However, the theory and potential of this happening shouldn’t be dismissed.
The current COVID pandemic has already taken its place in the history books as amongst the worst ever, even though it has come nowhere near some of the really big historic pandemics. Historically, pandemics are never just one and done. Pandemics come in waves. Some have lingered off and on for years. If it happens now, then how? The possible answer: biological warfare. Was COVID-19 the first shot? Biological warfare is a real and present danger. And it fits with the accusations that China is behind the current pandemic even if the proof is sketchy at best. But biological warfare is a two-way street and all the major powers have biological weapons. Call them the ‘sneaky’ weapons of mass destruction.
We cannot ignore the growing tensions between the West, led by the U.S., and Russia and China. NATO troops are massed along Russian borders in the Balkans, Poland, Hungary, Romania, and in the Black Sea. Tens of thousands of NATO troops have been redeployed recently. Russian troops are massed along the eastern Ukraine border and more are in Crimea, estimated at between 80,000 and 150,000. Ukraine has been urging membership in NATO and the U.S. has vowed support for Ukraine and has warned Russia. Daily we read that Russia is about to invade Ukraine even if the proposition is highly unlikely.
The military buildup in the South China Sea and in the Straits of Taiwan between the U.S. and China has been ongoing. It is estimated that 80% of global trade passes through the South China Sea. Maintenance of sea lanes and claims over Taiwan and the South China Sea are the dominant factors in the build-up. Could these countries go to war? One cannot say never. Many believed World War I would not happen. And when it did, the expectation was that it would be over in a few months.
Tensions between the dominant power (U.S.) and the emerging power (China), particularly as the end of dominance looms, has been recorded many times in history. It is called the Thucydides Trap, a tendency towards war when an emerging power (China) threatens to displace an existing one (U.S.). The most famous recent one was Germany (emerging power) and Britain (existing power) that led directly to World War I, killing between 15 to 22 million and devastating the European powers. Britain, the kingpin of the United Kingdom, may have emerged as a winner, but they never recovered as the pound sterling eventually lost its reserve currency status and over the next 60–80 years the British empire ceased to exist. Going back in history we can site Athens/Sparta 5th century B.C. from whence came the name Thucydides Trap. World War II and the tensions between the U.S. and Japan is another more recent example.
But what of biological warfare? Apparently some 16 countries have biological weapons: Canada, China, Cuba, France, Germany, Iran, Iraq, Israel, Japan, Libya, North Korea, Russia, South Africa, Syria, the United Kingdom, and the United States. While countries have signed a treaty banning biological weapons, the proliferation of them continues. Russia, China, and the U.S. are believed to have the world’s largest stockpiles.
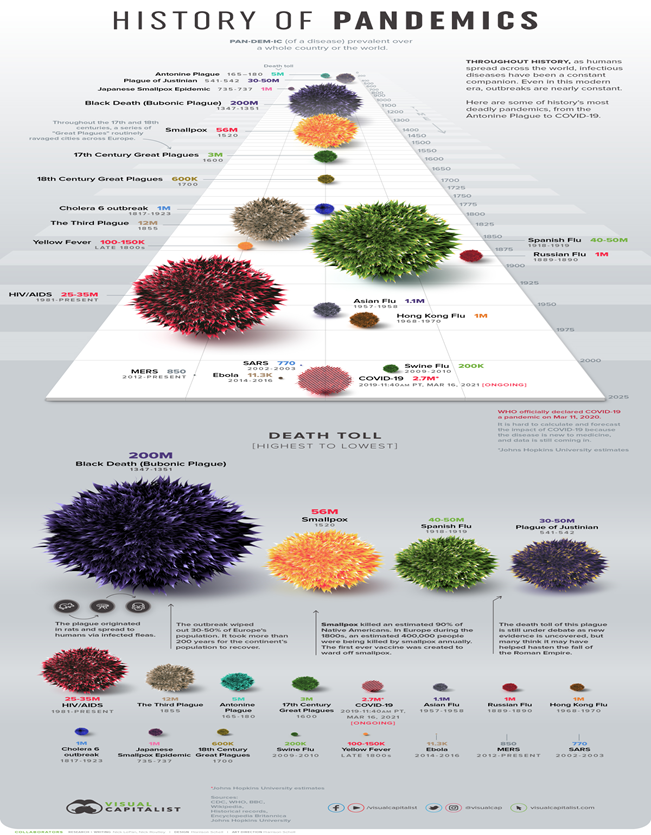
The question, of course, is could it happen? And the answer is yes. Many have accused China of bringing the coronavirus COVID-19 to the rest of the world. Whether that is true or not is moot. When both sides have biological weapons, who is to say who might use them. Nonetheless, what of an outbreak on the scale of the Spanish Flu 1918–1920? The Spanish flu is estimated to have killed between 17.5 million to 50 million and even upwards of 100 million. Using that scale of the world population at the time (1918–1920), today that could translate into between 78 million to 215 million to upwards of 500 million deaths, given today’s global population.
Even worse, what about an outbreak on the scale of the Black Death 1346–1353 that killed an estimated 75 million to 200 million in Eurasia and North Africa. The plague reduced the world’s population by roughly 25% at the time and changed the course of history. The plague recurred to lesser degrees into the 19th century. A 25% reduction of the world’s population today would translate into about 2 billion people. Vaccines exist but even vaccines are not infallible. Mutant variants could make the vaccine worthless.
So far, the COVID-19 has officially killed over 3 million, already making it one of the deadliest plagues in history, taking its place in the top ten. However, in terms of great historical plagues, it is still small. AIDS/HIV has killed an estimated 35–40 million worldwide, but that has been spread out over the years since 1981. Other great plagues were the Plague of Antonine 165–180 AD (5 million), the Plague of Justinian 541–542 AD (30–50 million), and the Black Death 1346–1353 AD (upwards of 200 million). Then there were the plagues of smallpox and cholera that dominated the 16th to 19th centuries, resulting in the decimation of the native populations of North and South America (at least 100 million and probably more). Historically, plagues and their considerable death tolls resulted in major population declines and societal and economic collapse that took years, even decades, to recover from. Wars associated with the plagues were not uncommon.
So, while it might be fanciful and easy to dismiss the Deagelreport as just another conspiracy theory, we should not be dismissive about it. The current COVID-19 plague has put an exclamation mark on that. Something to think about.
Bank of Canada (BofC) Reduces Bond Buying
We were a bit surprised to read in our morning paper (The Globe and Mail, Report on Business,April 22, 2021) that the BofC was poised to reduce its bond buying and had raised its economic forecast for 2021. Maybe they hadn’t noticed the latest round of lockdowns in Ontario and elsewhere as a result of the rise in pandemic numbers because of the variants. Recent numbers show that the third wave cases in Canada of the pandemic have equalled the highs of second wave and the number of active cases has exceeded the peak of the second wave. In terms of deaths, however, the numbers are (thankfully) still below the previous peak.
Nonetheless, the BofC has noted they will reduce their bond purchases (QE) to $3 billion/week from $4 billion/week. The overnight rate is to remain the same at 0.25%. However, the BofC revised its forward guidance that now suggests a rate hike in the second half of 2022. Previously that guidance said 2023.
The BofC is now expecting the Canadian economy to grow 6.5% in 2021, up from 4%. That is also higher than what the federal government used in its recent budget which was 5.8%. First quarter GDP is expected now to be 7.0% annualized, revised up from a previous forecast of a contraction of 2.5%. We couldn’t help but note that The Economist’sintelligence unit estimate/forecast for Canada for 2021 is only 4.8% growth. Is optimism rising despite the surge in the pandemic and further lockdowns, particularly in Ontario?
As a result, the Canadian dollar surged back to 80 cents although that is still short of the recent high at 80.88. Rising commodity prices are also helping push up the value of the Canadian dollar. The 10-year Government of Canada bond (CGB) bounced back to 1.54%, but again this is still short of a recent high of 1.60%.
The report said little about what this means to the BofC purchasing Government of Canada in auctions. It is noted that the BofC owns some 42% of the federal government’s bond supply. The federal government is bringing forth in its budget $101.4 billion in new spending to support the economy as a result of the pandemic. The projected federal deficit is expected to be $354.2 billion for the year just ended 2020–2021 and $154.7 billion for 2021–2022.
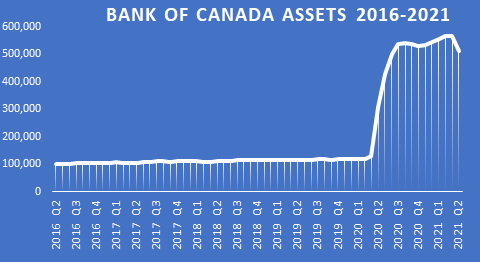
The BofC’s balance sheet has ballooned since the pandemic got underway in March 2020. It has gone from $118.7 billion in March 2020 to $500.7 billion in April 2021. The recent peak was $575.4 billion, a 384% increase from March 2020. The percentage increase is actually greater than the 84% increase of the Federal Reserve’s assets in the same time period. However, the Fed’s assets are up $3.5 trillion. The BofC’s assets have fallen primarily in holding fewer treasury bills and repurchase agreements (repos).
The revised guidance by the BofC is now, for the moment at least, out of sync with the other central banks, particularly the U.S. Federal Reserve. However, the reduction fits with calls to “taper” its program of bond purchases. But will it cause problems in the bond market? That remains to be seen.
Canada’s federal debt has shot up over the past year because of the deficits related to the COVID-19. The BofC has been a major purchaser of Canada’s debt during this period, estimated at some 84% of the increased deficits. Total Canadian federal debt is expected to rise to near Cdn$1.1 trillion and Cdn$1.4 trillion over the next few years. This is measured against a Cdn$2.2 trillion economy putting debt to GDP near 49%.
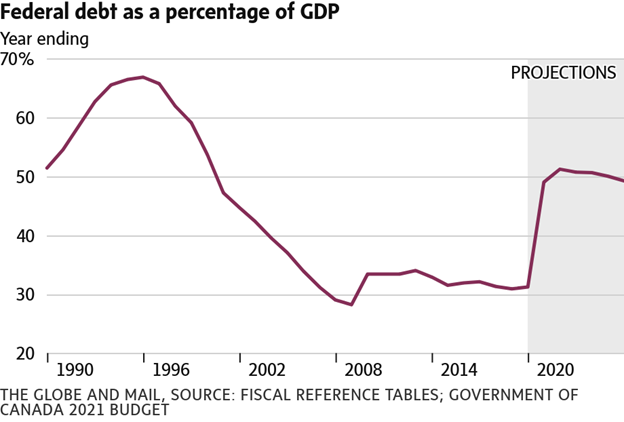
Despite the sharp rise in the deficit, now projected at roughly 9.2% of GDP, Canada’s federal debt to GDP remains the lowest in the G7. The chart on the next page shows federal debt to GDP as result of the sharp rise in deficits over the past year plus projections out to 2026. Canada’s projected debt to GDP for 2021 is only 49%. This compares very favourably with the U.S. at 130%, the U.K. at 110%, Germany 85%, Italy 166%, France 119%, and Japan 272%. If one includes provincial debt the ratio jumps sharply, estimated to be 112%. Canada’s problematic debt is not the federal government debt but instead corporate and household debt. Canada’s household debt to GDP is one of the highest in the world. Many economists, including the BofC have cited the risks of high household debt. Canada’s federal debt to GDP peaked back in 1996 at 67% but fell to 28% by 2009 before it started to rise again.
The BofC appears to be ahead of the curve of the other central banks. If their growth projections are correct (or even close), then Canada faces at least a somewhat positive recovery even if the growth tapers off again in 2022—as was the case in other post-recession periods. But if the third wave of the pandemic proves to be too much, the rosy forecast could turn much darker.
The Pandemic Rages On!
The third wave continues with a seven-day average now of over 819 thousand surpassing the peak of the second wave. Deaths are also up just under 13,000 daily a level that is still below the peak of the second wave. The major surge has been seen in India although all countries to some extent have seen their case numbers rise. India’s health care system is on the verge of collapse as bodies pile up and case numbers rise. The U.S. case load has declined to levels seen during the first wave while daily deaths are down sharply more in line with last summer. People getting vaccinated has helped and the variants do not appear to have hit as seen elsewhere. In Canada case levels are back where they were during the second wave but daily deaths remain low.
Sunday April 18, 2021 – 14:20 GMT
World
Number of cases: 147,317,32
Number of deaths: 3,116,012
U.S.A.
Number of cases: 32,790,96
Number of deaths: 585,893
Canada
Number of cases: 1,172,004
Number of deaths: 27,394
Source: www.worldometers.info/coronavirus
Chart of the Week
Yes, we have noted the potential for another commodity supercycle before. But now we appear to be getting closer to breaking out. A commodity supercycle is not new. Since 1770 we have counted seven of them: 1775–1779, 1792–1814, 1843–1864, 1897–1920, 1933–1951, 1968–1980, and 1999–2011. Each major up-cycle was followed by a vicious bear market. The average length of a supercycle was 16 years, ranging from 4 years to 23 years. That implies that this one will last until 2036 with a range of lasting until 2024 to 2043. Generally speaking, producer prices have followed the commodity supercycle. However, as this chart of the PPI notes, the PPI had a tendency to peak prior to the peak of the commodity supercycle. 2008 was an exception when both peaked together. Secondary peaks were seen in 1920, 1951, 1980, and 2011, more closely aligned with the CRB peak.
Producer Prices % Change from Year Ago 1913-2021
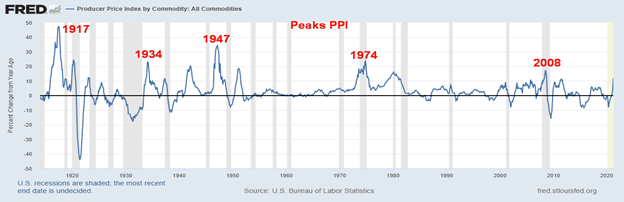
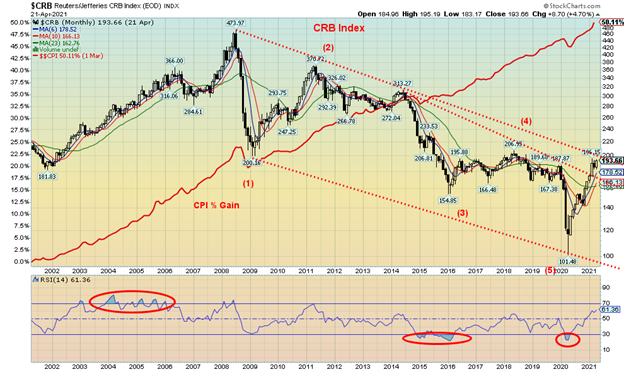
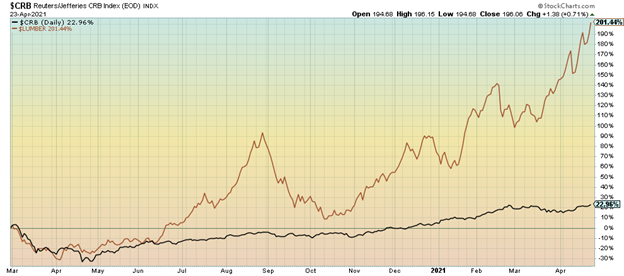
The monthly chart of the CRB Index shows the CRB is on the cusp of breaking out above the downtrend line from the 2008 top. The last supercycle was sparked by the rise of the BRICs (Brazil, Russia, India, and China), resulting in huge demand surges for raw materials, food, energy, and commodities. That cycle peaked with the financial cycle before the 2008 financial crash. There was another little surge into 2011 and the EU/Greek crisis. By the time the Chinese economy cooled off in 2015, PPI was on the way down as were commodity prices.
We note the CRB appears to have made five very distinct waves to the downside, bottoming with the pandemic crash in March 2020. What should now happen is at minimum a multi-year up-cycle forming what could be an ABC pattern. The commodity supercycle was usually accompanied as well by a falling U.S. dollar. Note the U.S. dollar was in a major downswing during 1971–1979, 1985–1995, and 2002–2011, generally coinciding with the commodity supercycle. The US$ Index may have topped back in January 2017 with a secondary top in September 2019. There was another mini-peak seen in March 2020 coinciding with the March 2020 pandemic crash. Since then, the US$ Index has been on a downward swing. A weak U.S. dollar helps feed commodity prices as foreign producers are forced to adjust their price upward to compensate for their strengthening local currency.
While there could be pent-up demand as a result of the pandemic there are also signs of growing shortages. Given all the infrastructure and fiscal stimulus packages, that could play into raising demand. The EU is providing a €1.8 billion package and the U.S. $3 trillion. Canada is adding $101 billion as part of a larger package. One of the biggest gains has been seen for lumber, up roughly 200%. Lumber prices have soared since March 2020. Buyers could seek alternatives such as bamboo, hemp, cork, cardboard, and more for lumber or postpone a project until prices cool off.
Commodities that have jumped in price sharply out of the March 2020 low include copper, oil, natural gas, silver, along with cotton, corn, and soybeans. Our charts below show the rise in prices for select commodities since March 2020. As for gold bugs, gold has not been a high performer. However, silver, needed for photovoltaic installations and growing in use for electric vehicles and other green products, has seen a sharp rise already. Gold should follow. Gold is not just a pretty bauble. It is also money and if fiat currencies are falling in value, gold will rise.
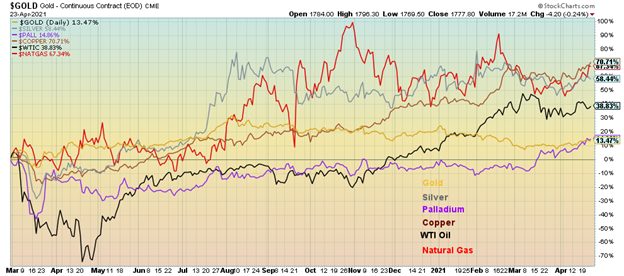
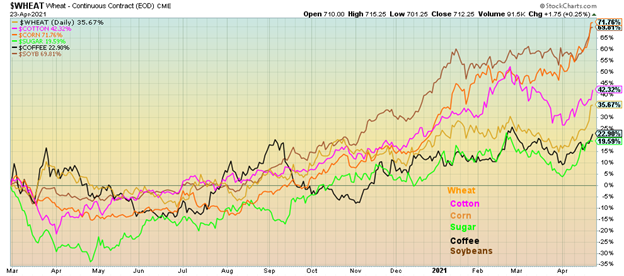
Gains since March 2020 see precious metals up – gold +13.5%, silver +58.4%; industrial metals up – palladium +14.9%, copper +70.7% **; energy – oil +38.8%, natural gas +67.3% **; softs up – wheat +35.7%, cotton +42.3%, corn +71.8% **, sugar +19.6%, coffee +22.9%, soybeans +69.8% **; and finally lumber +201.4% *** and the CRB Index +23%.
So, inflation is there. The question is how it actually feeds through the economy and shows up in the PPI and CPI. Nonetheless, the central banks’ emphasis is on the core inflation rate ex. food and energy. We note that, except for the 1970s the commodity supercycle did not produce a huge inflationary cycle. Given the slackness in the economy and continued high unemployment, our suspicion is we are unlikely to experience another 1970s style inflation now.
MARKETS AND TRENDS
| % Gains (Losses) Trends | ||||||||
| Close Dec 31/20 | Close Apr 23/21 | Week | YTD | Daily (Short Term) | Weekly (Intermediate) | Monthly (Long Term) | ||
| Stock Market Indices | ||||||||
| S&P 500 | 3,756.07 | 4,180.13 (new highs) | (0.1)% | 11.3% | up | up | up | |
| Dow Jones Industrials | 30,606.48 | 34,043.39 | (0.5)% | 11.2% | up | up | up | |
| Dow Jones Transports | 12,506.93 | 15,133.43 (new highs) | 1.4% | 21.0% | up | up | up | |
| NASDAQ | 12,888.28 | 14,016.81 | (0.3)% | 8.8% | up | up | up | |
| S&P/TSX Composite | 17,433.36 | 19,102.33 | (1.3)% | 9.6% | up | up | up | |
| S&P/TSX Venture (CDNX) | 875.36 | 930.63 | (1.5)% | 6.3% | down | up | up | |
| S&P 600 | 1,118.93 | 1,350.06 | 0.2% | 20.7% | up | up | up | |
| MSCI World Index | 2,140.71 | 2,290.66 (new highs) | (0.6)% | 7.0% | up | up | up | |
| NYSE Bitcoin Index | 28,775.36 | 49,742.55 | (19.1)% | 72.9% | down | up | up | |
| Gold Mining Stock Indices | ||||||||
| Gold Bugs Index (HUI) | 299.64 | 292.34 | (0.6)% | (3.1)% | up | down (weak) | up | |
| TSX Gold Index (TGD) | 315.29 | 312.85 | 0.1% | (0.8)% | up | down (weak) | up | |
| Fixed Income Yields/Spreads | ||||||||
| U.S. 10-Year Treasury Bond yield | 0.91 | 1.56% | (1.9)% | 71.4% | ||||
| Cdn. 10-Year Bond CGB yield | 0.68 | 1.51% | (2.0)% | 122.1% | ||||
| Recession Watch Spreads | ||||||||
| U.S. 2-year 10-year Treasury spread | 0.79 | 1.40% | (2.1)% | 77.2% | ||||
| Cdn 2-year 10-year CGB spread | 0.48 | 1.18% | (4.1)% | 145.8% | ||||
| Currencies | ||||||||
| US$ Index | 89.89 | 90.84 | (0.8)% | 1.1% | down | down | down | |
| Canadian $ | 0.7830 | 0.8017 | 0.2% | 2.3% | up | up | up | |
| Euro | 122.39 | 120.97 | 1.0% | (1.2)% | up | up | up | |
| Swiss Franc | 113.14 | 109.48 | 0.7% | (3.2)% | up | down (weak) | up | |
| British Pound | 136.72 | 138.82 | 0.3% | 1.5% | neutral | up | up | |
| Japanese Yen | 96.87 | 92.68 | 0.8% | (4.3)% | up | down | down | |
| Precious Metals | ||||||||
| Gold | 1,895.10 | 1,777.80 | (0.1)% | (6.2)% | up | down | up | |
| Silver | 26.41 | 26.08 | (0.1)% | (1.3)% | neutral | up (weak) | up | |
| Platinum | 1,079.20 | 1,233.10 | 2.0% | 14.3% | up | up | up | |
| Base Metals | ||||||||
| Palladium | 2,453.80 | 2,861.20 (new highs) | 3.0% | 16.6% | up | up | up | |
| Copper | 3.52 | 4.34 | 4.1% | 23.3% | up | up | up | |
| Energy | ||||||||
| WTI Oil | 48.52 | 62.1 | (1.7)% | 28.1% | up | up | up | |
| Natural Gas | 2.54 | 2.82 | 5.2% | 11.0% | up | up | neutral |
New highs/lows refer to new 52-week highs/lows and in some cases all-time highs.
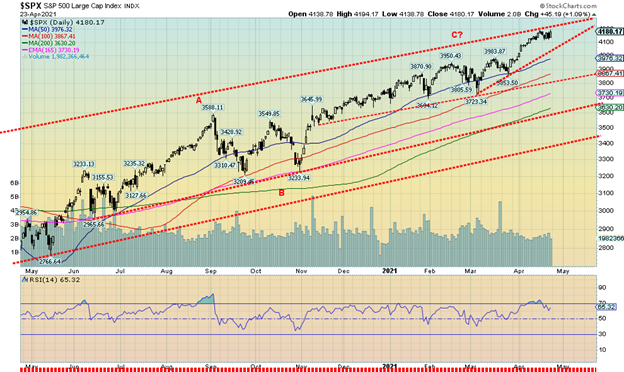
The S&P 500 once again made new all-time highs but then turned down, losing a small 0.1% on the week. A catalyst was the announcement of potential tax hikes by the Biden administration. Given the costs of the pandemic plus new initiatives for infrastructure (badly needed) that would create employment, something had to give. However, tax hikes will fall mainly on corporations and the wealthy, probably taking back recent gains given to them during the Trump years. The Dow Jones Industrials (DJI) did not make new all-time highs and fell 0.5% this week. The Dow Jones Transportations (DJT) continued to benefit from thoughts of openings and flying again, rising 1.4% to new all-time highs. The NASDAQ fell 0.3% diverging with the others not making new all-time highs once again as tech continued to suffer a bit. The small cap S&P 600 did gain about 0.2% but is nowhere near all-time highs. In a bit of a divergence, the S&P 500 Equal Weight Index gained 0.5% and did make new all-time highs.
In Canada the TSX Composite lost 1.3% and the TSX Venture Exchange (CDNX) lost 1.5%. In the wider world, the MSCI World Index made new all-time highs and then fell 0.6%. In the EU, the London FTSE lost 1.5%, the Paris CAC 40 fell 0.5%, and the German DAX dropped 1.2%. Nobody made new all-time highs. In Asia, China’s Shanghai Index (SSEC) gained 1.4% but the Tokyo Nikkei Dow (TKN) dropped 2.2% and continues to look very toppy.
With momentum fading and volume lagging, the stock markets are appearing heavy and poised for a potential pullback. Our expectation is that any pullback should be shallow, not unlike what we saw last September/October. At the time the S&P 500 fell in total about 10.5% at its worst. There appears to be a bit of a wedge triangle or ascending triangle forming that could suggest a decline to a least 3,800. That would be a 9.3% decline from the recent top. A breakdown under 3,800 would be more problematic and could suggest a decline to major support around 3,600. Under 3,600 could spark more selling and under 3,400 possible panic. The market is looking tired and needs a pullback to refresh itself. We continue to look into 2022 as a more dangerous year as the 6.5-year cycle begins to assert itself.
The last 6.5-year (range 5–8 years) cycle came in 2016. We believe the 2018–2020 drops were a part of a half-cycle of the 18-year cycle which is next due 2027 +/- 3 years 2024–2030. We remain concerned about the existence of the 90-year cycle last recorded in 1932 with the next one due 2022 but anywhere from 2021 to 2037. We do see considerable problems for market lying ahead during the remainder of the 20s and into the 30s. But, of course, we do not know quite how it will play out as we could even see more all-time highs first. The last 18-year cycle (range 15-21 years) bottomed in 2009. If one goes back to 1932, we did see key lows in 1949 (17 years), 1970 (21 years), 1987 or 1990 (17 years or 20 years), then 2009 (22 years from 1987, 19 years from 1990). The low in 1974 was basically a half-cycle low of the longer 72-year cycle or even the 90-year cycle. The 72-year cycle last bottomed in 2009 (77 years from 1932 or even 2002 70 years from 1932). These cycles work pretty well and rarely (if ever) fail. Even though there are few examples of the 90-year cycle we are wary of its possible existence. Given the pandemic and the potential for more trouble later in a debt-laden world, anything is possible. Depressions are all about debt-collapse. And this time it is against the backdrop of a deadly pandemic.
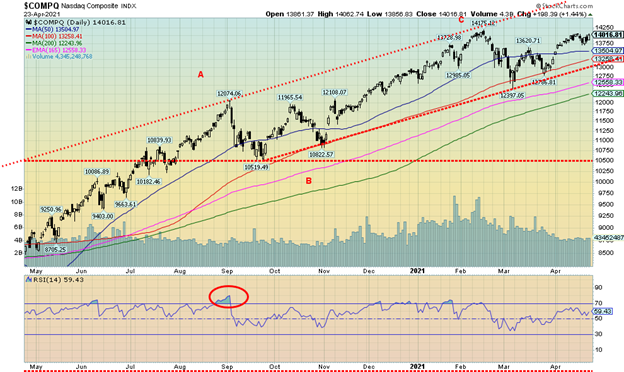
The NASDAQ continues its divergence with the S&P 500, DJI, and DJT. While the other three indices have made new all-time highs (except for the DJI this past week), the NASDAQ remains below its all-time highs. The NASDAQ led on the way up. Could it lead on the way down? The NASDAQ lost about 0.3% this past week which was at least in line with the S&P 500 and the DJI. Key components (the FAANGs) saw the following: Facebook down 1.7%, Apple up a small 0.1%, Amazon down 1.7%, Netflix a big loser down 7.5% (what happened to the subscribers?), and Google the star up 0.8% to new all-time highs. For the others, Microsoft was up about 0.2% also to new all-time highs; however, Tesla lost 1.4% and Twitter was down 4.4%. The big value stock Berkshire Hathaway lost 0.1% but also made new all-time highs. The NASDAQ continues to lose momentum even as it scrambles to move higher. That continues to suggest to us that a decline is coming, although as we noted with the S&P 500 it should not be the fatal decline. The first sign of trouble is under 13,500. The major breakdown comes under 13,000. Below that there is support around 12,500 and 12,200 where the 200-day MA is. Whether the top comes next week or in early May is moot as the NASDAQ in particular continues to suggest that at least a pullback of some magnitude is coming. Of course, new highs could change that and the top of the channel is up around 14,500.
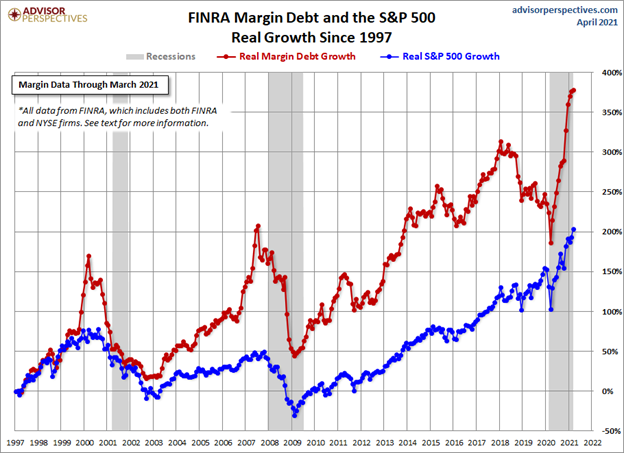
Margin debt continues to grow at a record pace. In March, margin debt grew 1.1% month-over-month to another record high. The chart speaks for itself. In looking back on this chart, we can’t help but note that margin debt did not rise through either 2001-2002 recession or the 2007-2009 recession. But it is going up this time at a record pace.
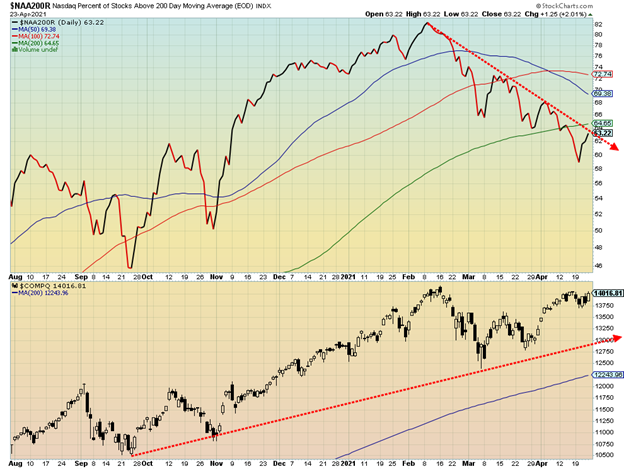
The biggest divergences we are seeing in the indicators are with the NASDAQ. Here we have the NASDAQ percent of stocks trading above their 200-day MA. We have been falling for weeks, even as the NASDAQ itself has been moving higher. While the recent NASDAQ has not made new highs, the indicator above has been making lower highs. It has now fallen under its 200-day MA. The NASDAQ itself is over 14% above its 200-day MA. A significant divergence.
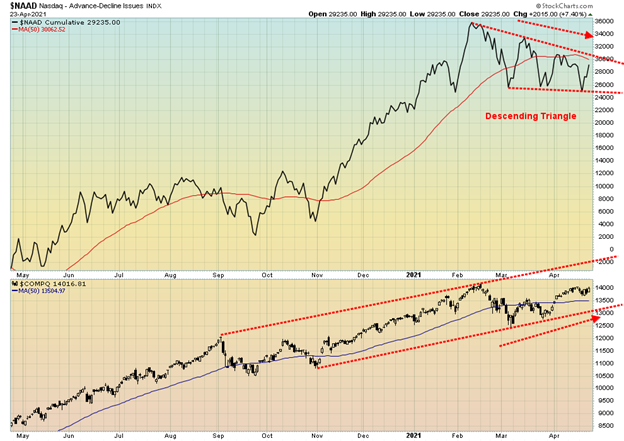
Here is another diverging NASDAQ chart. The NASDAQ advance-decline line cumulative is forming what appears to be a descending triangle. A descending triangle is bearish and suggests it will fall through the bottom of the triangle. A descending triangle is characterized by falling or a series of lower highs and a relatively flat bottom of lows. Meanwhile, the NASDAQ has been rising or at least has been trying to keep on rising. The AD line has fallen below its 50-day MA while the NASDAQ remains above its 50-day MA. This is just another divergence that suggests to us the market could be poised to fall. And it is different from the AD line for the S&P 500 which remains up.
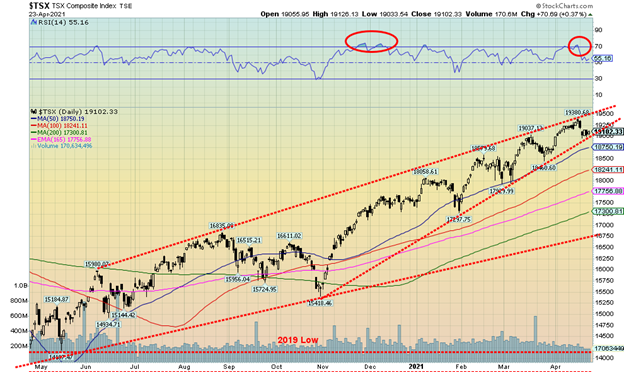
For a change the TSX Composite failed to make a new all-time high. This past week the TSX fell 1.3%. The TSX Venture Exchange (CDNX) lost 1.5%. Only five of the 14 sub-indices were up on the week, led by Consumer Discretionary (TCD) gaining 1.2% to new all-time highs. Real Estate (TRE) was up 0.4% also to new all-time highs as was Financials (TFS) up 0.1% and again new all-time highs. Of the 9 sub-indices that closed down on the week the leader was Energy (TEN), down 4.2% followed by Information Technology (TTK), down 4.1%. Industrials (TIN) lost 1.9%. The TSX Composite is sitting on the cusp of a possible breakdown under an ascending wedge triangle. If that’s correct, then the collapse could take it back to 16,750 (a 13.5% drop). Key areas of support along the way could be seen at 18,500, and 17,750. Any one of those areas could halt the decline. Trading has become narrower and narrower over the past few weeks as the TSX climbs in the wedge triangle. Time is running out and either the index waffles through the triangle or we hit an air pocket and fall. Only new highs could change this scenario.
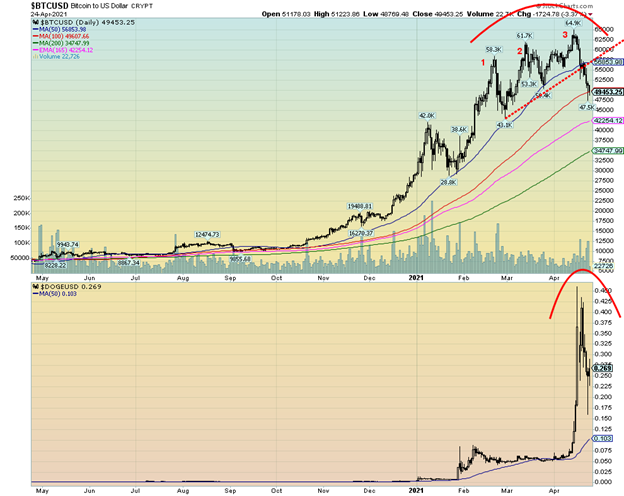
Is the crypto party over? This past week or two has been wild as cryptos leaped to new highs—then this past week reversed and dropped like stones. Bitcoin fell 19.1% on the week as measured by the NYSE Bitcoin Index. The big star had been Dogecoin that had soared from 5.5 cents on April 1 to a peak of almost 46 cents by April 16 for a mind-boggling gain of 734%. This past week Dogecoin collapsed, hitting a low of 16 cents before rebounding to almost 27 cents. The last time we checked, Dogecoin was still trading around 27 cents. Dogecoin’s market cap soared to $50 billion making it worth almost as much as the Bank of Montreal (BMO). When a joke/satire becomes that expensive then you know something is out of line.
Bitcoin made we call three thrusts to a high (1,2,3). We’ve seen this pattern before. It makes a high (1), pulls back, then makes a somewhat higher high (2) followed by another pullback then it makes it final higher high (3) before collapsing. This week Bitcoin collapsed. Its market that was over $1 trillion is still lofty at around $923 billion. What’s key now is that February 28 low at $43,061. If that breaks then an outright panic could occur. What goes up fast comes down even faster. The three thrusts to a high is usually fatal.
The catalyst may have been Turkey announcing a ban on cryptocurrencies and hints that India will follow and some other countries (Nigeria) are banning crypto exchanges. Prohibitions are growing. Next is regulation of crypto exchanges. The OSC has decided to regulate crypto trading platforms. More regulation elsewhere is sure to follow. As well, stories of scams still proliferate. (And don’t forget your password as you’ll be locked out forever.) Has the bubble burst? A break of $43,000 would be the first good sign. A break of the January low near $28,000 would be the final nail in the coffin. As to Dogecoin, well, what can we say except we wouldn’t be surprised to find it fall all the way back to under a penny once again.
U.S. 10-year Treasury Bond/Canadian 10-year Government Bond (CGB)
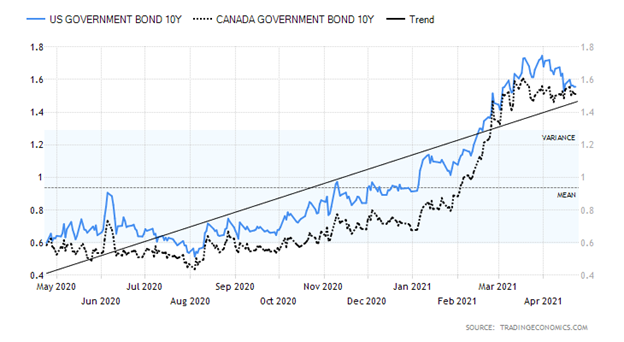
The U.S. 10-year treasury note continued its recent slide, losing 1.9% this past week to 1.56%. The 10-year is now down, just over 10% from its 1.74% high seen in March. (Prices that move inversely to yields rose). Does that mean that bond yields have topped and are about to plunge again? Well, not yet. This could just be a pullback. Our expectations were that we could eventually see 2%. The threat is another possible slowdown. No, the U.S. has been doing better, but the threat of variants and the horror show in India are raising some doubts about the vaccines, even though there is no evidence yet that they won’t work. This past week economic numbers were generally good again, although there were not a lot of numbers to trade off. Initial jobless claims fell again to 547 thousand down from last week’s 586 thousand and below consensus of 617 thousand. Existing home sales fell 3.7% in March when the market expected an 0.8% gain. Existing home sales in March was 6.01 million vs. 6.24 million in February and expectations of 6.19 million. New home sales, however, surprised on the upside, jumping 20.7% in March way, above February’s 16.2% decline and above the expected 12% gain. In terms of units, that equated to 1.021 million vs. 846 thousand in February and an expected 886 thousand. The better-than-expected new home sales helped steady the decline of the 10-year. Our breakdown point remains at 1.40%. Under that level we could fall further towards 1.20%. New highs above 1.74% would suggest we are on our way again towards 2%.
Canada’s 10-year Government of Canada bond (CGB) was off to 1.51%, down from 1.54%. Canada recorded a year-over-year inflation rate of 2.2% in March above the 1.1% in February but in line with expectations. The core inflation rate (ex food and energy) was 1.4% above February’s 1.2%. There wasn’t much else to report.
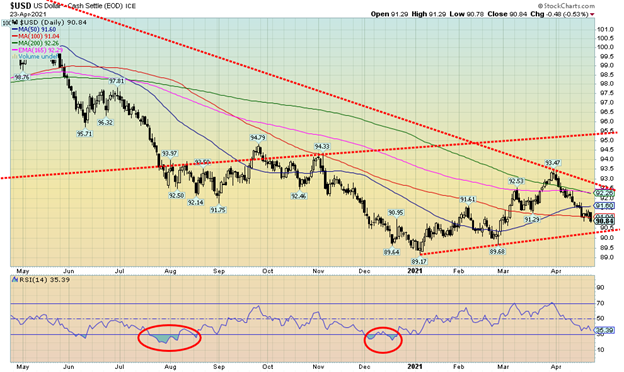
Is the US$ Index poised to break down? The US$ Index fell 0.8% this past week, closing below the March low of 91.29 and is now approaching a key support line near 90.50. The US$ Index closed under the 100-day MA at 90.84. A breakdown under 90.40 would confirm a more serious breakdown and we could then be set up to retest the January low of 89.17. The currencies were up on the week as the euro gained 1.0%, the Swiss franc was 0.7%, the pound sterling jumped 0.3%, while the Japanese yen was up 0.8%. The Canadian dollar gained 0.2%, closing over 80. A falling US$ Index is positive for gold, although on Friday gold was down despite the weak US$ Index. The US$ Index appears to be developing another leg to the downside but what’s key now would be the fast-approaching 90.40/90.50 support zone. Indicators are not yet oversold so there is potentially room to move lower. If this downturn is to fail then the looming 90.40/90.50 zone must hold.
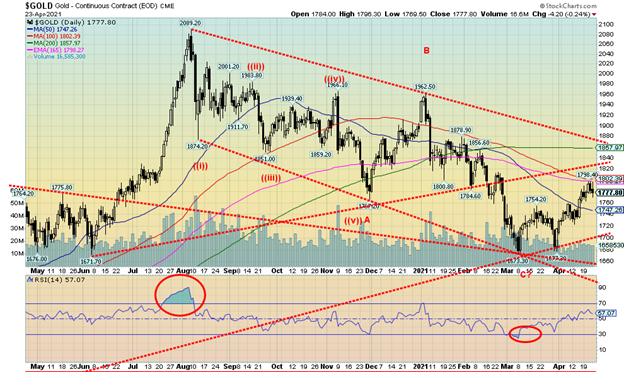
Stronger than expected sales of existing homes startled gold on Friday as the assumption was that this was sign of a rapidly improving economy. The result was that bond yields rose. But the U.S. dollar fell so gold’s decline was slightly baffling. As well, while bond yields rose, they remain below the recent highs. Gold also shrugged off proposals by the Biden administration to hike the capital gains tax. That negatively impacted the stock market but gold was fine. Gold has been weak over the past few months after peaking last August 2020 because of vaccines and hopes for opening the economy while also seeing some positive economic numbers. The result was rising bond yields and a rising U.S. dollar, all negative for gold. Helping gold, although only marginally, was renewed consumer demand in China and India following a year where demand sagged. India consumer demand could dampen again, particularly with the surge in COVID which could result in huge swaths of the economy shutting down. What is needed is more investment demand coupled with more inflows into ETFs and more hedge fund buying. All three remain low but have not stopped or regressed.
This past week gold fell 0.1%, as did silver. Platinum, however, rose 2.0% and palladium, more an industrial metal, leaped to a new all-time high, up 3.0%. Copper was also up 4.1% to a new high close but just shy of making a new high. Copper is getting closer to its all-time high of $4.65 seen in February 2011.
Forecasts we see for gold remain mixed. We have seen everything from hyperventilating bullish to depressive bearish. Nonetheless, most analysts remain upbeat and bullish although we do read bearish reports as well. Gold has rallied past its first resistance zone at $1,750/$1,760 but it is now approaching its second resistance zone $1,800/$1,825. Once we are through $1,825, we could head to the final key resistance zone at $1,860/$1,880. Over $1,880 we would be breaking the downtrend from August and we could begin to see some strong up moves. But until then we are now at the second either break-through or fail zone. Silver is trying to break above a similar zone at $26.50. We are establishing an uptrend and indicators are not overbought with considerable room to move higher. To the downside, if a correction is to develop, we need to see $1,750 hold. A breakdown under $1,740 would be negative. Under $1,720 could set up a retest of the low at $1,673.
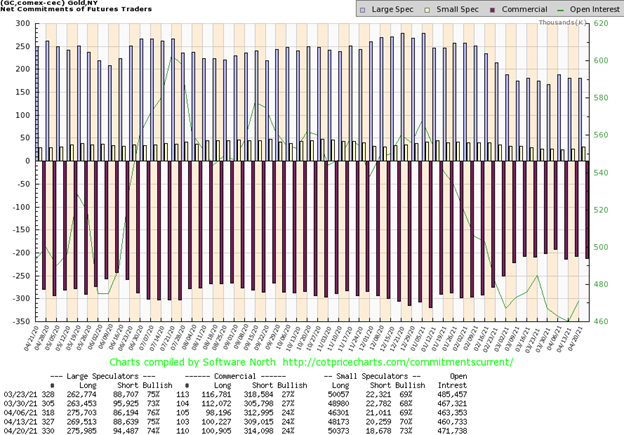
The gold commercial COT (bullion producers, bullion banks) was unchanged this past week at 24%. However, there is some concern that short open interest jumped roughly 5,000 contracts. Long open interest was up a small 700 contracts. The large speculators COT (hedge funds, managed futures, etc.) slipped slightly to 74% from 75%. However, long open interest jumped over 6,000 contracts while short open interest also rose about 6,000 contracts. Overall, gold open interest rose about 9,000 contracts on a week that gold prices fell. The commercial COT wasn’t as good as we had hoped for so we remain cautious going forward. However, it is not the end of the world either and in the past gold has rallied even as the commercial COT remained negative.
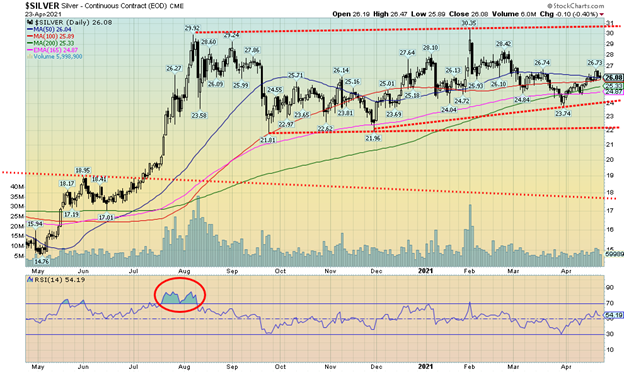
Silver’s sideways action continues. But could we be forming an ascending triangle which is bullish? Since making a low back in September at $21.81 succeeding lows have been higher: $21.96 in November, then $23.74 more recently in March. The highs have been relatively flat. That is our definition of a potential ascending triangle: rising bottoms with relatively flat highs. If this is correct, then a breakout to new highs above $30.35 could in theory project up to about $39. This is now premised on the basis that silver does not break the current low rising uptrend line, currently near $24. Our preference right now is that we hold $26 although we could tolerate a correction back to around $25.50. Breaking under $25 would, however, be a warning that things could be going amiss. To the upside, we need to quickly regain the recent high near $26.75 but we really need to break over $28 to convince us that we are indeed poised to move higher. Over $28.50, the odds increase substantially that new highs are ahead.
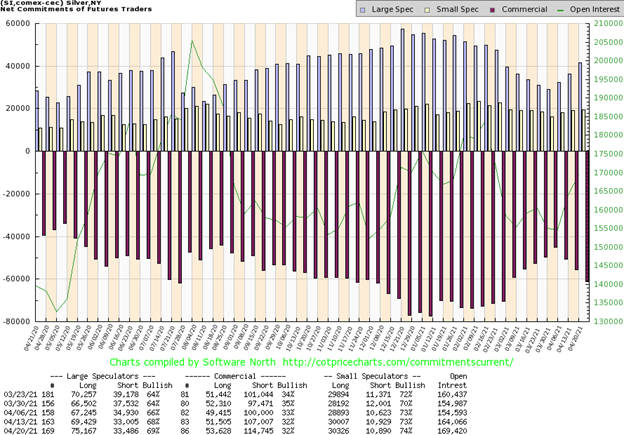
The silver commercial COT like the gold commercial COT was unchanged this past week at 32%. However, there was roughly a 7,500+ jump in short open interest that more than offset a 2,000 contract jump in long open interest. Overall, open interest rose over 4,000 contracts on a week that silver fell a small 0.1%. The large speculators COT rose to 69% from 68% as they added about 6,000 contracts to long open interest while short open interest was largely unchanged, up less than 500 contracts. We continue to view the silver commercial COT cautiously. Naturally, we’d prefer it to be rising to over 40%, but we have seen the commercial COT remain subdued even as silver prices rise in the past. At 32% we are down from 35% seen just three weeks ago.
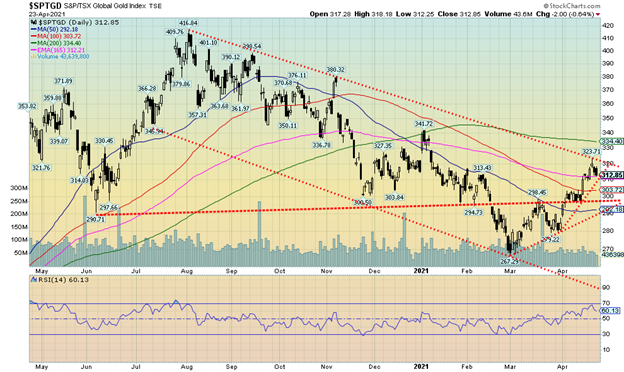
The gold stocks are now approaching key resistance zones that could make or break the market going forward. This past week the TSX Gold Index (TGD) eked out a miniscule 0.05% gain (which we generously rounded off to a gain of 0.1%), while the Gold Bugs Index (HUI) lost 0.6%. Both indices are now just shy of their 200-day MA and at downtrend resistance. An uptrend is being established but it is still in its early stages. The TGD has gained 17% from the early March low but remains off 25% from its August 2020 high. The Gold Miners Bullish Percent Index (BPGDM) at 46.68% is effectively neutral here. Technical indicators are in uptrends and are nowhere near overbought, suggesting there is considerable room to move higher. The TGD has good support down to 300 but a break under that level and especially under 290 could set up a retest of the low. A breakout above 334 (the 200-day MA) would be positive, although we would look for consecutive closes over 342 to confirm any breakout. We are encouraged with the rebound in the gold stocks. They appear to be leading the way, something we need to see if this bull move in gold (and silver) is to be sustainable. But we need to remind ourselves we are at or approaching a crucial point that will determine whether this move has legs or not.
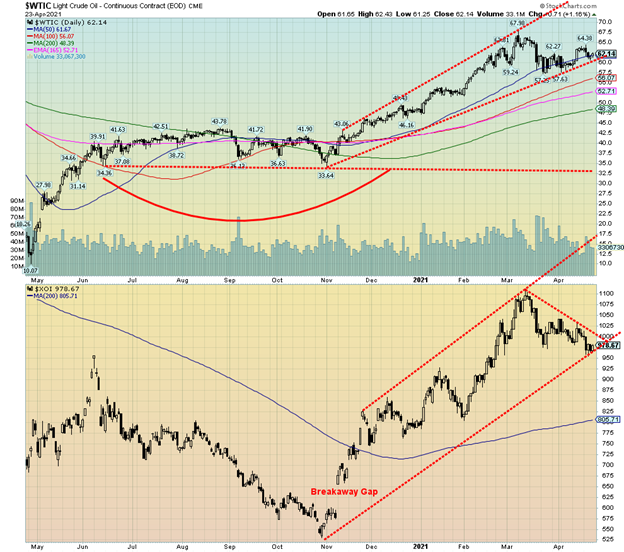
Oil prices bounced back this past week after falling, but could the huge surge of COVID in India threaten the turnaround? While things seem to be perking up in the U.S. and to a lesser extent in the eurozone, the huge surge in India has the potential to upend things. With records being made almost daily in India, fuel consumption forecasts in India see the potential for a sharp 20% or more decline as lockdowns take place.
This past week WTI oil prices actually fell 1.7%, even as natural gas (NG) prices rose 5.2%. The energy stocks took the easy route and fell. The ARCA Oil & Gas Index (XOI) was down 2.3% while the TSX Energy Index (TEN) dropped 4.2%. WTI oil prices appear to be clinging to the uptrend line but a breakdown under $60 once again could see prices fall swiftly to the next support around $55/$56. We would need to regain back above $64 to suggest that prices could rise once again towards $70. As to the energy stocks, the XOI appears poised to fall further. A breakdown under 950 would send the index tumbling towards better support near 900.
Some interesting forecasts. Goldman Sachs is predicting that oil demand will peak in 2026 while BP PLC believes that demand has already peaked. The International Energy Agency (IEA) goes out a little further and says demand will peak in 2030. No matter. What all of this suggests is the oil industry will continue to falter as it gives way to increasingly clean energy as the world works towards a global zero-emissions economy. The U.S. is planning on trying to cut emissions by 50–52% by 2030 while Canada has boosted its 30% reduction target to 40–45%. Japan raised its target to 46% from 26%. China is also seeking to cut its emissions and is already in the process of phasing out coal consumption. We also read that 12 U.S. states are calling on the U.S. federal government to ban the sale of gasoline-powered vehicles by 2035.
None of this bodes bullish for oil prices into the future. Downside risks would appear to outweigh the upside.
—
(Featured image by OTA Photos CC BY-SA 2.0 via Flickr)
DISCLAIMER: This article was written by a third party contributor and does not reflect the opinion of Born2Invest, its management, staff or its associates. Please review our disclaimer for more information.
This article may include forward-looking statements. These forward-looking statements generally are identified by the words “believe,” “project,” “estimate,” “become,” “plan,” “will,” and similar expressions. These forward-looking statements involve known and unknown risks as well as uncertainties, including those discussed in the following cautionary statements and elsewhere in this article and on this site. Although the Company may believe that its expectations are based on reasonable assumptions, the actual results that the Company may achieve may differ materially from any forward-looking statements, which reflect the opinions of the management of the Company only as of the date hereof. Additionally, please make sure to read these important disclosures.
David Chapman is not a registered advisory service and is not an exempt market dealer (EMD) nor a licensed financial advisor. We do not and cannot give individualised market advice. David Chapman has worked in the financial industry for over 40 years including large financial corporations, banks, and investment dealers. The information in this newsletter is intended only for informational and educational purposes. It should not be considered a solicitation of an offer or sale of any security. Every effort is made to provide accurate and complete information. However, we cannot guarantee that there will be no errors. We make no claims, promises or guarantees about the accuracy, completeness, or adequacy of the contents of this commentary and expressly disclaim liability for errors and omissions in the contents of this commentary. David Chapman will always use his best efforts to ensure the accuracy and timeliness of all information. The reader assumes all risk when trading in securities and David Chapman advises consulting a licensed professional financial advisor before proceeding with any trade or idea presented in this newsletter. David Chapman may own shares in companies mentioned in this newsletter. We share our ideas and opinions for informational and educational purposes only and expect the reader to perform due diligence before considering a position in any security. That includes consulting with your own licensed professional financial advisor.


The TopRanked.io Weekly Affiliate Marketing Digest [The Top VPN Affiliate Programs Roundup]
Want to be let in on a little secret about two massive affiliate opportunities you can take advantage of today?...


Sustainable Finance Faces Hurdles as Green Asset Ratio Reforms Fall Short of Full Transparency
The Green Asset Ratio (GAR) measures banks' alignment with the EU Taxonomy but remains low due to methodological flaws and...


XRP Hits New All-Time High Amid U.S. Crypto Policy Shift and Ripple’s Expansion
XRP surged past its 2018 all-time high, reaching $3.65 amid renewed political support for crypto in the U.S. under Trump....


Germany Moves to Curb Medical Cannabis Abuse, Sparking Access Concerns
Medical cannabis imports in Germany have surged, but health insurance-covered prescriptions remain low. Easy online access raises concerns about abuse...


JPMorgan’s Data Fees Shake Fintech: PayPal Takes a Hit
JPMorgan Chase will charge fintechs for customer data, threatening business models reliant on free access. PayPal’s stock plunged 5.7% after...
 |
|
 |  |
 |
|
-

 Africa3 days ago
Surging Expenditures Widen Morocco’s Budget Deficit Despite Revenue Growth
-

 Markets2 weeks ago
Soybean Market Reacts to Trade Hopes, High Stocks, and Global Price Pressure
-
 Cannabis12 hours ago
Germany Moves to Curb Medical Cannabis Abuse, Sparking Access Concerns
-

 Cannabis1 week ago
Switzerland Advances Cannabis Legalization with Public Health Focus