Featured
Stock Markets Are Still Rising but There Are Some Divergences
The stock market rally continues. However, we warn this is a bear market rally even as we could return to the 2022 high. Big week ahead with the FOMC and ECB rate hikes along with the U.S. January jobs report on Friday. Expectation now is 25 bp for the Fed and 50 bp for the ECB. Watch for hints that the Fed will pause after maybe one more hike. Jobs are expected to be reported lower.

As was expected by many, the Bank of Canada (BofC) hiked its bank rate 25 bp to 4.5%. If there was a surprise, it was the BofC indicating that they expect to hold off on further rate hikes. That makes Canada the first to signal that they may be ending rate hikes and precluding any further monetary tightening. At 4.5%, it is the highest level since 2007 but it also leaves the bank rate 1.8% below the most recent rate of inflation. Note how during the 1970s the bank rate was hiked above the rate of inflation in order to bring it down. After that, the rate of inflation remained below the bank rate until the 2000s. Ever since then the rate of inflation has, for the most part, exceeded the bank rate.
Bank of Canada Rate vs. Canada’s Inflation Rate
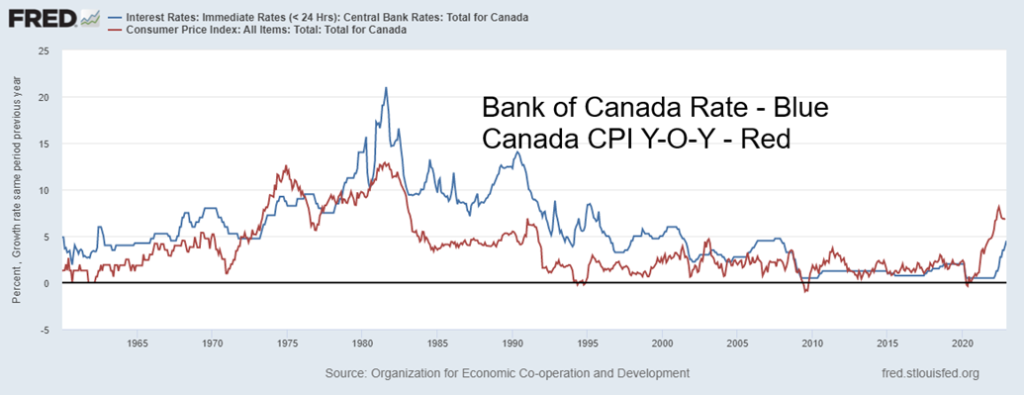
The banks, along with many economists, expect the economy to only stall in 2023, although many expect housing prices to fall further. A recession, yes, but only a mild one. That expectation is prevalent in the U.S. and elsewhere as well. But will it be only a mild recession? That’s still to be determined. There are, of course, some who are expecting a deeper recession. The wide expectation is also that Canadian inflation will moderate to about 3%. As we noted, in the 1970s it took a bank rate above the rate of inflation, along with a steep recession, to eventually bring down the inflation rate. We are not there yet. This is closer to how they responded to first round of inflation in the 1970s. They hiked rates but not above the rate of inflation. Yes, inflation came down. But, after a respite, inflation surged again to even higher levels, prompting the Volcker response that brought down the rate of inflation but also triggered the deepest recession 1980–1983 since the Great Depression.
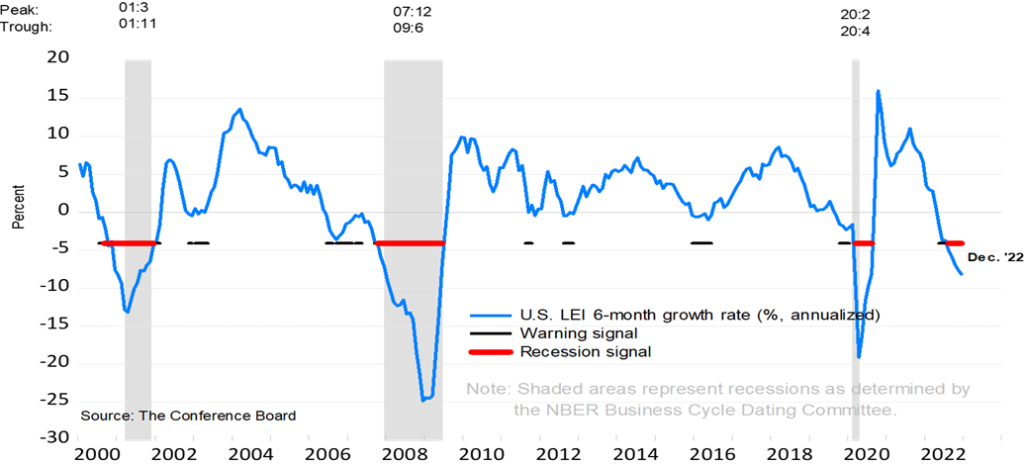
That a recession is coming is not in doubt. The question is, how steep will it be? Due to our limited ability to research statistics, our main sources of information are readily accessible sources like the Federal Reserve, the Bank of Canada, Statistics Canada, and Trading Economics. We approach things more as an observer and from our experience in markets over a 50-year-plus career in the securities industry. In terms of predicting a recession, there are two main indicators we look at. Both have historically been excellent indicators in terms of predicting a recession, but not necessarily in determining how deep it will be. Two excellent indicators are the Conference Board’s Leading Economic Indicator (LEI) and the treasury yield spreads of the 2-year treasury vs. the 10-year treasury and the 3-month treasury bill vs. the 10-year treasury.
Conference Board’s Leading Economic Indicators
Treasury Yield Spreads – 2-yr vs 10 yr and 3-mth vs 10 yr
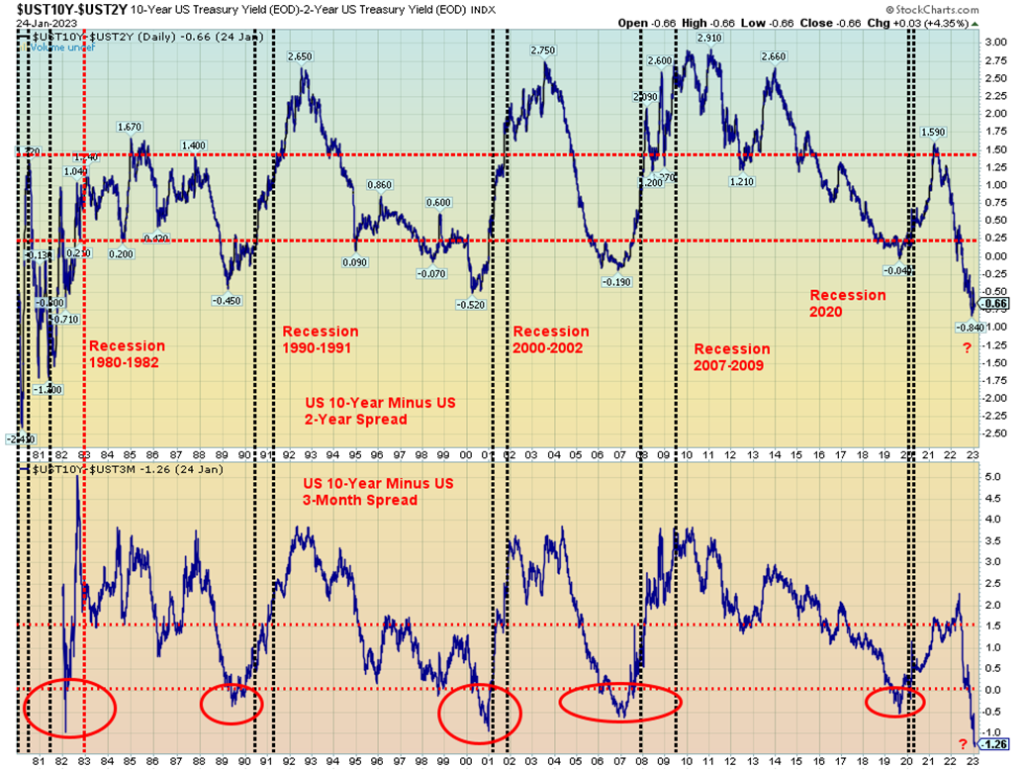
One thing we note for both charts is that the signals that the economy could enter a recession are generally seen long before a recession actually gets underway. Only the very unexpected pandemic recession of 2020 saw the LEI mostly coincide with the start of the recession. As for the interest rate spreads, the recession does not get underway until the yield curve begins to normalize. The trough for the spreads generally occurred on average since the late 1970s, an average of almost 12 months before the recession was officially underway. The range was 3 months to 24 months. By that definition, a recession could officially be underway by March 2023, as late as December 2024, or on average by December 2023.
The economy tends to slide into a recession sometime after the Fed starts to pause. We’ll learn next week whether the Fed follows the lead of the BofC with only a 25 bp hike in the Fed rate and a hint that they may pause. Markets tend to act positively to a pause in rate hikes. But the actual trough of the stock market doesn’t usually occur until much later until the recession is well underway or is over.
| Recession Officially Starts | Fed Funds Peak | Differential Start of Recession vs. Fed Funds Peak (Before/After) | Recession Officially Ended | Stock Market Trough | Differential End of Recession vs. Stock Market Trough (Before/After) |
| November 1973 | July 1974 | 8 mths | March 1975 | December 1974 | 3 mths |
| January 1980 | April 1980 | 3 mths | July 1980 | March 1980 | 4 mths |
| July 1981 | January 1981 | 6 mths | November 1982 | August 1982 | 3 mths |
| July 1990 | April 1989 | 15 mths | March 1991 | October 1990 | 5 mths |
| March 2001 | August 2000 | 8 mths | November 2001 | October 2002 | 11 mths |
| December 2007 | June 2007 | 6 mths | June 2009 | March 2009 | 3 mths |
| February 2020 | April 2019 | 10 mths | April 2020 | March 2020 | 1 mth |
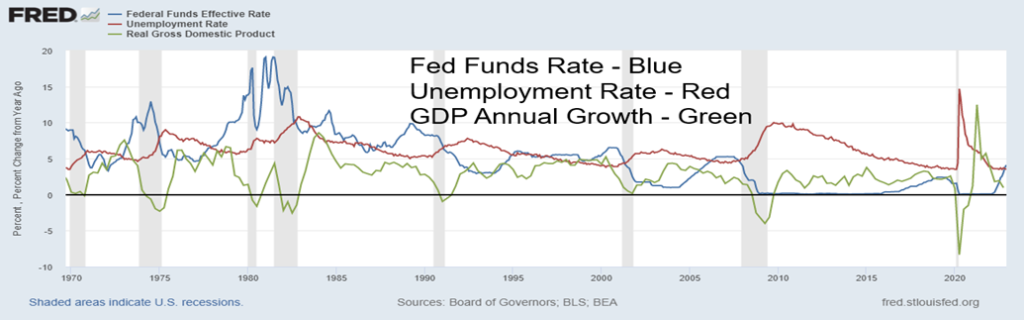
Do we have any sign of a recession? Yes, some indicators are slowing but key indicators like unemployment and the GDP are holding up. The most recent advance GDP Q4 saw the U.S. economy grow at a rate of 2.9% annualized. That was above the expected 2.6% growth rate. However, looking underneath the numbers, a big chunk of it was inventory buildup. With retail sales weakening, will that inventory be sold? Or could we face a weak Q1 2023? Note in the chart below that GDP growth tends to bottom late in the recession and the unemployment rate tends to peak after the recession is over. Unemployment doesn’t really begin to rise until the recession is underway. While GDP growth is slowing before the recession starts.
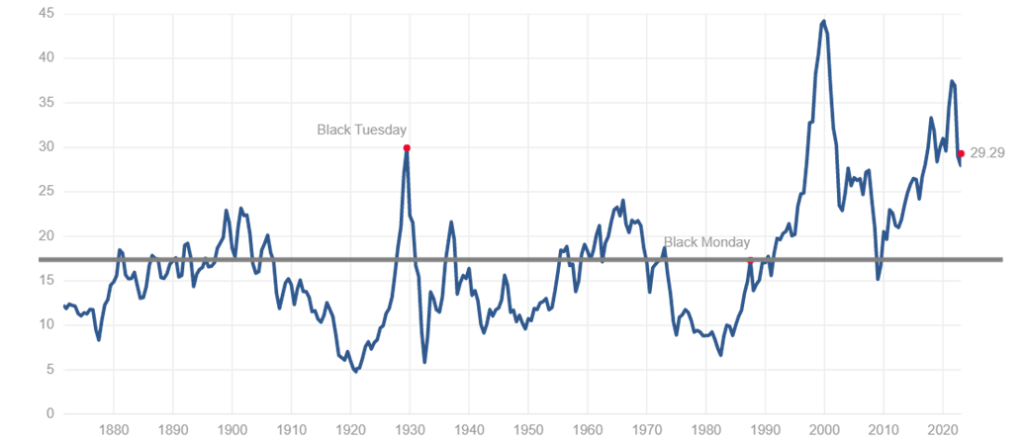
By many measurements, the stock market is still overvalued. The Shiller PE Ratio at 29.29 is still well above its long-term mean of 17. That suggests that the PE ratio may have further to fall. That huge spike was the peak in December 1999 before the onslaught of the dot.com crash. The peak before the 2007–2009 financial crisis crash was well below the dot.com peak. The most recent peak was still below the dot.com peak but was the second highest on record. Depending on the steepness of the recession, it could fall below the mean. But if the predictions of a shallow recession hold, then it may not reach the mean. Even the S&P 500 PE ratio, currently at 20.97, is above its long-term mean of 15.99. That PE ratio hit its peak in May 2009 before falling sharply.
Shiller PE Ratio 1875–2023
The result of all of this is, we believe, the current rebound underway is a bear-market rally, or what some might call a sucker’s rally. The stock market doesn’t normally bottom until either just before or after the recession is declared over and, given the recession is not yet officially underway, it suggests we have months to go before we’ll see a stock market trough and a potential PE ratio below the mean. Economist David Rosenberg (www.rosenbergresearch.com) notes that, on average, the stock market trough doesn’t come until 16 months after the Fed starts to pause. In other words, the stock market may not start a more sustained rally until the economy is swinging into recovery after the end of the recession. As well, the normalization of the yield curve would also be well underway.
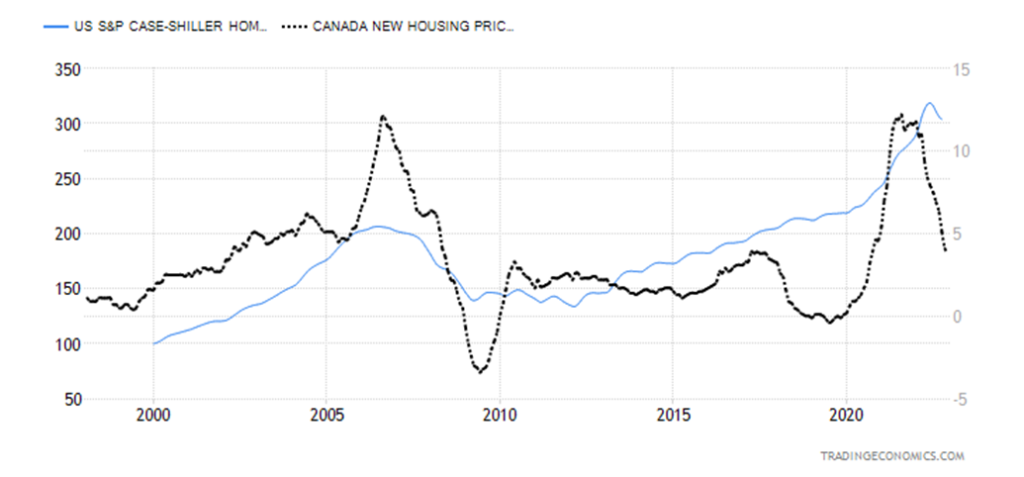
All of this suggests that we have yet to see the worst effects of inflation and rate hikes. We’ve still had no major defaults. Yet there are numerous sovereigns that are either bankrupt or on the verge of default and bankruptcy. Some thirteen countries have an S&P rating of CCC (junk status) or lower or are not even rated. Familiar names are Argentina, Ethiopia, Pakistan, the Republic of Congo, Ukraine, Venezuela, Lebanon, and Russia (already forced into default even as they could easily pay). Many others, too numerous to list or count, are rated below the investment grade of BBB. Numerous corporations are rated below BBB and a large number are rated BBB and could fall further if a recession hits. We have noted the zombie companies of Japan and China in its property sector. (Zombie companies are those still functioning that should have been declared bankrupt long ago.) The housing index for both Canada and the U.S. has been falling for months. The worst, many suspect, is still to come in what was a very overvalued housing market, particularly in Canada. As they say, everything eventually reverts to the mean. We are still well above that. In the U.S. a downturn in the housing market is just getting underway.
U.S. Case Shiller Home Price, Canada New Housing Price 1997–2022
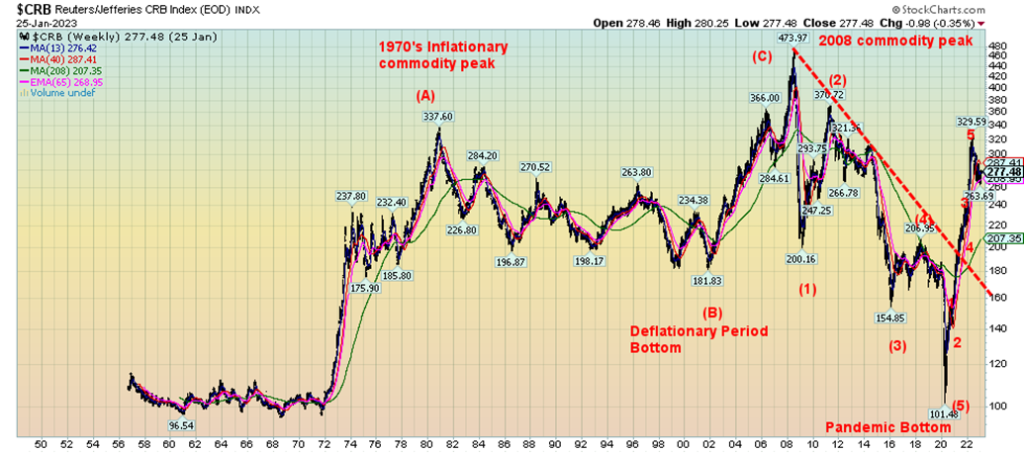
It is also unlikely that commodity prices have topped. Since starting to rise out of the depths of the pandemic recession in 2020, the CRB Index has nearly tripled. The recent pause is a correction within the context of a new bull market in commodities. This is not dissimilar to what we saw in the inflationary 1970s and the emergence of China and the commodities boom of the 2000s. So far, we believe the first leg up is complete and the current pullback is the correction. A third wave or C wave up is to come. This should be good for gold in particular as it peaked in 1980 during the inflationary boom and again in 2011 after the commodity peak of 2008.
CRB Index 1956–2023
There are wildcards as well. Two in particular—climate-related disasters, which caused over $300 billion in insured damages in 2022 and displaced millions, and the potential for World War III between the U.S./NATO and Russia that would no doubt draw in many other players, including China. There are some interesting hot spots worth keeping an eye on as anyone of them of could erupt into something broader. Ones we see are Serbia/Kosovo (yes, the Balkans again where WW1 started), Azerbaijan/Armenia/Nagorno-Karabakh, and Iran/Israel as well as the growing Israeli/Palestinian conflict. We live in difficult times.
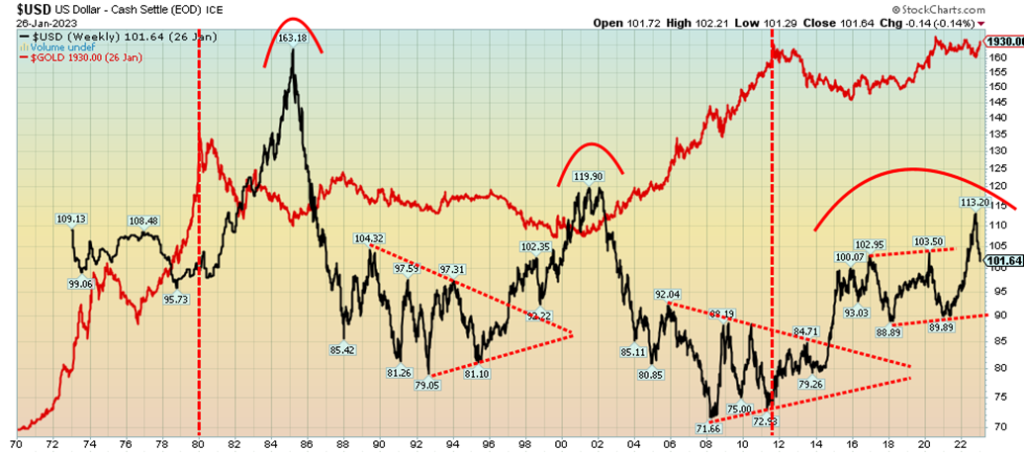
US$ Index 1970–2023
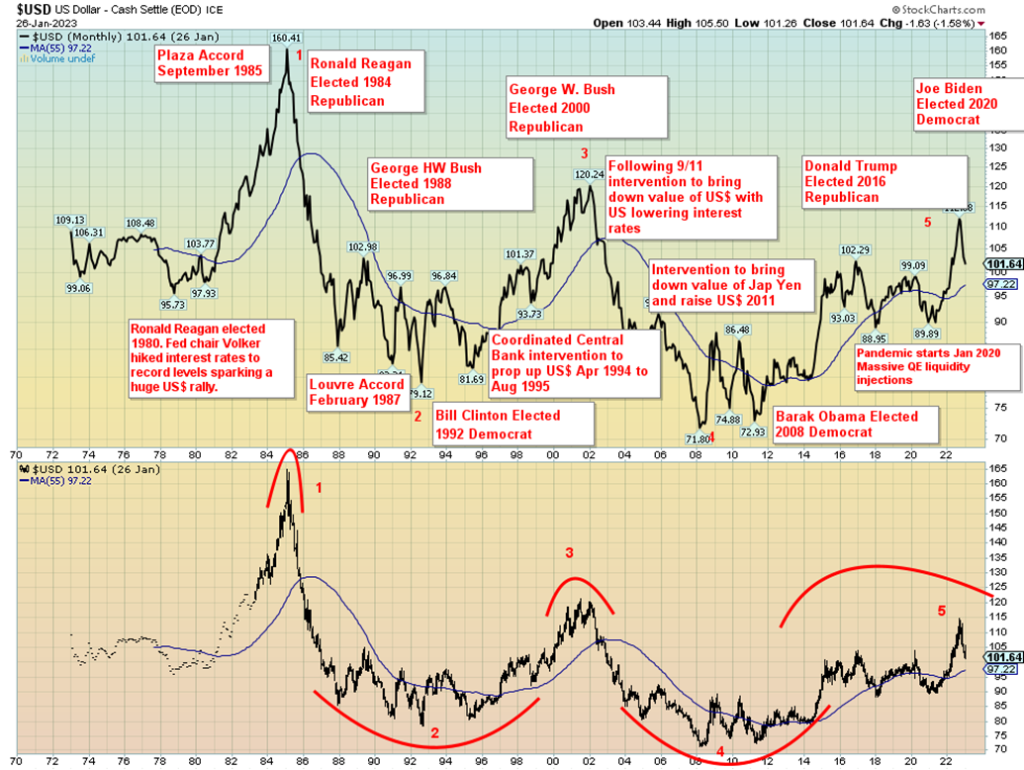
Ever since the world came off the gold standard in August 1971, originally set by the 1944 Bretton Woods agreement of gold at $35/ounce, and unleashed the world of fiat currencies (currencies with no value except what governments say they are worth) in 1973, we have witnessed wild gyrations—not just in the U.S. dollar but in a wide range of currencies. Our chart of the US$ Index (USDX) shows the wild gyrations seen over the past fifty-plus years. If you used the word roller-coaster, you wouldn’t be wrong.
In looking at the chart above, two things stand out. First, when the USDX tops, the downward swing is swift and persistent. A spike top or something close to one appears normal. Second, bottoms take years to form. That first bottom lasted from roughly December 1987 to December 1996. The second long bottom lasted from November 2004 to May 2014. The question on everyone’s mind now is, has the USDX topped?
Rising inflation and the Fed embarking on interest rate hikes were the prime reason for the sharp rise in the USDX from the low in June 2021. The Fed embarked on hiking rates in March 2022. Since then, they have hiked the rate seven times from effectively zero to the current 4.5%. Now the Fed is expected to slow the rate of increase. This coming week is the FOMC, where the Fed is expected to raise rates only 25 bp. Will they hint at a slowing or pausing of rate hikes as did the BofC this past week?
Inflation, which hit a low of 0.2% at the height of the pandemic in May 2020, rose steadily to a peak of nearly 9% in June 2022. Since then, it has slowed to 6.4% in December. Supply disruptions because of COVID, the outbreak of war in Ukraine in February 2022, lockdowns in China over COVID, and food supply disruptions sparked by droughts in numerous crop-growing countries were largely behind the inflation and the subsequent rise in interest rates.
But with the suspicion that the Fed is nearing the end of its rate hikes and signs that the U.S. economy could be slowing (despite still strong employment and GDP reports), the USDX has most likely topped out. The looming debt limit crisis is also playing a role in weakening the USDX. The USDX tends to top out before the Fed pauses. There is no thought at this time that the Fed would cut interest rates. That is not expected in 2023.
Gold and the USDX have a largely inverse relation with each other. Despite the gold standard ending nearly 52 years ago, there remains a strong tie between gold and the USDX. Note how gold appears to top as the USDX bottoms. It is no surprise that gold’s most recent bottom in November wasn’t far off from the USDX top in September. Gold made a series of lows during September, October, and November 2022, coinciding with highs in the USDX.
Markets & Trends
| % Gains (Losses) Trends | ||||||||
| Close Dec 31/22 | Close Jan 27/23 | Week | YTD | Daily (Short Term) | Weekly (Intermediate) | Monthly (Long Term) | ||
| Stock Market Indices | ||||||||
| `S&P 500 | 3,839.50 | 4,070.56 | 2.5% | 6.0% | up | up | up (weak) | |
| Dow Jones Industrials | 33,147.25 | 33,978.08 | 1.8% | 2.5% | up | up | up | |
| Dow Jones Transport | 13,391.91 | 14,486.33 | (0.4)% | 8.2% | up | up | up (weak) | |
| NASDAQ | 10,466.48 | 11,621.71 | 4.3% | 11.0% | up | neutral | down (weak) | |
| S&P/TSX Composite | 19,384.92 | 20,714.48 | 1.0% | 6.9% | up | up | up (weak) | |
| S&P/TSX Venture (CDNX) | 570.27 | 622.01 | (0.3)% | 9.1% | up | neutral | down | |
| S&P 600 (small) | 1,157.53 | 1,248.59 | 2.1% | 7.9% | up | up | up (weak) | |
| MSCI World Index | 1,977.74 | 2,128.22 | 1.8% | 7.6% | up | up | neutral | |
| Bitcoin | 16,535.23 | 23,012.09 | 8.7% | 39.2% | up | neutral | down (weak) | |
| Gold Mining Stock Indices | ||||||||
| Gold Bugs Index (HUI) | 229.75 | 258.64 | (0.1)% | 12.6% | up | up | neutral | |
| TSX Gold Index (TGD) | 277.68 | 306.69 | (0.3)% | 10.5% | up | up | neutral | |
| % | ||||||||
| U.S. 10-Year Treasury Bond yield | 3.88% | 3.51% | 0.9% | (9.5)% | ||||
| Cdn. 10-Year Bond CGB yield | 3.29% | 2.90% | 1.8% | (11.9)% | ||||
| Recession Watch Spreads | ||||||||
| U.S. 2-year 10-year Treasury spread | (0.55)% | (0.70)% | flat | (27.7)% | ||||
| Cdn 2-year 10-year CGB spread | (0.76)% | (0.80)% | (6.7)% | (5.3)% | ||||
| Currencies | ||||||||
| US$ Index | 103.27 | 101.72 | (0.1)% | (1.5)% | down | down | up | |
| Canadian $ | 73.92 | 75.20 | 0.6% | 1.7% | up | down (weak) | down | |
| Euro | 107.04 | 108.67 | 0.1% | 1.5% | up | up | down | |
| Swiss Franc | 108.15 | 108.55 | (0.1)% | 0.4% | up | up | neutral | |
| British Pound | 120.96 | 123.98 | flat | 2.5% | up | up | down | |
| Japanese Yen | 76.27 | 77.03 | (0.2)% | 1.0% | up | up | down | |
| Precious Metals | ||||||||
| Gold | 1,826.20 | 1,929.40 | 0.1% | 5.7% | up | up | up | |
| Silver | 24.04 | 23.62 | (1.3)% | (1.8)% | up | up | up (weak) | |
| Platinum | 1,082.90 | 1,016.80 | (3.0)% | (6.1)% | down | up | up | |
| Base Metals | ||||||||
| Palladium | 1,798.00 | 1,599.70 | (7.2)% | (11.0)% | down | down | down | |
| Copper | 3.81 | 4.22 | (0.8)% | 10.8% | up | up | up (weak) | |
| Energy | ||||||||
| WTI Oil | 80.26 | 79.68 | (2.4)% | (0.7)% | up | down | up (weak) | |
| Nat Gas | 4.48 | 2.85 (new lows) | (17.2)% | (27.4)% | down | down | down (weak) | |
New highs/lows refer to new 52-week highs/lows and, in some cases, all-time highs.
Stock markets continued their winning ways in January. Given we only have two days left in the month, barring an utter disaster stock markets appear to be headed for an up month. According to the January barometer, that bodes well for the year. We note that the word once again appears to be “risk on” as risk assets are bought, with Bitcoin and the NASDAQ (FAANGs) leading the way. But not to get too far ahead of ourselves, we also noted in earlier write-ups that, while the January barometer has an excellent track record since 1950, since 2000 the barometer has seen its accuracy of predicting the year drop from 83% to 60%. Most of the misses have occurred since 2000. So, we shouldn’t go out and celebrate just yet. Things could change and the risks are there and known. However, even we know a “black swan” event could come out of nowhere. February is known as the weak link in the “best six months – November to April. As they say, buy when it snows, sell when it goes.
This past week the S&P 500 gained 2.5%, the Dow Jones Industrials (DJI) was up 1.8%, but the Dow Jones Transportations (DJT) diverged, falling a small 0.4%. The NASDAQ was up 4.3%, the big winner on the week. The S&P 400 (MID) was up 2.4% while the S&P 600 (SMALL) was up 2.1%. Both are up almost 8% thus far in January vs. the S&P 500 up only 6%. Risk on. Bitcoin, the ultimate “risk on”, gained 8.8% and is now up 39.2% so far in 2023. Risk on!
In Canada, the TSX rose 1.0% but the TSX Venture Exchange (CDNX) was off 0.3%. Over in the EU, the London FTSE was off a small 0.1%, EuroNext gained 1.3%, the Paris CAC 40 made new 52-week highs, gaining 1.5%, while the German DAX was up 0.8%. In Asia, China’s Shanghai Index (SSEC) was closed for the Lunar New Year.
However, that didn’t seem to impact the Tokyo Nikkei Dow (TKN) as it gained 3.1%. Hong Kong didn’t pay attention either, as the Hang Seng (HSI) was up 2.8%. Speaking of the HSI, it is up 55% since its October 2022 low and is now very overbought. The MSCI World Index was up 1.8% this past week.
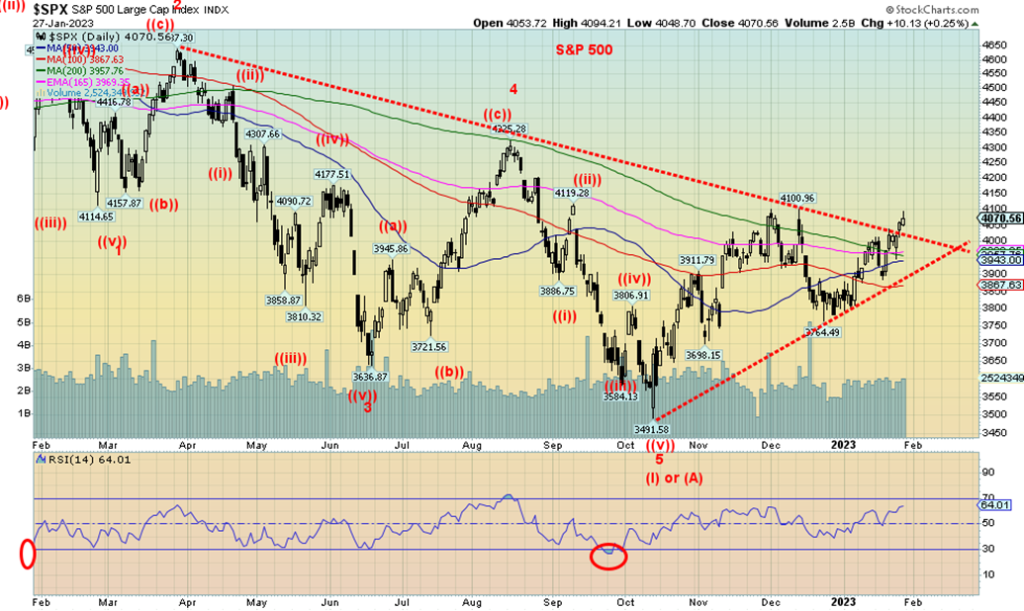
We continue to believe we are embarking on a corrective bear market rally. It is not the start of a new bull market. The big down wave of 2022 was a five-wave decline, telling us we are in a major bear market. The low in October signified the end of Wave A down of a bigger ABC corrective pattern that should play itself out over the next few years. If that was the A wave, we are now on the B wave up, a wave that could last several months. With the S&P 500 breaking out over its downtrend line, we may be on our next phase up. This wave could carry up to around 4,300/4,400. In a big move, we could even return to the 2022 high of 4,818. Naturally, that would drag in all the bulls and the bears would then spring the trap. There remain too many negatives out there to convince us we are off on a new bull market. The recession hasn’t even officially started and we noted that stock markets have a tendency to make their final bottom towards the end of the recession, not at the beginning. But bear market rallies can be lucrative. Just keep raising your stop. Danger doesn’t appear until we break back under 3,800. If we did, the rally is most likely over.
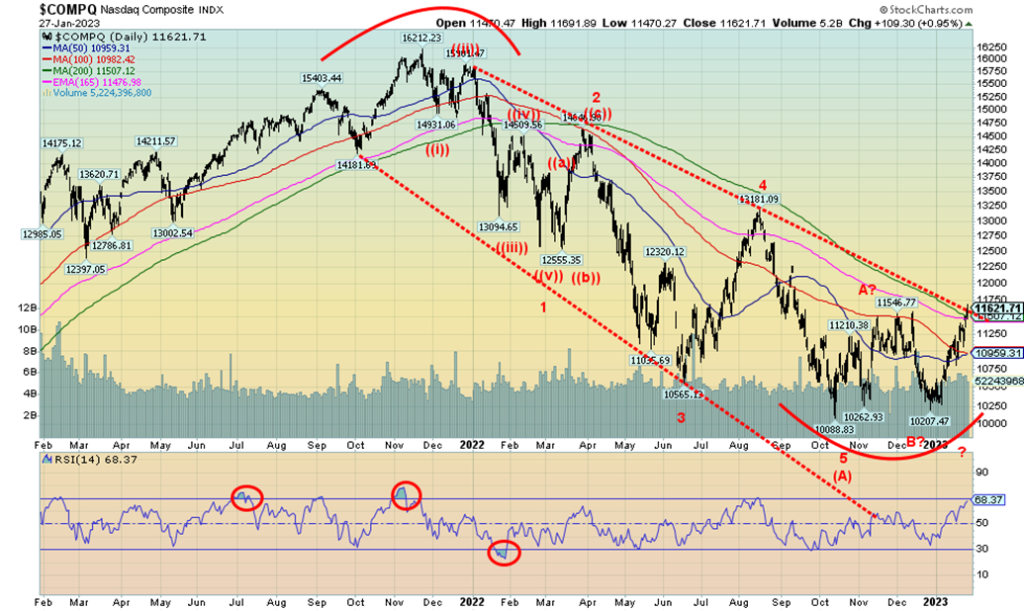
The NASDAQ had struggled since collapsing in 2022. But it now appears to be breaking out, or at least trying to. In 2022, the NASDAQ was the big loser of the major North American indices, off 33.1%. So far in 2023 it’s the big winner, up 11.0%—the old “Dogs of the Dow” theory that last year’s dog could turn into this year’s winner. With the NASDAQ leading the way, could it also be we are seeing a return to risk assets? Or, as we say, “risk on”? Bitcoin, up a big 39.2% so far in January, personifies “risk on”. The NASDAQ gained 4.3% this past week, again leading the way. The NY FANG Index was up 9.1%, again emphasizing “risk on”. The big FAANG winner was Tesla, jumping 33.3% (Musk must be jumping with joy again and maybe he’s taken back his spot as the richest man in the world). Nvidia was up 14.2%, while Meta jumped 8.9%. Maybe news that Donald Trump could be back on Facebook helped. The only FAANG loser was Alibaba, down 1.3%. The NASDAQ is now testing the 200-day MA and the downtrend line from the highs seen in late 2021. We noted the likelihood of five wave downs from that high bottoming in October at 10,088. If all that is correct, then we are in the ABC correction that could last a few months. It is possible waves A and B are complete and we are now embarking on the C wave up.
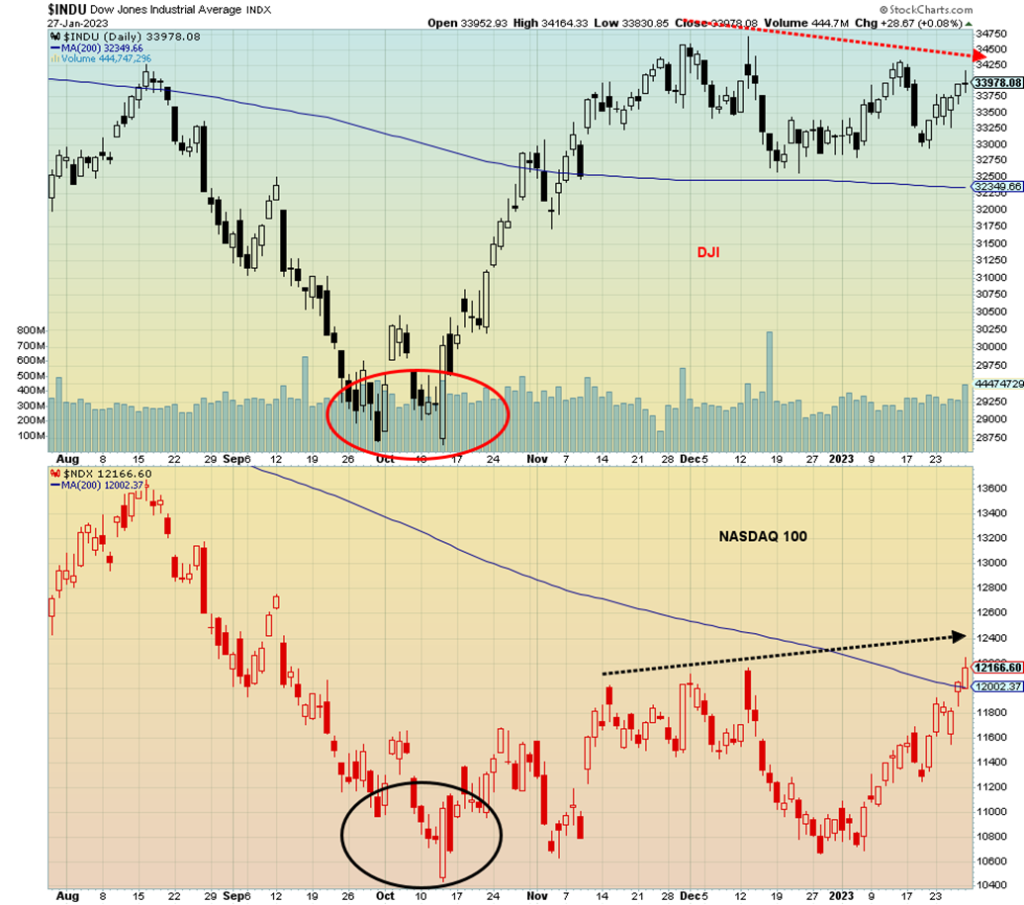
This may turn out to mean nothing, but we noted this week that the DJI was diverging with the NASDAQ 100 (NDX). It is also diverging with the broader NASDAQ. It’s not much right now and the DJI might still see new highs but, so far, we appear to be seeing the NDX break out. The DJI has already broken out, but is it slowing now in relation to the NDX? Normally divergences are compared between the DJI and the DJT, according to Dow Theory. But we thought it was at least something to note.
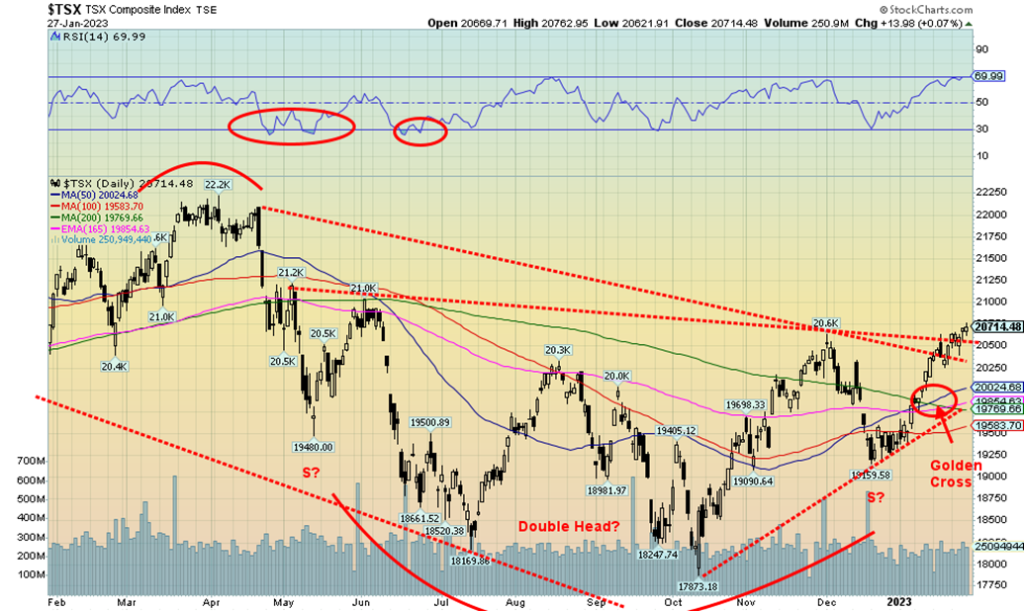
Could the TSX be breaking out? We appear to be wiggling over our resistance lines, down from the March/April highs and May high. Couple that with the golden cross signal we received earlier and the signs look positive. This past week the TSX Composite rose 1.0%. However, the TSX Venture Exchange (CDNX) dropped a small 0.3%. The sub-indices were quite mixed as six of the fourteen recorded losses while eight had gains. None of the losers was large, with the biggest drop seen by the TSX Industrials (TIN), off 1.1%. Utilities (TUT) fell 1.0%. Leading the gainers was Information Technology (TKK), up a healthy 6.2%. Health Care (THC) is rebounding and was up 4.0%. Both Real Estate (TRE) and Energy (TEN) gained 2.2%. Health Care (THC) is the big winner this month, up 17.2% so far. Grant you, THC was the big loser in 2022, falling a whopping 57.8%. Cannabis companies were the main drag on the index. The TSX is now up to 20,700. The next resistance zone is 21,000 to 21,200. Support is now down to 20,250, but we wouldn’t consider this rebound over until we broke back under 19,600. If this is, as we suspect, the C wave of an ABC correction, then this wave could take us to at least 22,000. That would be near the highs seen last March.
10-year Treasury Bond/Canadian 10-year Government Bond (CGB)
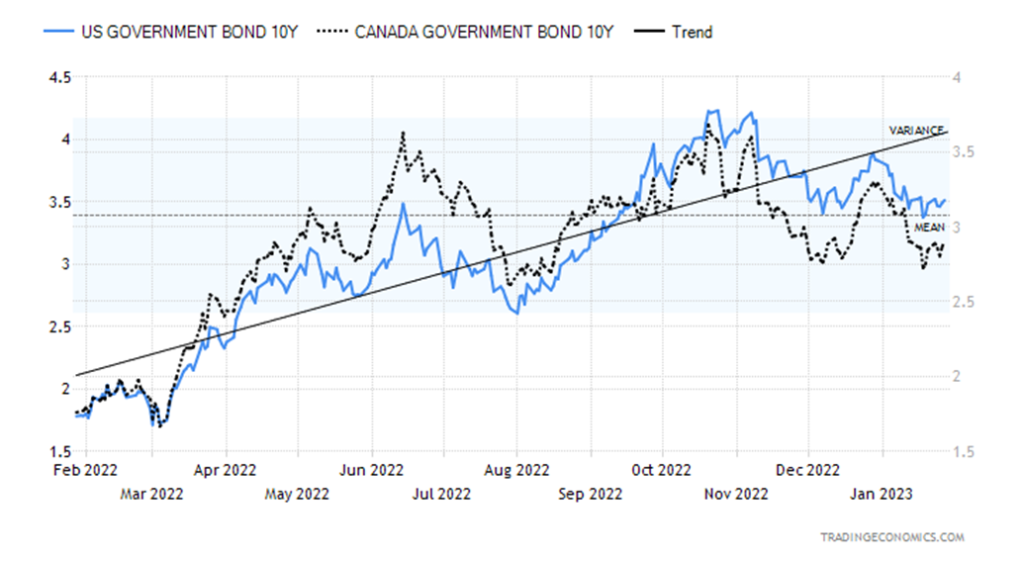
The stronger-than-expected Q4 advance GDP, coupled with stronger-than-expected weekly unemployment claims, helped push bond yields back up a bit this past week. The U.S. 10-year treasury note rose to 3.51% from 3.48% while the Canadian 10-year Government of Canada bond (CGB) was up to 2.90% from 2.85%. Our recession spreads of 2-year–10-year were negative 70 bp in the U.S. and negative 80 bp in Canada. A recession call is still on. We confess we’ve never seen the recession spreads so deep in negative territory. But, as we noted, the recession typically does not get underway until the yield curve begins to normalize once again.
There were continued weak economic numbers this past week, along with stronger economic numbers helping to give off mixed signals as to the direction of the economy. The S&P Global PMI was still in recession territory at 46.6, although that was better than the expected 45. The Richmond Fed Manufacturing Index was negative 11 when they actually expected plus 3. Building permits fell 1% in December, but that was better than the expected 1.6% decline. The Fed’s closely watched PCE prices saw a gain of 3.2% in Q4, just above the expected 3.1% gain. December PCE prices were up 5% year-over-year (y-o-y) vs. an expected gain of 5.1%. New home sales in December were up 2.3% when they expected a decline of 2%. Pending home sales rose 2.5%, once again defying an expected decline of 1%. But y-o-y they were down 33.8% when they expected a decline of only 25%. The Michigan Consumer Sentiment Index was stronger than expected at 64.9%, above the expected 64.6%, and December 59.7%. Consumer sentiment appears to be improving. Personal income for December was up 0.2% but personal spending fell 0.2%. They had expected personal income to be up 0.3% and personal spending to fall only 0.1%.
The big event this week is, of course, the FOMC where they are now expecting only a 25 bp hike in the Fed rate. The ECB also meets and is expected to hike 50 bp plus another 50 bp in March, eventually taking the ECB rate to 4% by June. The home price indices are also out this coming week. But the second big event of the week is next Friday, February 3, with the release of the January job numbers. They are looking for a gain of 185,000 nonfarm payrolls and the unemployment rate to rise slightly to 3.6%. Canada won’t be releasing their employment numbers until the following week February 10.
We don’t see any big movement for interest rates one way or the other. Stronger numbers might help push rates slightly higher while weaker numbers could push it lower.
U.S. – M1, M2, Federal Reserve Balance Sheet
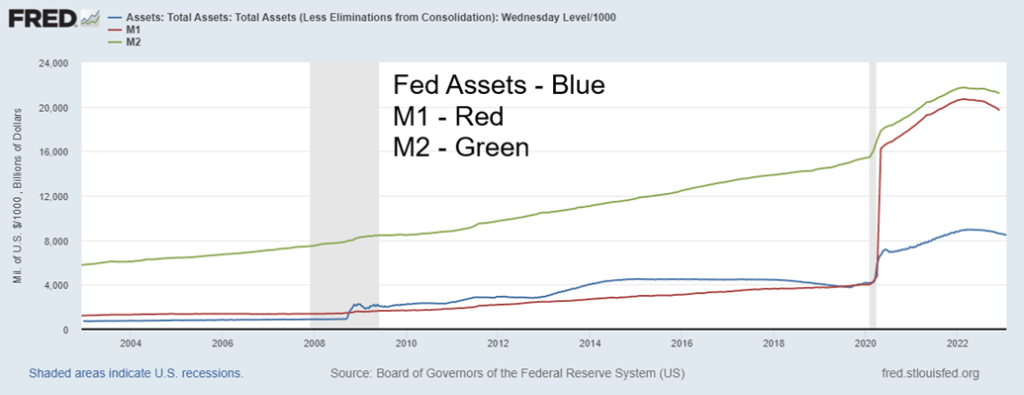
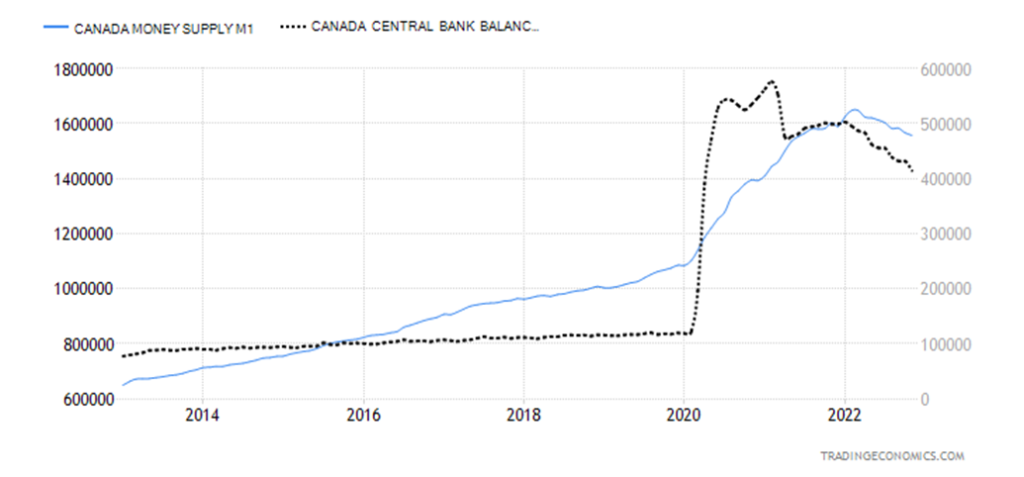
It should come as no surprise that quantitative tightening (QT) has resulted in a contraction of money supply and in the Fed’s balance sheet. The Fed started running down its balance sheet in June 2022 at the rate of $45 billion/month. They then upped it to $90 billion/month in September. The Fed’s balance sheet has since fallen by almost $500 billion. The BofC has also run down its balance sheet. It has fallen by almost $200 billion since peaking in early 2021.
Money supply is also falling. U.S. M1 money supply peaked in March 2022 and has since fallen over $1 trillion. M2 money supply has dropped by $532 billion. In Canada, M1 has fallen about $93 billion since peaking in February 2022 although M2 continues to expand, currently up to around $2.4 trillion. M2 expanding reflects a higher savings rate in Canada than in the U.S. The U.S. savings rate has fallen to almost a record low at 3.4% while Canada’s savings rate recently rose to 5.7%. The velocity of money both M1 and M2 has fallen to record lows. The velocity of money is a measurement as to how quickly money turns over in the economy. A high rate reflects fast turnover and a low rate reflects low turnover.
The current decline in money supply, along with the running down of the central bank’s balance sheet, has rarely been seen before. This is particularly true of money supply that is generally expanding. Declining money supply is usually seen during recessionary periods but the current decline is the sharpest we’ve seen. A falling money supply should eventually show up in the economy with a marked slowdown.
Canada – M1, Bank of Canada Balance Sheet 2013–2023
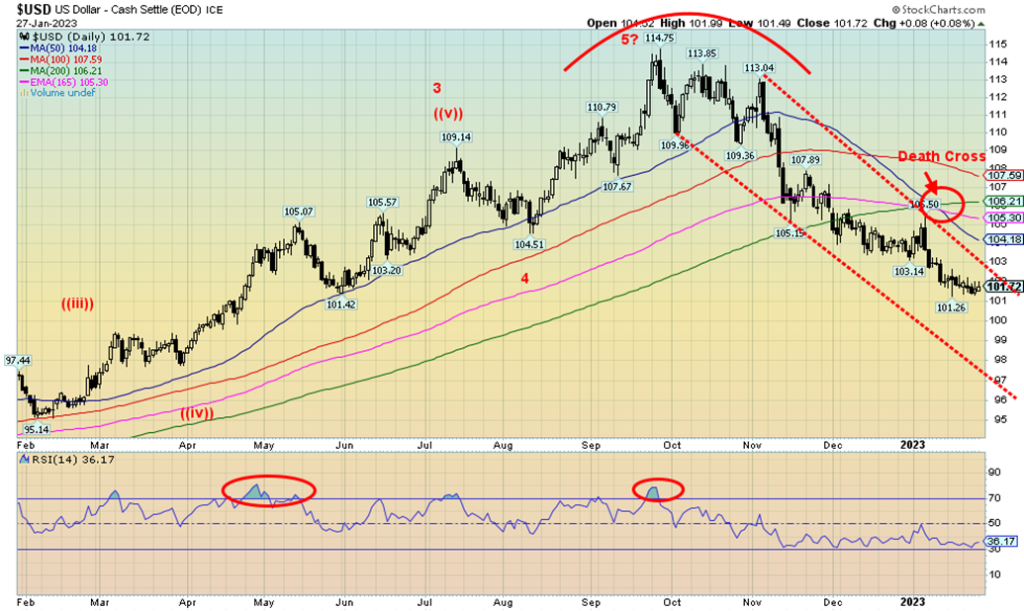
The US$ Index continued its downward drift this past week, losing a small 0.1%. The best performer on the week was the Canadian dollar as it jumped 0.6%. The euro was up 0.1%, the Swiss franc lost 0.1%, the pound sterling was flat, and the Japanese yen was down 0.2%. Outside of the Canadian dollar it was a pretty slow week for currencies. Maybe next week will get a better response with the FOMC rate hike. There is still no thought on when the US$ Index might find a low. We note the bottom of the channel is down near 97 and wave patterns suggest a potential drop to around 99/100 before a rebound might develop. The index has never become quite oversold and sentiment is weak, but not totally into ultra-fear. We note the death cross on the charts confirming the downtrend. We are working on what may be the C wave of an ABC down wave or it’s the third wave of a five-wave decline. We suspect the former, so that when this wave does find a bottom we should embark on a good rebound
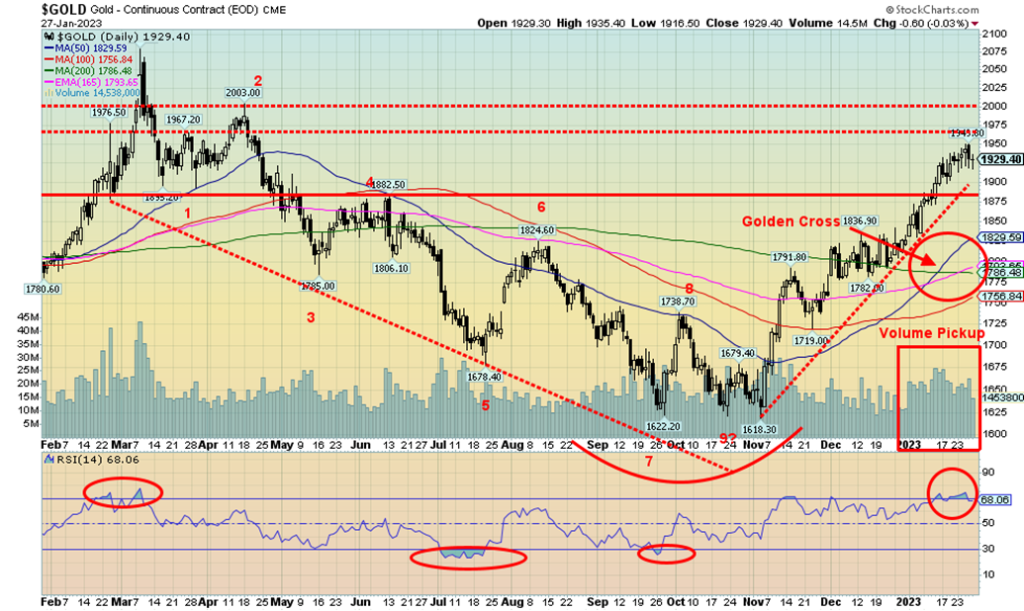
For the sixth consecutive week gold prices gained, this time a meagre 0.1%. Not much to get excited about. Silver diverged once again, down 1.3%, while platinum continued its recent bout of weakness, off almost 3%. Palladium is on the verge of a bear market as it lost 7.2%. Not even copper survived the onslaught on commodities as it fell 0.8%. The gold stocks generally held in with the Gold Bugs Index (HUI) off 0.1% and the TSX Gold Index (TGD) dropping 0.3%. The TSX Metals & Mining Index (TGM) was down a small 0.2%. We continue to see both bearish and bullish signs for gold. Gold has outperformed the others this month as it was up 5.7% so far. The gold stocks have also performed well, despite the recent pullback, as the HUI is up 12.6% and the TGD gained 10.5%. The TGM is up almost 11% so far this month while the TSX Materials Index (TMT) has gained 10.1%.
Gold rose this week despite some signs of recent strength in the GDP as well as continued underlying strength in the jobs markets. For gold and the markets, all eyes will be on the Fed this week. As noted, we are now expecting only a 25 bp hike. If that turns out to be correct, that could help gold and the stock market in general. Easing of inflation is also positive for gold.
As we note next, gold has been rising in a raft of currencies, even if the gains in U.S. dollars are not particularly strong. Eventually gold in U.S. dollars too will make new highs. Geopolitical uncertainty, wars, recession, debt limit are all things that could spur a move into gold. Gold is ultimately a hedge against political uncertainty.
Periods of sharply-rising gold prices as we saw in the 1970s and the early 2000s were also a period of political uncertainty and recessions. During the Great Depression, gold was revalued up against the U.S. dollar and gold stocks were strong performers, even as the stock market was collapsing. All were periods of political unrest along with recessions. Gold needs to break through the $1,950/$1,975 resistance zone next to convince us we are going higher. Over $1,975 suggests the potential for new highs over the August 2020 high of $2,089. A break now under $1,900/$1,920 would be negative. Under $1,875 would suggest the rally is over. Daily sentiment remains high, but it can stay that way for some time. If the daily sentiment were soaring on gold, silver, and the gold stocks, we’d be more inclined to suggest that the rally could be over. But they are not. So, while there is high sentiment, we don’t believe we’ve seen the top just yet.
Gold in Various Currencies 1998–2023
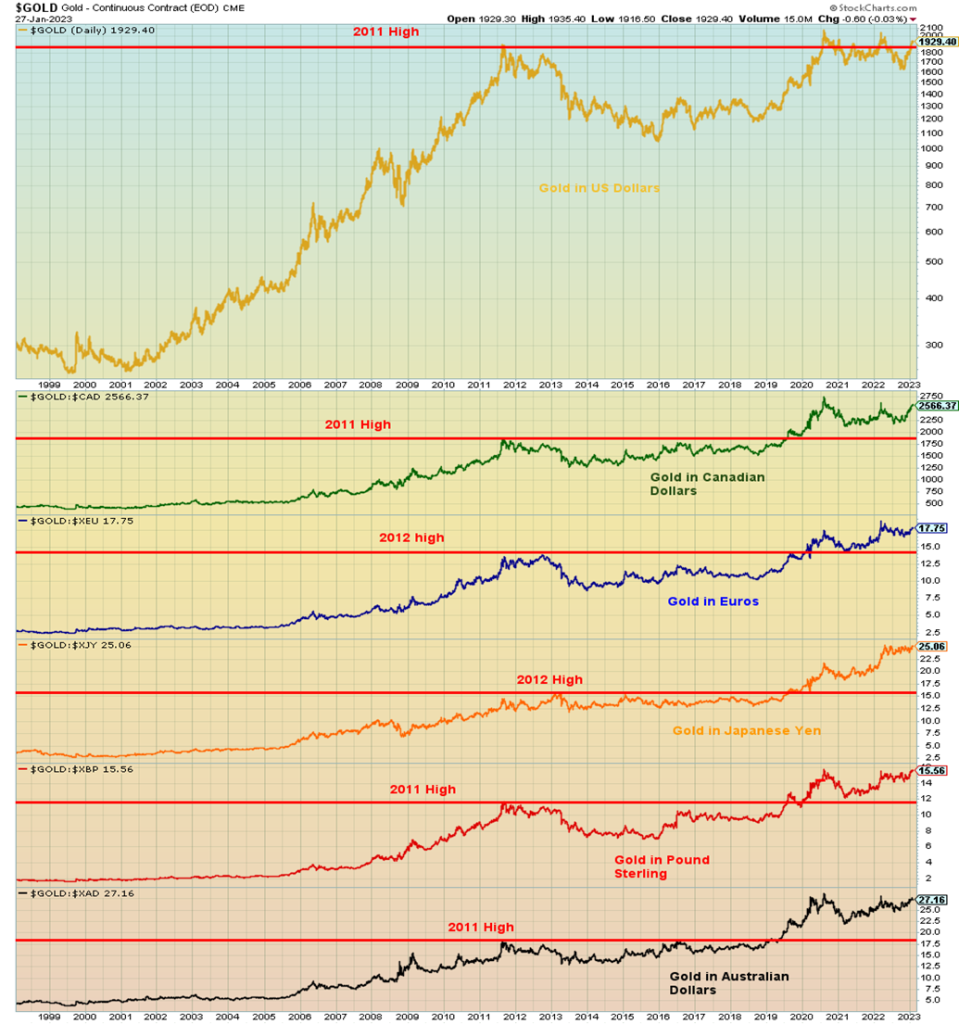
Our chart of gold in various currencies shows that many of them have not only exceeded their 2011/2012 highs, but many are already at fresh all-time highs. In hosts of other currencies, the gain for gold in those currencies is even more pronounced. A summary below shows the percentage gain or loss gold has experienced in the currency since those 2011/2012 highs:
- U.S. dollars +0.3%
- Canadian dollars +34.7%
- Euros +27.4%
- Japanese yen +58.1%
- Pound sterling +28.9%
- Australian dollars +47.5%
As noted, gold in U.S. dollars has been the weakest, due mostly to the U.S. dollar being the strongest currency as well as the world’s reserve currency. That gold in a host of other currencies is making new highs or is near new highs suggests that gold in U.S. dollars will eventually make new highs as well. A good strong move above $1,975 will now suggest to us that new highs for gold are quite likely.
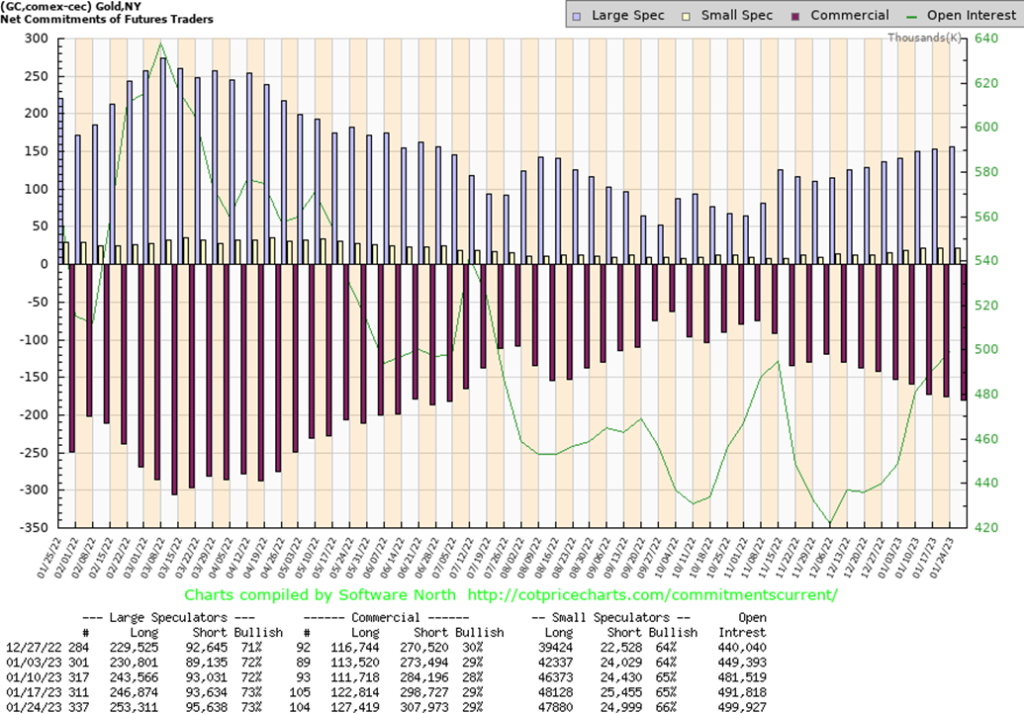
The gold commercial COT (bullion companies and banks) was unchanged this past week at 29%. However, we do note that long open interest rose almost 5,000 contracts, but then short open interest also was up by roughly 9,000 contracts. The large speculators COT (hedge funds, managed futures, etc.) was also unchanged at 73%. Again, long open interest rose by around 7,000 contracts while short open interest was also up but only about 2,000 contracts. Overall, open interest expanded by roughly 8,000 contracts as gold rose. We continue to view the COT as positive for gold going forward.
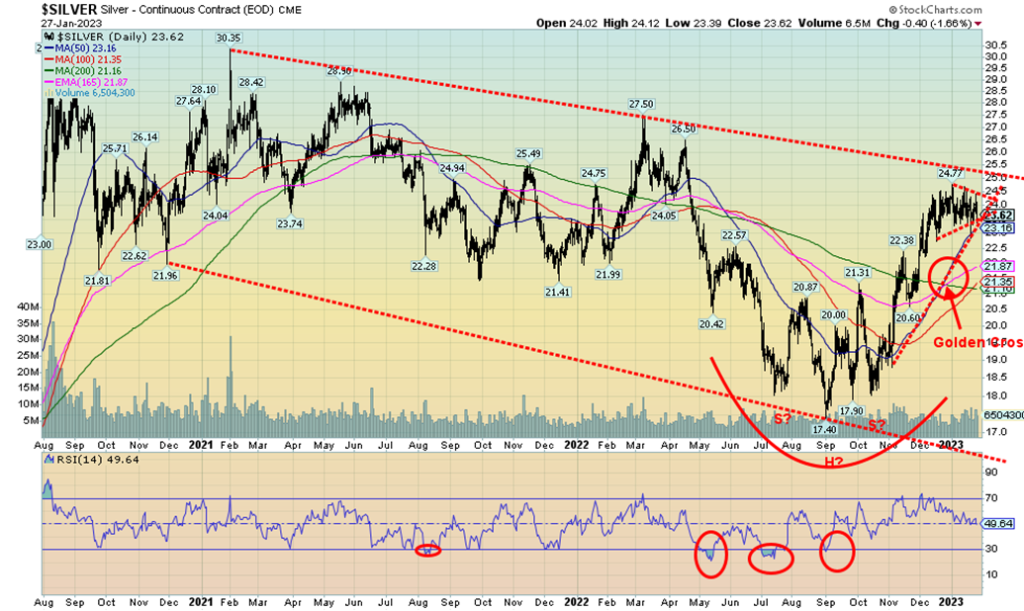
Silver continues to consolidate in what appears to us as a bull pennant or flag. However, we emphasize that this one could go either way. A break above $24.50 would be positive and a break above $25 would confirm a breakout. On the other hand, a breakdown now below $23 would be negative. Under $22.50 it would be a confirmation of a potential breakdown ahead. Silver is struggling to gain any traction. Our ongoing divergence with gold remains as a major concern. Gold has seen new highs for this move; however, silver has not, despite consolidation over the past two weeks. Gold has been up the past two weeks while silver is off small each of the past two weeks. The longer these divergences persist, the more likely that our next move is down, not up as many expect. We remain hopeful that the break for silver will be to the upside. We’d feel better as well if silver could take out $25 and stay above that point. We do have a golden cross in place which is supportive of silver moving higher.
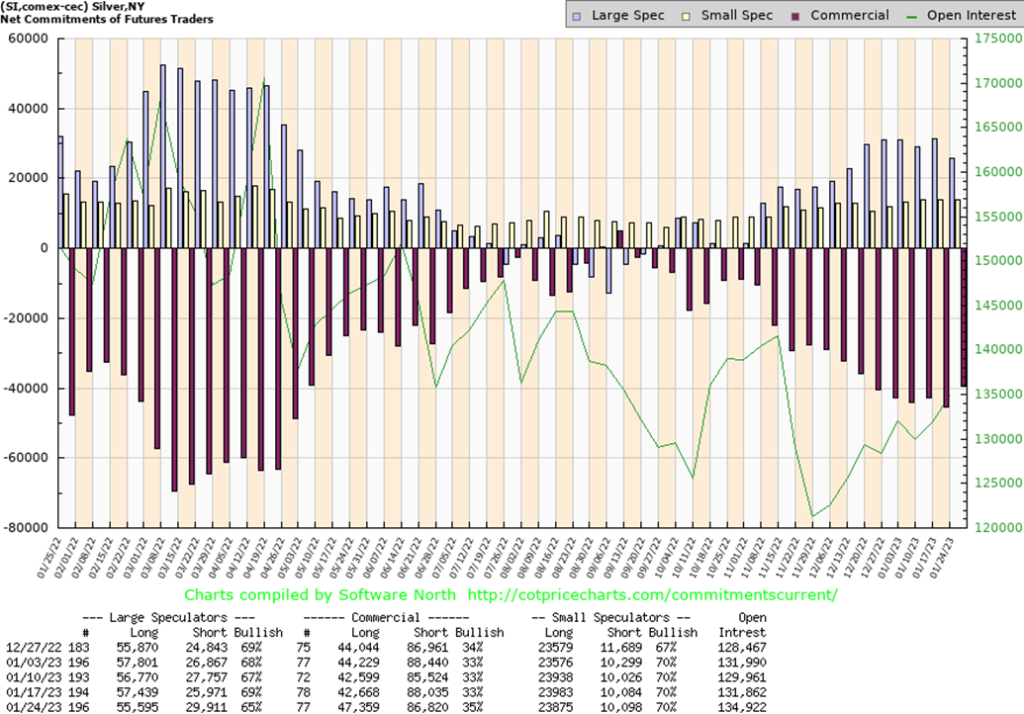
The silver commercial COT rose to 35% this past week from 33%. This is a marked improvement. Long open interest rose by almost 5,000 contracts while short open interest fell about 1,200 contracts. The large speculators COT fell to 65%, reflecting fears from the large funds. Long open interest fell about 2,000 contracts while short open interest rose roughly 4,000 contracts. The silver COT is encouraging for silver and turns it bullish once again. Total open interest was up roughly 3,000 contracts on a week where silver fell slightly.
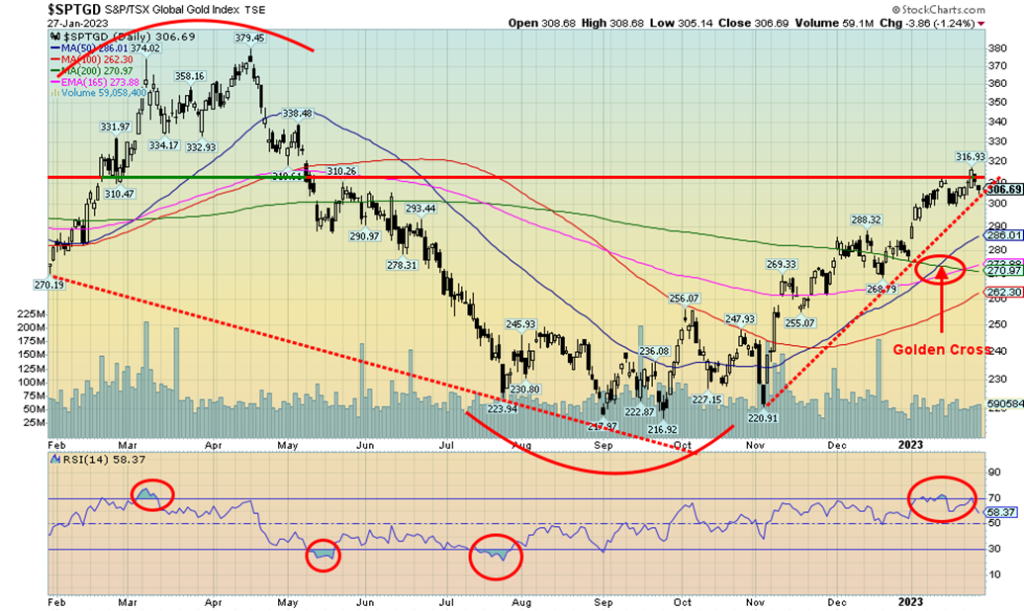
For the second consecutive week the gold stocks registered a small loss. This past week the TSX Gold Index (TGD) fell 0.3% while the Gold Bugs Index (HUI) was off a small 0.1%. The declines were so small we could almost say the market was flat this past week. The TGD tried to wiggle above its resistance line near 310 but was pushed back. The TGD did make new highs for the current up move, but we remain well off March 2022’s high of 379 (current 307). We are also clinging to up trend line support, although breaking this line would not be a disaster. We’d be more concerned if the TGD fell back below 285. Under 268 the rally would be considered over and our focus would shift to the downside. A break under 300 would the first sign of potential trouble. To the upside, the 310/315 zone remains resistance. Above that level we should get a run towards 340. Above 340, the odds increase that we should see new highs above 379. The all-time high, seen in 2011, is at 455. We remain some 48% away from that level. The Gold Miners Bullish Percent Index (BPGDM) is at 55%, hardly an extreme. We do have a golden cross in place, which should indicate that the TGD could find support down to 285.
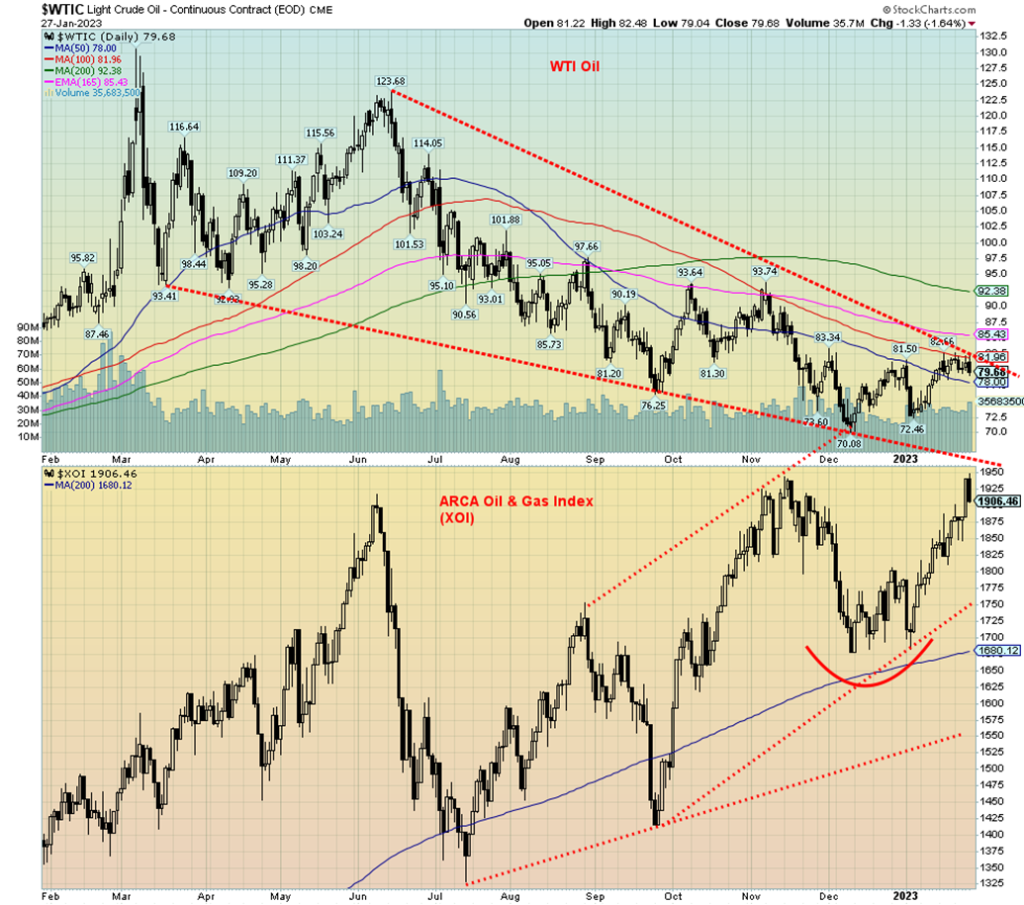
Oil prices were quite sluggish this past week, despite some stronger economic data and China’s re-opening, sparking hopes that oil demand would rise again. It seems that some recession fears have crept back into the oil market. WTI oil fell 2.4% this past week while Brent crude was down 1.7%. There was no joy in natural gas (NG) land, either. NG fell 10.1% to fresh 52-week lows and NG at the Dutch Hub in the EU was also down 17.2% to fresh 52-week lows. None of this seemed to bother the Arca Oil & Gas Index (XOI) as it rose 1.5% and the TSX Energy Index (TEN) jumped 2.2%. A divergence, making this a rather odd week as our thoughts turn to who’s right—the energy indices or the commodities.
WTI oil waffled through our trendline of what we thought was a descending wedge triangle. Maybe not so much any longer. The 100-day MA seems to have capped the rebound, for the moment at least. We need to break above $82 to suggest higher prices. The 200-day MA remains some distance away at $92.40. That didn’t bother the XOI as it made what could be a double top at 1,948, just above the November high of 1,945. Usually, at a double top, the second high is below the first high. So, this may not be a double top. The neckline is a fair distance away near 1,700. If we move higher again this coming week, then the double-top scenario is dead. Friday did see a sharp down day for the XOI as it fell 1.8%.
NG remains deeply oversold and the sentiment is scraping along rock bottom. But that doesn’t necessarily make a bottom as the market can go deeper than the longs can remain solvent. Speaking of solvency, the collapse in NG prices has been so dramatic and persistent that we expect to soon be reading about the collapse of some company that engages in NG, either through the futures markets or equity markets. The collapse has been nothing short of spectacular. From a high over $10 back in August 2022, NG has now fallen almost 72%. Entering the NG market at this point is highly speculative.
We may be entering the strong seasonal period for oil, gas, and energy stocks but, so far, we’ve seen little evidence that we are responding.
__
(Featured image by sergeitokmakov via Pixabay)
DISCLAIMER: This article was written by a third party contributor and does not reflect the opinion of Born2Invest, its management, staff or its associates. Please review our disclaimer for more information.
This article may include forward-looking statements. These forward-looking statements generally are identified by the words “believe,” “project,” “estimate,” “become,” “plan,” “will,” and similar expressions. These forward-looking statements involve known and unknown risks as well as uncertainties, including those discussed in the following cautionary statements and elsewhere in this article and on this site. Although the Company may believe that its expectations are based on reasonable assumptions, the actual results that the Company may achieve may differ materially from any forward-looking statements, which reflect the opinions of the management of the Company only as of the date hereof. Additionally, please make sure to read these important disclosures.
Copyright David Chapman, 2023
David Chapman is not a registered advisory service and is not an exempt market dealer (EMD) nor a licensed financial advisor. He does not and cannot give individualised market advice. David Chapman has worked in the financial industry for over 40 years including large financial corporations, banks, and investment dealers. The information in this newsletter is intended only for informational and educational purposes. It should not be construed as an offer, a solicitation of an offer or sale of any security. Every effort is made to provide accurate and complete information. However, we cannot guarantee that there will be no errors. We make no claims, promises or guarantees about the accuracy, completeness, or adequacy of the contents of this commentary and expressly disclaim liability for errors and omissions in the contents of this commentary. David Chapman will always use his best efforts to ensure the accuracy and timeliness of all information. The reader assumes all risk when trading in securities and David Chapman advises consulting a licensed professional financial advisor or portfolio manager such as Enriched Investing Incorporated before proceeding with any trade or idea presented in this newsletter. David Chapman may own shares in companies mentioned in this newsletter. Before making an investment, prospective investors should review each security’s offering documents which summarize the objectives, fees, expenses and associated risks. David Chapman shares his ideas and opinions for informational and educational purposes only and expects the reader to perform due diligence before considering a position in any security. That includes consulting with your own licensed professional financial advisor such as Enriched Investing Incorporated. Performance is not guaranteed, values change frequently, and past performance may not be repeated.


Ecobnb Turns Sustainable Tourism Into Measurable Impact
Ecobnb’s sustainable tourism platform generated significant environmental and social impact in 2025, avoiding 58,207 kg of CO₂ and adding 583...


Sugar Markets Balance Biofuel Demand and Global Supply
Sugar markets in New York and London were mostly unchanged as the Iran conflict renewed interest in biofuels. Drought concerns...


The $40 Trillion Trap: Disinflation Is Not Deliverance
U.S. debt has reached $40 trillion, with $24 billion weekly interest, while deficits accelerate. Despite disinflation in CPI, from cooling...


FinTech Matures as AI and Infrastructure Drive the Next Growth Phase
Fintech markets are entering a mature phase, shifting from rapid growth to consolidation, specialization, and sustainable business models. Zurich and...


Bitcoin, and Ethereum Rise, While Cardano Enters Transition
Bitcoin and Ethereum posted modest weekend gains, supported by ETF inflows. A new proposal may protect Bitcoin from quantum threats....
 |
|
 |  |
 |
|
-

 Biotech6 days ago
Alzheimer’s Study Reveals Immune Pathway Behind Women’s Higher Vulnerability and Potential New Treatment Approach
-

 Biotech2 weeks ago
The New Biotech Act Targets Europe’s Funding and Innovation Gap
-

 Crowdfunding4 days ago
Avant Devices Moves Toward Electric Wheelchair Kit Production with New Funding Drive
-

 Africa2 weeks ago
Bank of Africa Launches SME Pact to Boost Business Growth