Featured
Stock Markets Continue to Fade, While Divergences Dominate
Three themes dominated this past week. We cover all three. Inflation, the debt limit and the still ongoing banking crisis along with the emerging commercial real estate crisis. The bank stocks have done poorly this year. Not the place to be in the U.S. for sure. However, in Canada, while the banks have suffered they are better capitalized and stronger regulations. Down but not out.

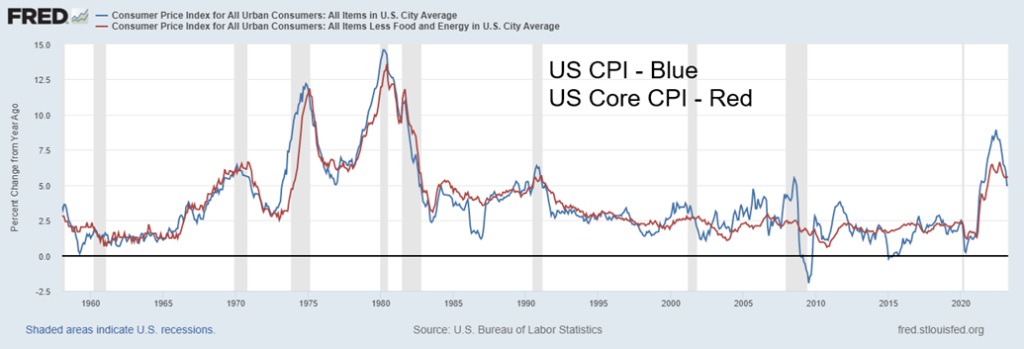
The April U.S. CPI came out and, once again, it came in slightly below expectations. At 4.9% year-over-year (y-o-y), it was the first time under 5% in two years. Happy days are here again? Hardly. It remains higher than it has been for the most part over the past 40 years. Only two brief spikes were seen above that level in 1990 and 2008. Neither lasted long enough to make any long-term impact. The Fed discount rate is now at 5–5.25% which is equal to or slightly above the inflation rate. Is this enough to bring down the rate of inflation to even lower levels?
Inflation Again
The Producer Price Index (PPI) also came out this past week. The PPI for April came in up 0.2%, below the expected 0.3% gain. Year-over-year, the PPI was up 2.3% vs. the expectation of 2.4%.
What it has done, we suspect, is end any thoughts that the Fed might hike rates once again at the June 13–14 FOMC. But will it mean that the Fed is going to cut rates later this year? Not likely. As we know, the Fed is data-driven and we’d have to see a serious deterioration in the economy to think of rate cuts. The last jobs report, we suspect, should put an end to thoughts of rate cuts unless we see a serious drop in employment over the next several months. There are still hawkish Fed governors that don’t quite see the end of rate hikes just yet. Inflation appears poised to remain sticky for the foreseeable future. Canada, we suspect, is also in a holding pattern. But the European Central Bank (ECB) may not be done yet. Indeed, the ECB hiked rates again by 25 bp as did the U.K. Latest figures show inflation in the ECB is 7.0% and in the U.K. is 10.1%. With central bank rates at 3.75% and 4.5%, the ECB has some catching up to do.
What was interesting is that the U.S. core CPI (ex: food and energy) came in 5.5% y-o-y. How could the core come in higher than the actual CPI? Food and energy are considered the most volatile elements of the CPI; hence, why they are removed to calculate the core. Apparently, the culprit is housing costs. While food and energy costs, particularly energy costs, have been coming down, housing and some other core prices have remained sticky at higher levels. Rent eased a bit but not significantly.
The Debt Limit
The potential nightmare that doesn’t go away—yes, the debt ceiling limit. It is difficult to come to an agreement between a hyper-partisan congress that is demanding billions (trillions?) in spending cuts now while the White House is demanding that the ceiling be raised as is and that budget talks take place separately. Paralysis is the word that comes to mind. To add to the hyper-partisan split, former president Donald Trump is urging Republican congressmen to dig in and resist raising the debt limit, even if it means default. JP Morgan Chase CEO Jamie Dimon called out Trump, claiming he has little or no understanding of the debt ceiling. Treasury Secretary Janet Yellen is saying that, come June 1, measures to make cash available runout. Most pundits put the drop-dead date a bit later to June 9–14. If cash inflows stay high, they could survive into July. U.S. Treasury cash balances have dropped below $200 billion. Sounds like a lot, but the U.S. has a budget deficit of over $1.4 trillion. That $200 billion can disappear quite fast.
Nonetheless, this has become a high-stakes game with no winners. Some are calling President Biden to use the 14th amendment to help the debt limit, but most believe it is a non-starter. The 14th amendment has a clause that effectively reads that the “validity” of the U.S. public debt “shall not be questioned.” This was originally a Civil War measure. Nonetheless, many believe that the best outcome will merely be a suspension to push the problem out to another day. This has happened before. But the U.S. could still be risking another debt downgrade. The last one occurred during the 2011 debt limit crisis when the U.S. lost its AAA rating and was downgraded to AA+. A similar event taking place today could see the U.S. debt downgraded to at least AA or, as a worst case, AA-.
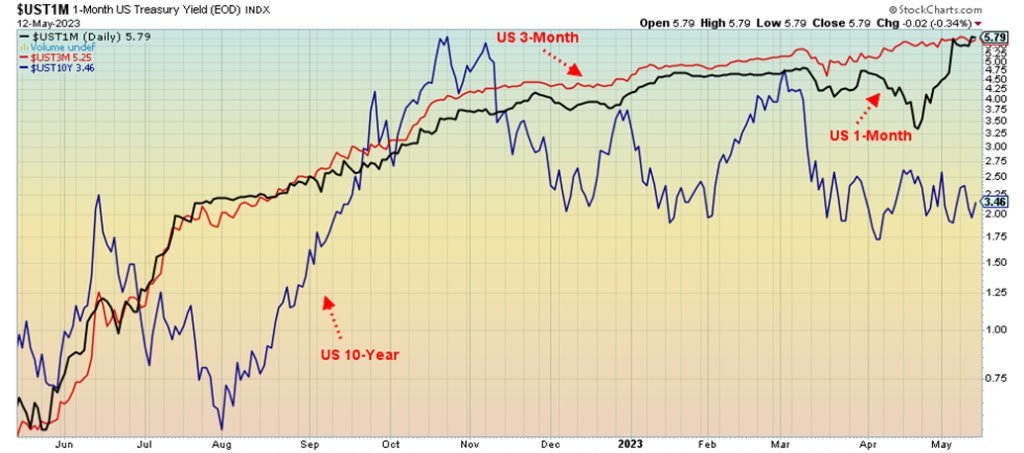
The key will be to contain a potential panic in stock markets. But the two sides don’t have too many windows until the end of the month to resolve this problem. Markets are worried but not panicking, because everyone believes that no-one will allow the U.S. to actually go into default. But short-term treasury yields have climbed to very high levels, as our chart of 1-month and 3-month U.S. treasury bills shows. 1-month has hit 5.79% and 3-month is up to 5.25%. For comparison, the U.S. 10-year treasury note is at 3.46% and has been falling.
The question remains, would they let things shut down and payments stop for anything from Social Security and Medicare obligations to defense payments, federal employees’ salaries, to government agencies like Customs and Border Protection and Homeland Security? Millions rely on their cheques. And, of course, the big question is, what about interest on the debt or paying off maturing debt?
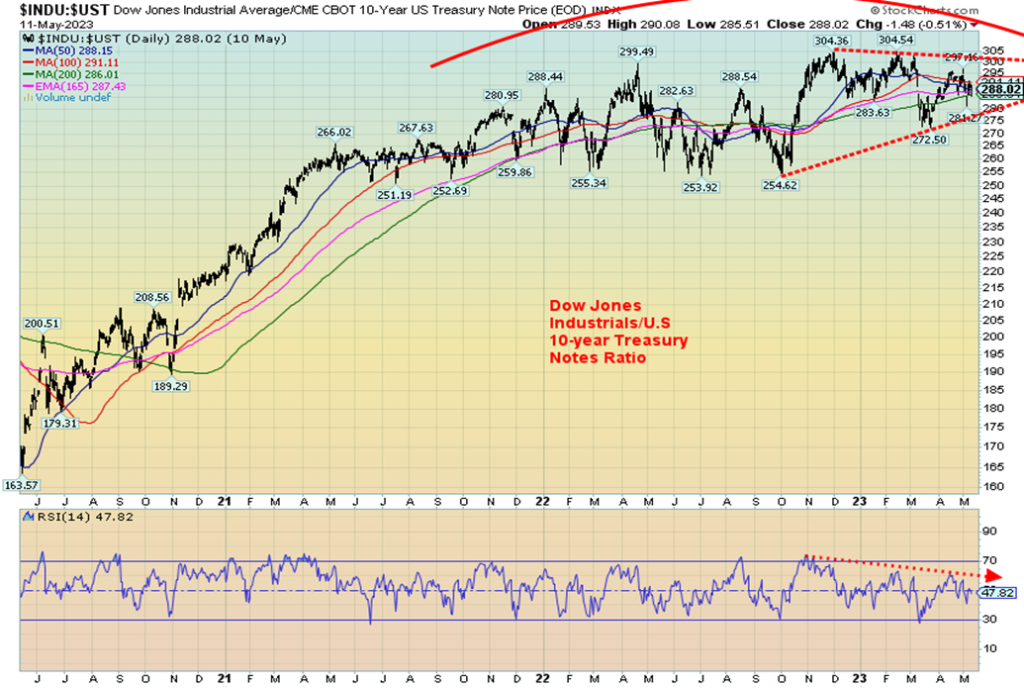
One thing to keep an eye on is the ratio between the Dow Jones Industrials (DJI) and the U.S. 10-year treasury bond. Since the 2020 pandemic panic low, the place to be has been in stocks, as represented in the ratio by the DJI/UST shown on the next page. But the past year or two has seen a very choppy market indicating that a potential shift in direction is coming. The chart is now indicating that it could break down in favor of bonds. That could signal the onset of a recession. Or it could signal a problem with the debt limit. Despite everything, the tendency would still be to rush to bonds and sell stocks. A breakdown in the ratio under 280 would signal that bonds are the place to be.
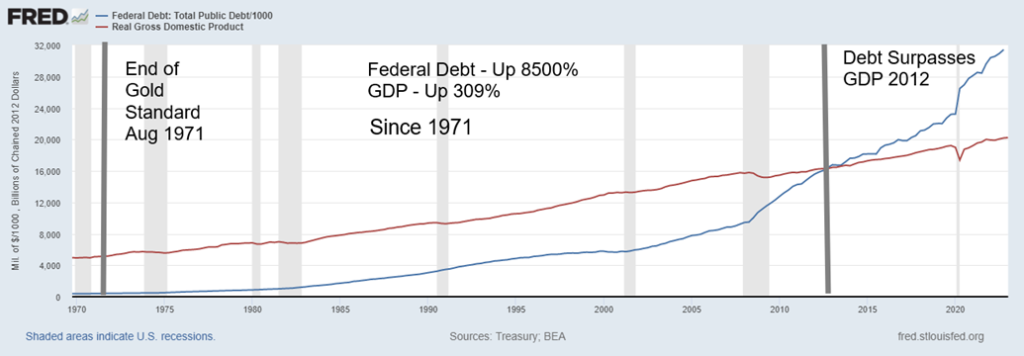
U.S. federal debt has long surpassed GDP. U.S. federal debt surpassed real GDP in 2012 and nominal GDP in 2013. Today, U.S. federal debt is 120.3% of nominal GDP and 155.6% of real GDP. Real GDP is adjusted for inflation. Normally, federal debt is measured against nominal GDP. Anything over 100% is considered to be a major drag on GDP growth. Of the major G7 countries, Japan has a debt/GDP of 266% and Italy 145%. France and the U.K. also have a debt/GDP ratio of over 100%. Canada is usually listed as well at 113%, but we note it includes all public debt of both the federal government and provincial governments. Canada’s federal debt/GDP as a standalone is the lowest of the G7, currently around 55%.
The debt ceiling problem is not going away. It may be antiquated but, given a hyper-partisan political environment, the odds of that changing are about nil. Depending on how this plays out, a debt downgrade may be the least of their worries. The latest in discussions is that a meeting planned between Biden and McCarthy on May 12 was postponed. Maybe staff are sorting it out. Then again, maybe not.
U.S. Federal Debt and Real GDP 1970–2023
Banking Woes Continue
Is the banking crisis over? Just when you think it is safe to go back into the water, another bank disaster pops up. First Republic was a big one. Was that it? Then along comes PacWest Bancorp and Western Alliance Bancorp. But others such as Comerica and KeyCorp are also suffering. They are all suffering, particularly the regionals. And it is not as if the U.S. banking sector is the only risk; there are huge risks as well in the commercial real estate sector that could dwarf problems in the homeowner’s real estate market. The problems extend into Canada as well and could be a global problem.
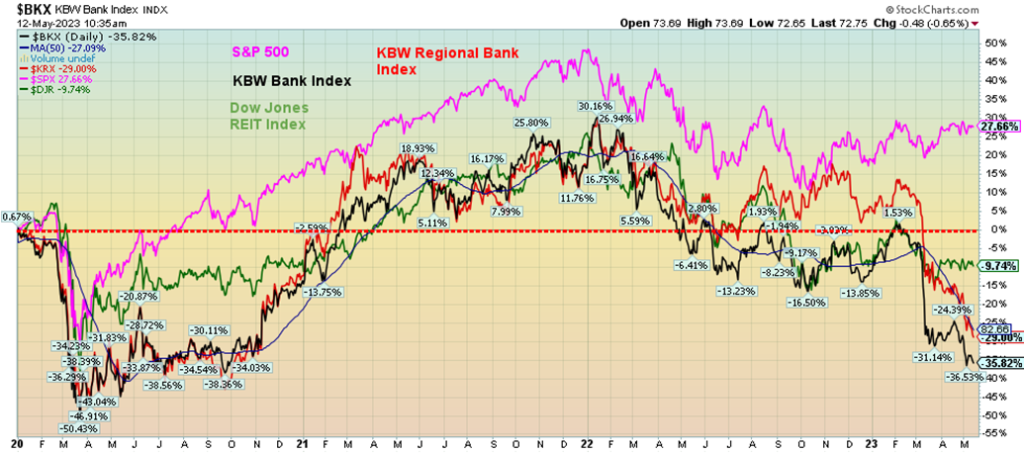
Banking crises are a regular occurrence. From the savings and loans crisis of the late 1980s/early 1990s to the Russian/Long-Term Capital Management (LTCM) crisis of 1998, to the financial crisis of 2007–2008 we have a long history of banking crises. Note that all of these crises also saw real estate crises. No, this time is not different. Since 2020, while the S&P 500 remains up 27.7%, the KBW Bank Index is down 35.8% and the KBW Regional Bank Index is down 29.0%. For the record, the TSX Financial Index (TFS) is still up 12.2% since 2020 and up just over 1% in 2023. Canada’s banking regulations and capital requirements are amongst the best in the world. No, FDIC does not cover everything, nor does CDIC insurance in Canada either. Those with deposits over $250,000 in any bank institution are at risk if the bank fails. In Canada, CDIC insurance covers up to $100,000. The Fed cannot bail out everyone. Nor should they even try. But banks are having to make larger contributions to cover the growing shortfall.
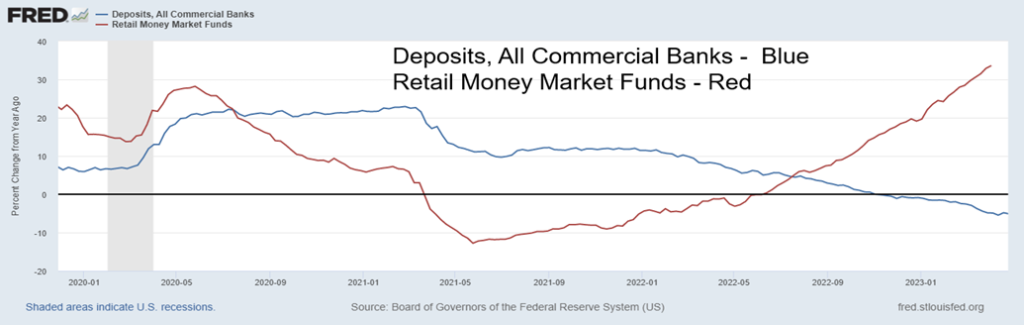
So, it is no surprise that bank deposits have fallen, even as money market funds have grown. Deposits at all commercial banks are coming out at a faster rate today than they were during the 2007–2008 financial crisis. Meanwhile, money market funds have grown.
Commercial real estate remains a big problem. There is some $1.5 trillion of real estate debt coming due by the end of 2025. Vacancy rates are high and companies are having trouble enticing workers back to the office. Defaults are rising. These things are like a slow-moving train wreck. Once the train goes off the rails, it is difficult to stop it until the final car falls. Two big problems and there does not appear to be an end to it.
Deposits, Commercial Banks, Money Market Funds 2020–2023
% Change
Sticky inflation, a potential debt ceiling crisis, an ongoing real estate and banking crisis. Most pundits are predicting a recession by Q3. The question is, how steep will this crisis be? And will there eventually be a Lehman Brothers moment? The clock is ticking.
Chart of the Week
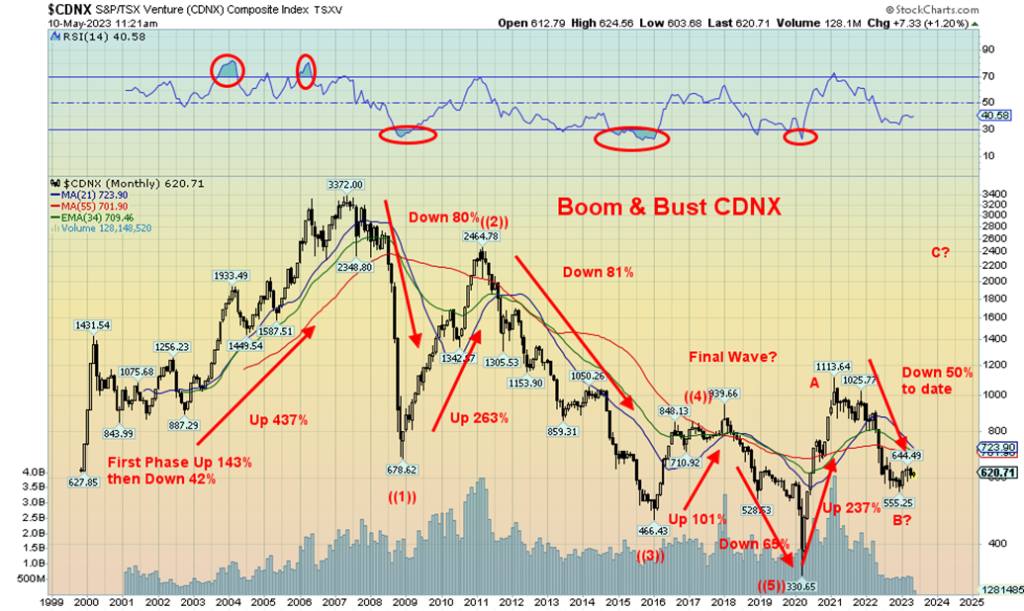
We’ve shown this chart in the past, but thought it worth looking at once again. The TSX Venture Exchange (CDNX) has been down so long it seems almost normal. The highs of 2007 and 2011 seem but a distant memory. Is there anyone around that remembers those days? We guess we have to stick up our hands. Those were heady days for the CDNX.
So comes the belief that if it did once before it could do it again. Patience is required. Volatility is a word that comes to mind when looking at the CDNX. After all, it is chock-full of junior mining companies, some of which eventually graduate to the larger Toronto Stock Exchange (TSX). The CDNX is recognized globally as a preeminent spot for junior mining companies that make up over 50% of the index. Mining means not only gold and silver, but also copper, uranium, lithium, nickel, coal, phosphate, prime metals, and more. There are also a number of energy-related companies on the CDNX and as well robotics firms, biotech firms, and more.
There 136 companies listed on the CDNX Composite Index, but there are over 1,700 companies that trade on the TSX Venture Exchange. It is, however, understandable why few can get excited for CDNX companies when the index is down over 81% from the 2007 high, down 75% from the 2011 high, and even down over 44% from the February 2021 high. For many, the CDNX is like poison.
But we do see a glimmer of hope. First, from the monthly chart of the CDNX above we can note what appears to be a five-wave decline from the 2007 high that bottomed with the pandemic low of 2020. Second, we appear to be embarking on a potential ABC upside correction. The A wave topped in February 2021 and the B wave, we believe, bottomed in December 2022. Notably, the A wave took out the high of wave 4 on the way down. This is a signal that tells us the huge down wave may be over. We may be in the early stages of the C wave, a wave that could take us to a least a double top with the February 2021 high. A classic ABC flat.
But if we enjoyed a normal 50% to a Fibonacci 61.8% correction, then we could have potential to reach to 1,850 to 2,210. The Fibonacci 38.2% correction is at 1,490. The potential is there, but can it be realized?
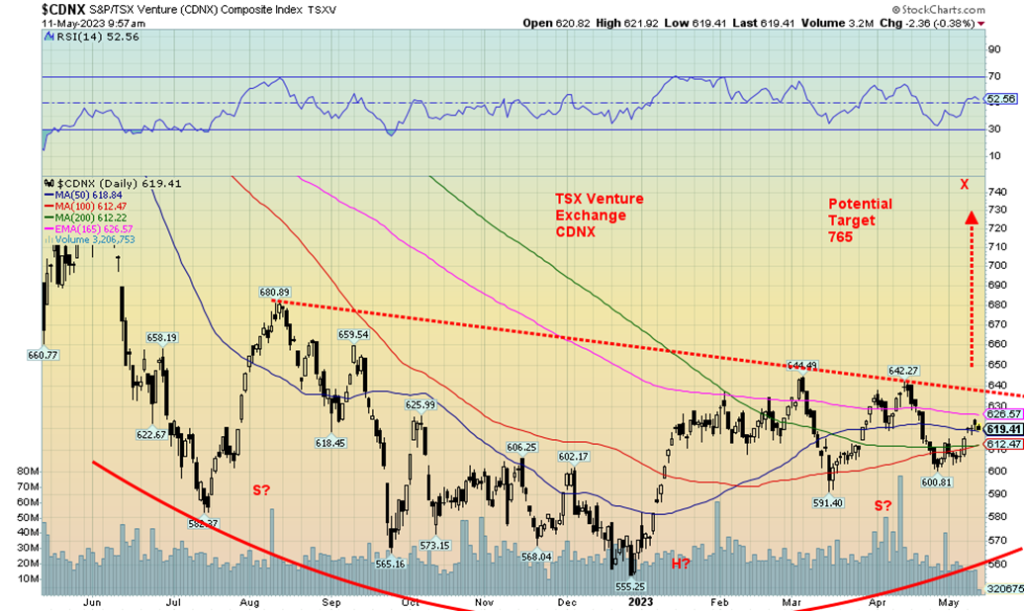
Our one-year chart of the CDNX above shows a potential head and shoulders bottom forming. The breakout is up around 640 with potential targets up to 765. That’s decent, but it is not a home run that a 61.8% correction would be. While it seems far away, a move above 2,650 could imply that we’ll see new all-time highs.
There is potentially a huge up move for the CDNX coming. Previous up waves saw gains of 437%, 263%, 101%, and more recently 237%. For the time being at least, the 80% collapses seem to be a thing of the past. Trying to pick winners, however, is difficult when one considers there are so many companies. The best bets appear to be in the mining sector which dominates the index. But a reminder that buying a CDNX stock is not like buying Royal Bank of Canada. Research and patience are required, along with a stomach for some volatility.
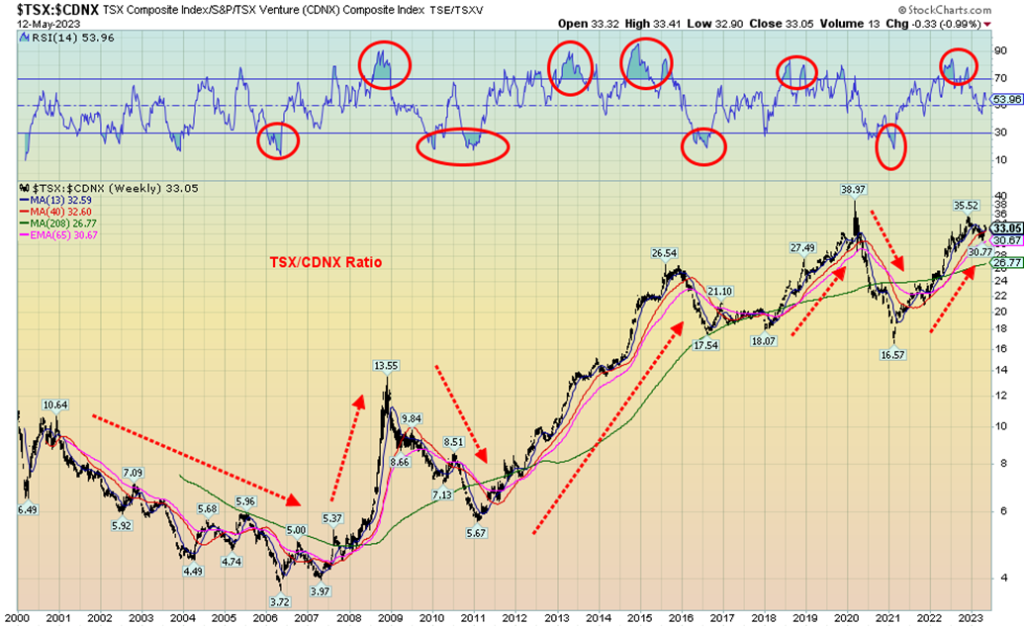
The TSX/CDNX ratio chart shows the volatility of the CDNX, with sharp ups and downs favoring either the TSX or CDNX. When the ratio is rising, the TSX is the place to be, but if the ratio is falling the CDNX leads. Right now, we may have made a top in the ratio back in November 2022. However, it is not conclusive and the CDNX has not yet given a buy signal. Given previous spike tops in the ratio, the odds are shifting that the ratio has topped and, going forward, the CDNX could outperform the TSX. A breakdown under 30 in the ratio could start the tide to shift to the CDNX. The CDNX did have a long run from 2001 to 2006 where it steadily outperformed the TSX. However, from 2011 to 2015 the TSX was the place to be. As can be seen from the RSI, the ratio tends to become overbought or oversold. The most recent reading was overbought, favoring the TSX over the past couple of years. Is the tide shifting to the CDNX?
Markets & Trends
| % Gains (Losses) Trends | ||||||||
| Close Dec 31/22 | Close May 12/23 | Week | YTD | Daily (Short Term) | Weekly (Intermediate) | Monthly (Long Term) | ||
| Stock Market Indices | ||||||||
| S&P 500 | 3,839.50 | 4,124.08 | (0.3)% | 7.4% | up (weak) | up | up (weak) | |
| Dow Jones Industrials | 33,147.25 | 33,300.62 | (1.1)% | 0.5% | neutral | up (weak) | up | |
| Dow Jones Transport | 13,391.91 | 13,783.19 | (2.4)% | 2.9% | down | neutral | up (weak) | |
| NASDAQ | 10,466.48 | 12,284.74 | 0.4% | 17.4% | up | up | neutral | |
| S&P/TSX Composite | 19,384.92 | 20,419.62 | (0.6)% | 5.3% | up (weak) | up | up | |
| S&P/TSX Venture (CDNX) | 570.27 | 617.84 | 0.4% | 8.3% | neutral | neutral | down | |
| S&P 600 (small) | 1,157.53 | 1,119.61 | (1.7)% | (3.3)% | down | down | neutral | |
| MSCI World Index | 1,977.74 | 2,147.26 | 0.2% | 8.6% | up (weak) | up | up (weak) | |
| Bitcoin | 16,535.23 | 26,421.21 | (9.8)% | 59.8% | down | up | neutral | |
| Gold Mining Stock Indices | ||||||||
| Gold Bugs Index (HUI) | 229.75 | 266.88 | (4.1)% | 16.2% | neutral | up | neutral | |
| TSX Gold Index (TGD) | 277.68 | 321.80 | (3.3)% | 15.9% | neutral | up | up | |
| % | ||||||||
| U.S. 10-Year Treasury Bond yield | 3.88% | 3.46% | 0.9% | (10.8)% | ||||
| Cdn. 10-Year Bond CGB yield | 3.29% | 2.89% | (0.7)% | (12.2)% | ||||
| Recession Watch Spreads | ||||||||
| U.S. 2-year 10-year Treasury spread | (0.55)% | (0.53)% | (10.4)% | 3.6% | ||||
| Cdn 2-year 10-year CGB spread | (0.76)% | (0.86)% | (6.2)% | (13.2)% | ||||
| Currencies | ||||||||
| US$ Index | 103.27 | 102.51 | 1.5% | (0.7)% | up | down | up (weak) | |
| Canadian $ | 73.92 | 73.80 | (1.4)% | (0.2)% | neutral | neutral | down | |
| Euro | 107.04 | 108.51 | (1.5)% | 1.4% | down | up | down (weak) | |
| Swiss Franc | 108.15 | 111.28 | (0.9)% | 2.9% | up (weak) | up | up | |
| British Pound | 120.96 | 124.50 (new highs) | (1.5)% | 2.9% | up (weak) | up | down (weak) | |
| Japanese Yen | 76.27 | 73.69 | (0.6)% | (3.4)% | down | neutral | down | |
| Precious Metals | ||||||||
| Gold | 1,826.20 | 2,019.80 | (0.3)% | 10.6% | up (weak) | up | up | |
| Silver | 24.04 | 24.15 | (6.9)% | 0.5% | down (weak) | up | up | |
| Platinum | 1,082.90 | 1,067.00 | (0.1)% | (1.5)% | up (weak) | up | up | |
| Base Metals | ||||||||
| Palladium | 1,798.00 | 1,513.80 | 1.8% | (15.8)% | up | down | down | |
| Copper | 3.81 | 3.73 | (3.9)% | (2.1)% | down | neutral | neutral | |
| Energy | ||||||||
| WTI Oil | 80.26 | 70.04 | (1.8)% | (12.7)% | down | down | neutral | |
| Nat Gas | 4.48 | 2.27 | 6.1% | (49.3)% | down | down | down | |
New highs/lows refer to new 52-week highs/lows and, in some cases, all-time highs.
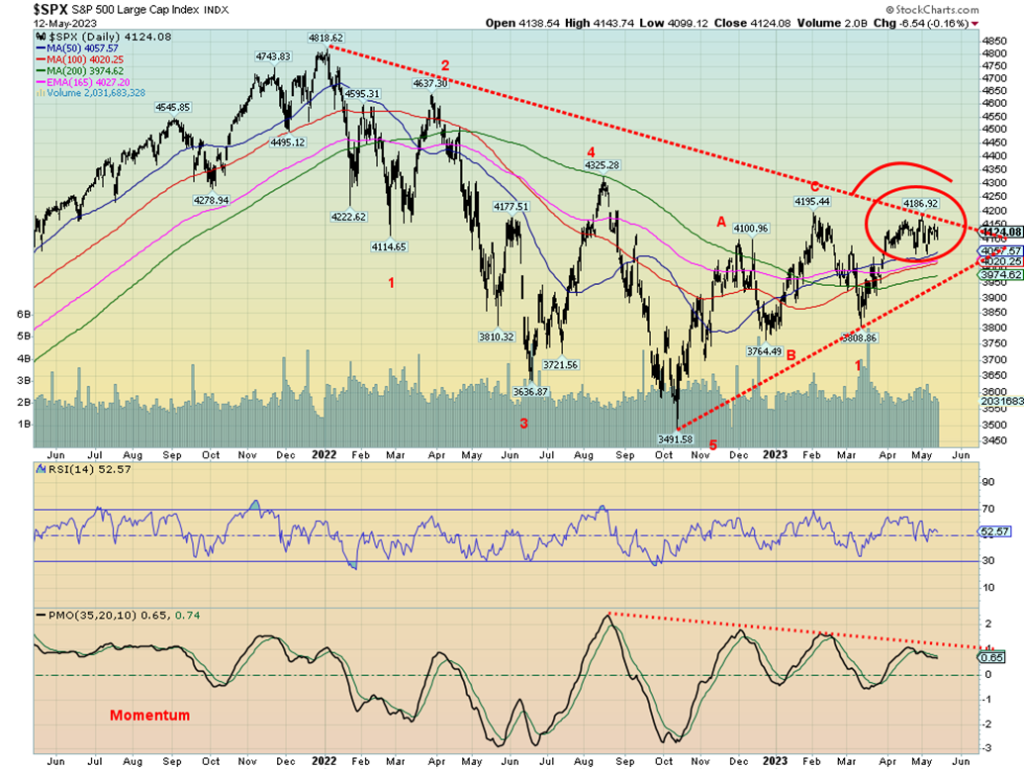
The S&P 500 continues to make what appears to us as a small topping pattern. The S&P 500 fell 0.3% this past week, the Dow Jones Industrials (DJI) was down even more, off 1.1% while the Dow Jones Transportations (DJT) fell even more 2.4%. Only the NASDAQ bucked the trend and rose 0.4%. That’s a non-confirmation divergence. The DJI and the DJT continue to diverge and, as well, the DJT is nowhere near its recent highs. Divergences abound for the indices and none are pointing to an up move. Again, we show how momentum is fading and diverging with the S&P 500 Index. It is a matter of when, not if that we should fall. A break now of 4,000 for the S&P 500 would be dangerous and under 3,900 fatal. However, until we break down, there is a chance of getting a print above 4,200, a level many bulls have cited. That could draw in a few more players before the market reverses once again.
In Canada, the TSX Composite lost 0.6% but the TSX Venture Exchange (CDNX) gained 0.4%. In the U.S., the small cap stocks are falling as the S&P 400 (Mid) lost 1.2% while the S&P 600 (Small) was down 1.7%. All of this shows narrowness of this market as only a few big cap stocks largely in the tech sector are keeping it up.
Significantly, the NY FANG Index made 52-week highs, up 3.2% on the week. There is your leader. As for the rest, well, Bitcoin finally gave up the ghost and dropped below 27,000, losing 9.8% on the week.
In the EU, the London FTSE lost 0.3%, the EuroNext was down 0.1%, the Paris CAC 40 off 0.2%, and the German DAX was down 0.3%. In Asia, China’s Shanghai Index (SSEC) dropped 1.5%, Hong Kong’s Hang Seng (HSI) was down 2.1%, but Japan’s Tokyo Nikkei Index (TKN) was a big winner, making fresh 52-week highs, up 0.8%. Not a good week for the foreign indices. China and Hong Kong look like they are making tops. The EU indices all look quite toppy. However, the MSCI World Index gained 0.2% and some emerging markets are looking interesting.
With the NASDAQ diverging from the rest of the indices, the North American stock markets do not look positive. The breakdown comes when they break their recent lows and, for the S&P 500, that would be a move under 4,000. Under 3,900 seals the deal. Not even new highs above 4,200 could turn the market up as we believe that could prove to be a false breakout. We note that especially with the fading indicators that are not confirming the stock markets.
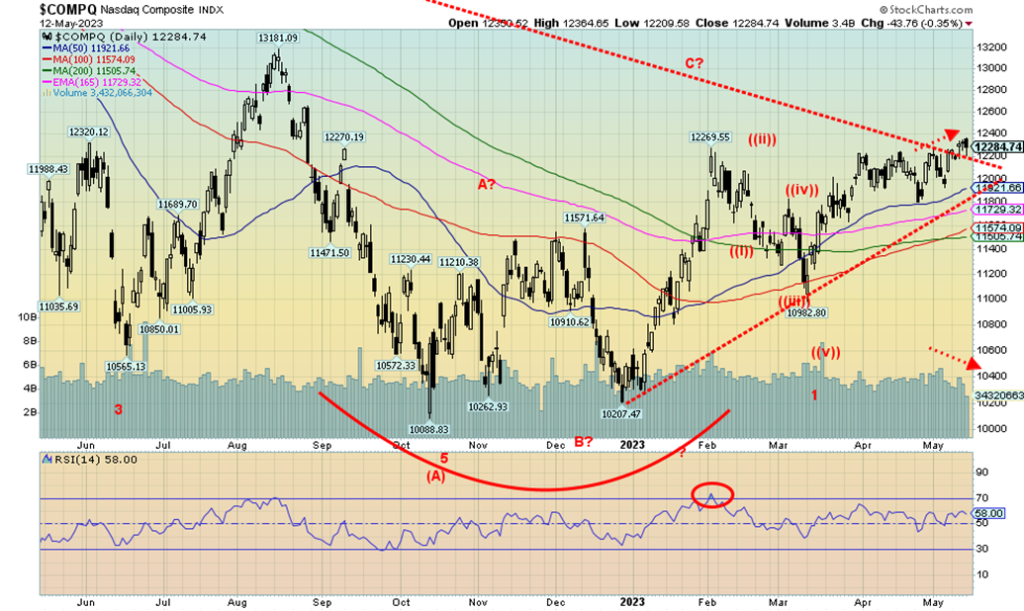
We wonder if the NASDAQ is lonely. Of the four major U.S. indices this past week, the NASDAQ was the only one up on the week. But even that was a feeble 0.4%. Yes, the NY FANG Index made fresh 52-week highs, but therein lies the problem. The up move has not been broadly based. Mostly, it is the big technology stocks that are leading the way. The new highs/new lows index has been sliding, not rising. That tells us this a very narrow up move. Microsoft and Nvidia both made 52-week highs this past week, then reversed and closed lower. Not a good sign. The NASDAQ has been the only Index to wiggle through that downtrend line from the highs. All other indices are failing and some aren’t even close. The Russell indices are looking toppy and both the Russell 1000 and 3000 appear to be forming rounding tops. The Russell 2000 (small cap) remains well below recent highs, underperforming both the 1000 and 3000. A breakdown now for the NASDAQ under 11,800 would seal a move lower. Friday’s action saw the NASDAQ make small new highs, then reverse and close lower. Not a positive sign. Volume has been waning as the market moves higher. Negative divergences are being seen in a number of indicators. The NASDAQ along with the NASDAQ 100 have been making new highs for this move while the other indices have not. A significant divergence of non-confirmation.
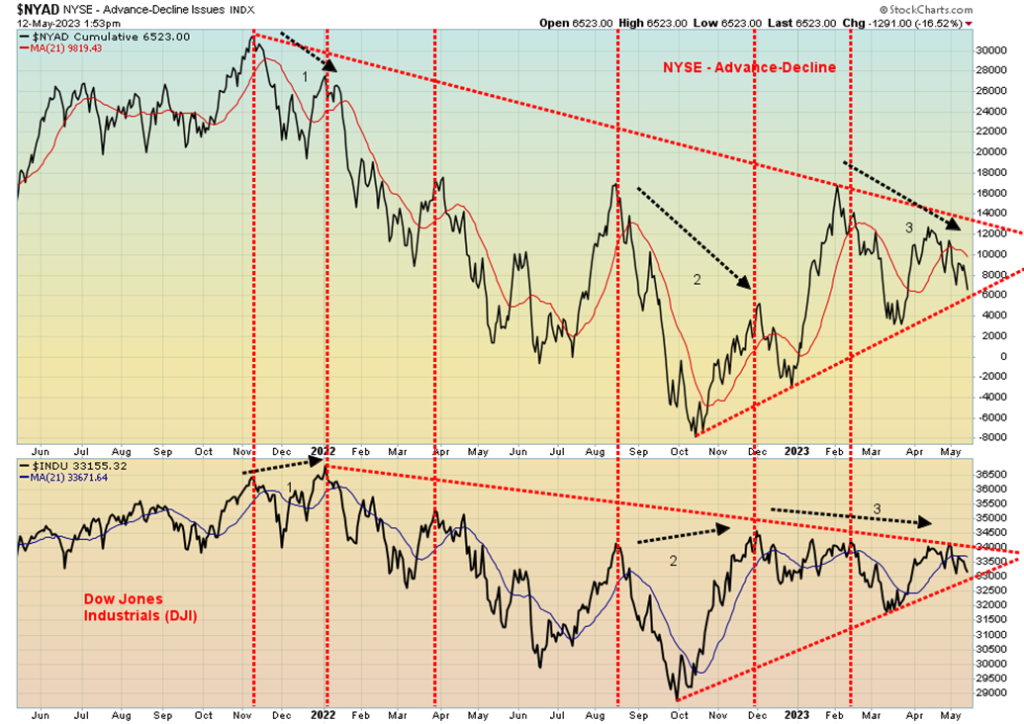
Here are more divergences. The NYSE Advance/Decline line has been diverging with the Dow Jones Industrials (DJI). It also shows on the S&P 500 as well. Labels 1,2,3 define the divergence. Both 1 and 2 divergences are very clear as the DJI was making a higher high while the AD line was making a lower high. It is not as clear on 3 but the AD line is definitely making a lower high, even as the DJI is back roughly where it was on two earlier occasions. So, it may be a small divergence but a divergence nonetheless. The only way to save it is for the AD line to rebound strongly and make new highs along with the DJI. But we know that this has been a very narrow advance. So, it is not surprising that AD line is not keeping up with the index. Another warning.
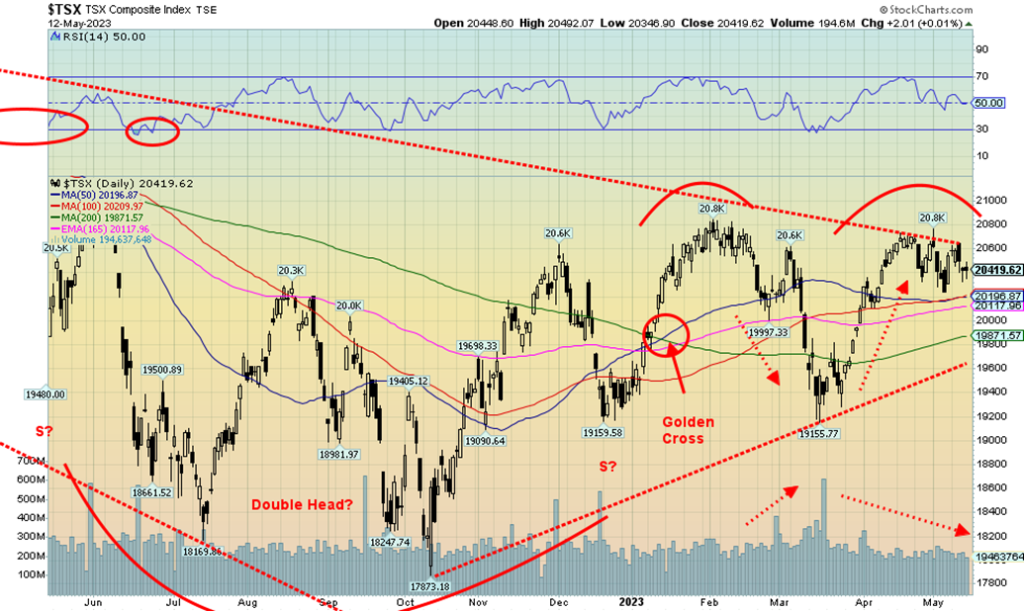
The TSX Composite fell 0.6% this past week. The pattern forming continues to look like a top. A breakdown now through 20,195 could start a big downdraft. Major support lies down at 19,600 to 19,850. The TSX Venture Exchange (CDNX) bucked the trend and rose 0.4% this past week. It was a bad week for the commodity sectors as they led the downturn. Eight of the 14 sub-indices were down this past week, led by Materials (TMT) and Golds (TGD), both down 3.3%. Metals & Mining (TGM) dropped 3.1%, Energy (TEN) was down 2.2% and Health Care (THC) was down 2.6%. To the upside, the leader was Industrials (TIN), up 1.4%. Information Technology (TKK) made fresh 52-week highs, but the gain was only 0.6%. Consumer Discretionary (TCD) was up 1.2%. The only thing that could save the TSX now is new highs above 20,800. Otherwise, the sliding top pattern looks lower, a question of when not if. Note how volume rose sharply on that plunge into March. And now note how it has tailed off considerably as the market rose once again. This is not a strong market and the next move should be down.
U.S. 10-year Treasury Bond/Canadian 10-year Government Bond (CGB)
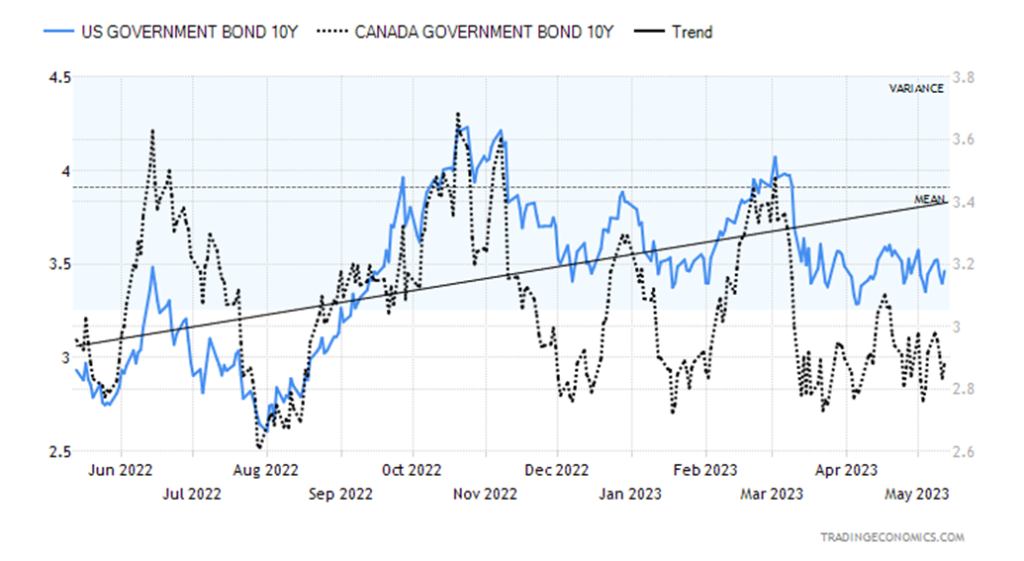
Bond yields ticked higher this past week, but the rebound was feeble. The U.S. 10-year treasury note rose to 3.46% from 3.43%. In Canada, it was the opposite as the 10-year Government of Canada bond (CGB) slipped to 2.89% from 2.91%. The recession spreads, however, widened as the 2–10 spread in the U.S. jumped to 53 bp from 48 bp and Canada’s 2–10 rose to 86 bp from 81. The 3-month–10-year spread in the U.S. is now at 176 bp and in Canada at 155 bp. All are still predicting a recession which pundits believe will start by Q3. Despite that there are some who believe we’ll see no recession or just a mild one.
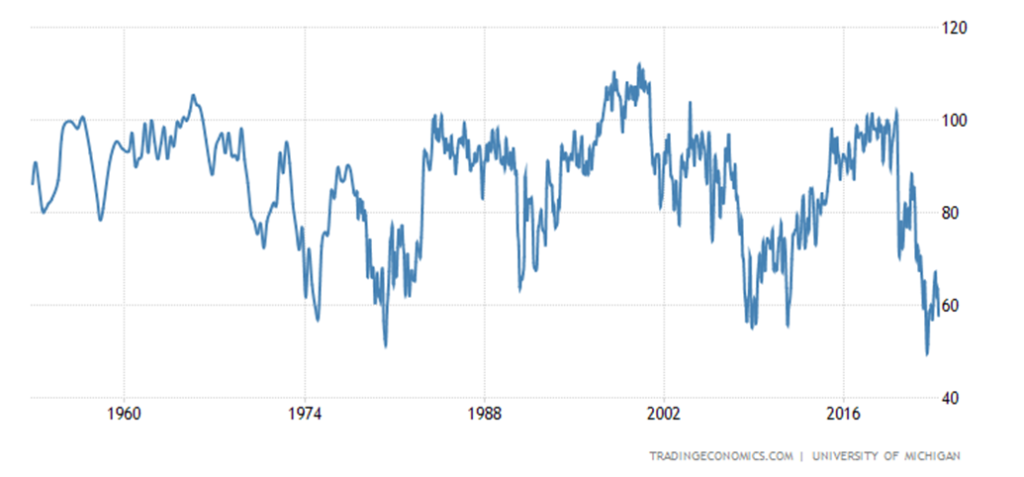
The inflation numbers were the big ones this past week. The weekly jobless claims came in at 264,000, above the previous week’s 242,000 and above the consensus at 245,000. That helped check any rise in bond yields. A hawkish speech from Fed governor Waller didn’t help. A bit of help was the University of Michigan Sentiment Index which came in at an unexpected 57.7, well below the forecast of 63, and April’s 63.5. Not only is that a six-month low, but it remains at levels last seen during the Great Recession of 2007–2009 and the 1980–1982 recession. And, as we have noted, we still don’t have an official recession. That should help steady bond yields.
Bond yields still look like they are forming a large top, but we need to bust down through 3.00% to fully tell us that we are headed lower. A move back up through 4.00% could have the opposite effect. If worse came to worst and we really had a U.S. default, that could help push up bond yields. A debt downgrade could also be negative.
University of Michigan Consumer Sentiment Index 1948–2023
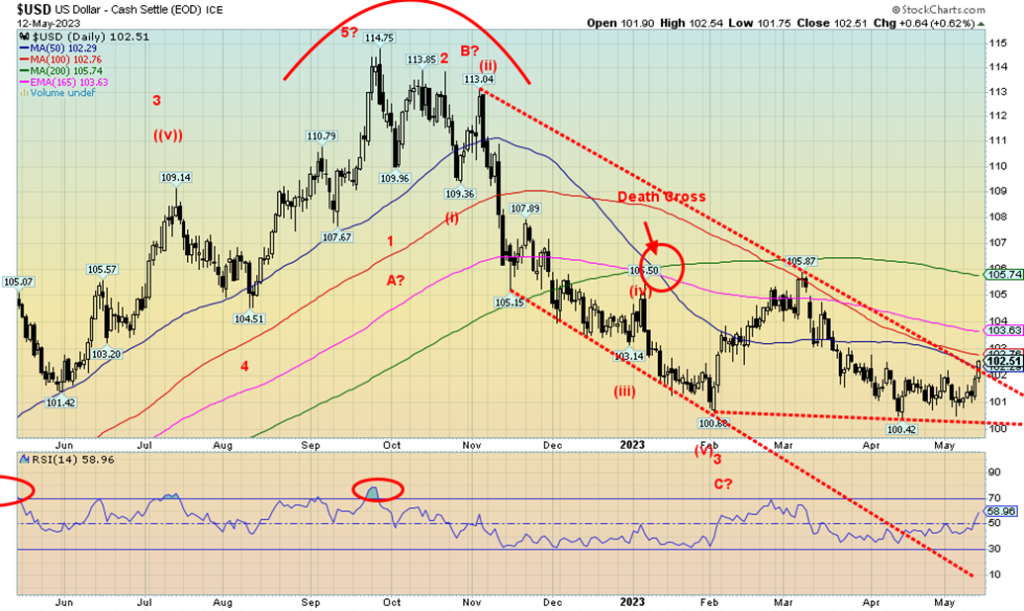
Is the US$ Index breaking out? We suspect it’s more likely the US$ Index is in the throes of either creating an ABC flat or this is the C wave of a potential ABCDE-type triangle pattern. A flat could see the US$ Index test up around 105.70/106 once again. A firm breakdown under 101 could suggest that major support near 100 could fall. That would negate any upward move. No, we don’t believe the US$ Index correction is over. But we do note that we believed the US$ Index fell in five waves from the high in September at 114.75 to the low in February, just under 101. For the short term, we remain slightly bullish on the US$ Index. This past week it gained 1.5%. The euro lost 1.5% despite the ECB hiking rates again, the Swiss franc was down 0.9%, the pound sterling made fresh 52-week highs, then reversed and closed lower, off 1.5%, and the Japanese yen dropped 0.6%. The Canadian dollar wasn’t spared as it lost 1.4%. Weak oil prices did not help the Canadian dollar. Only a return back under 101 would turn this market down. Resistance is above up to 103/103.50.
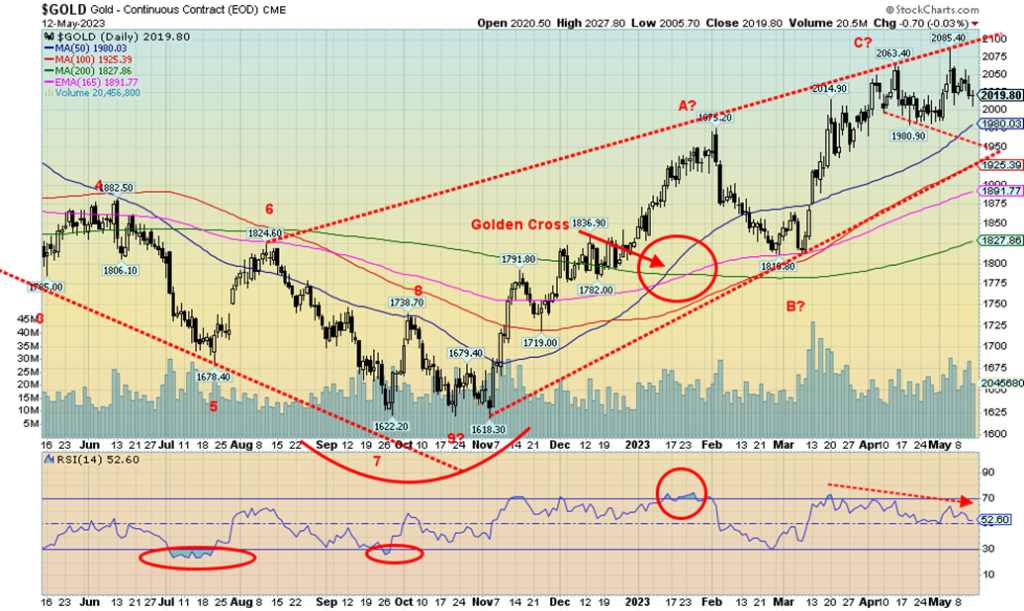
Gold had a poor week but not as bad as silver’s week. Gold fell 0.3% compared to silver’s mini-crash of 6.9%. Gold did not take out its recent low at $1,980, but silver crashed through a comparable low at $24.53. A divergence in favor of gold? Which one is wrong? Platinum fell 0.1%, while the near precious metals saw palladium gain 1.8% but copper lose a sharp 3.9% on recession fears. Gold was weakened, thanks to a much stronger US$ Index and slightly rising bond yields. Sentiment had also jumped over 90% and usually at those levels, it signals a top, even if it’s temporary.
That recent low of $1,980 remains important, although a breakdown under $1,975 could quickly take us down toward $1,900. We note a long-term uptrend line coming at $1,925, so maybe that would hold things and maintain the uptrend. Unlike silver which saw a big uptick in volume, gold’s volume did not rise significantly on this pullback. Gold is maintaining its superiority. Momentum continues to decline and we note the negative divergence between the price of gold which made higher highs and waning momentum that made a lower high. That divergence was also seen in other indicators.
While the stronger dollar didn’t help, we remind ourselves that the banking crisis is not over, the debt ceiling has not been resolved, and the war continues to rage between Russia/Ukraine. The political divide in the U.S. is as bad as it has ever been. The debt ceiling war could still eventually prove detrimental to the US$ Index, which in turn would be good for gold. But a resolution could do the opposite.
Gold’s uptrend remains intact. A move above $2,050 could suggest a test of the highs while a move above $2,065 could suggest new highs above $2,085. Gold’s trend remains up. Gold is still the best place to be if confidence in government collapses.
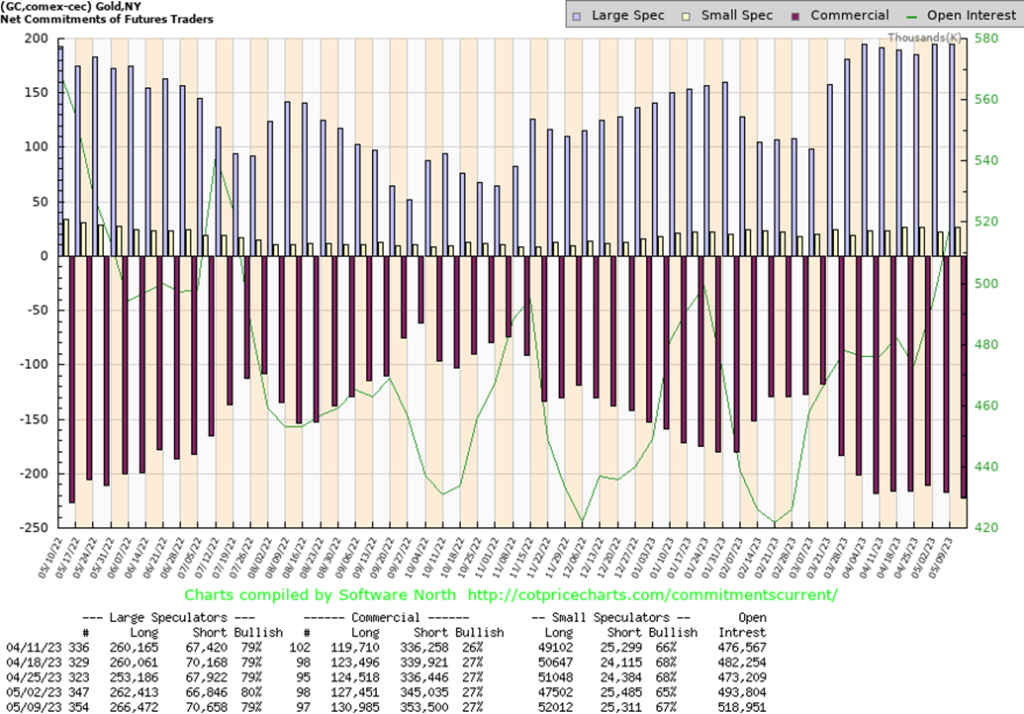
The commercial COT (bullion companies and banks) was unchanged at 27% this past week. However, long open interest jumped over 3,000 contracts while short open interest was up over 8,000 contracts. The large speculators COT (hedge funds, managed futures, etc.) dropped to 79% from 80% as they added about 4,000 longs but also added about 4,000 shorts. Open interest was up about 25,000 contracts on a down week for gold. Not a lot has changed, but it is mildly negative.
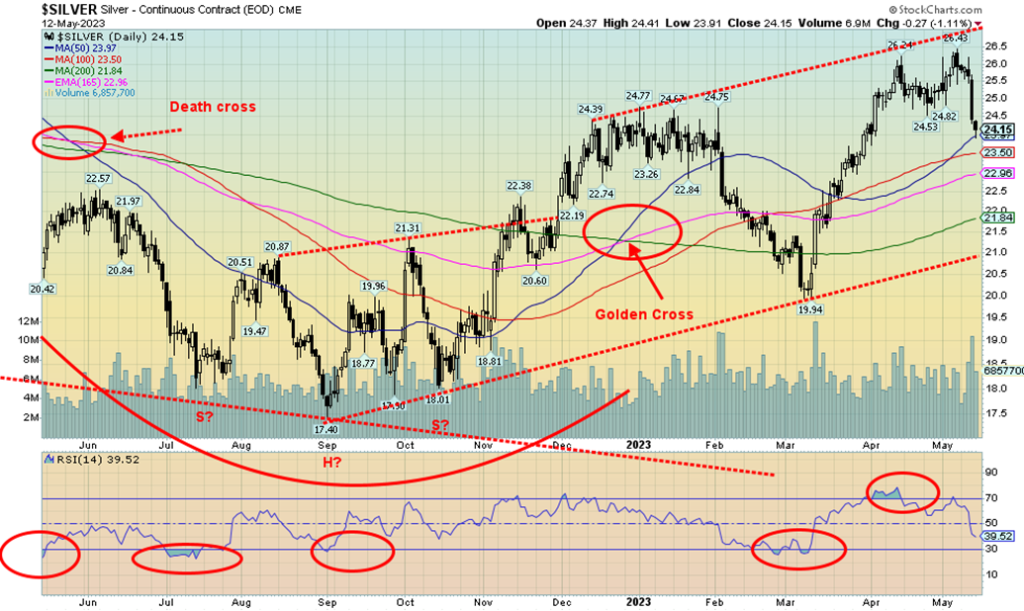
It was a poor week for silver. Not only did it fall 6.9% on the week but it broke under the recent low of $24.53, closing down at $24.15. A firm break of $24 could quickly take us down to $22. Long-term major support is seen at $21. For silver, this was the worst week in seven months. The only good news is that the drop in silver was not confirmed by gold as gold prices generally held up, even as silver fell. There are fears of demand falling for industrial silver as the economy slows. In that respect, silver acts more like an industrial metal rather than a precious metal. The low on the week was Friday at $23.91. That is just slightly below the Fibonacci 38.2% retracement level of the move from the March low of $19.94 to the high at $26.43. It increases the odds that we could see a 50%–61.8% retracement of the move. That would place silver down to $22.40 to $23.20. A breakdown under $21.50 suggests new lows below $19.94 ahead. The drop this week was swift and vicious. Even if we consolidate, it could take a while to regain the recent high of $26.43. The RSI has fallen swiftly to under 40. The short-term trend has turned down, albeit weakly, but another down week would put the short-term trend firmly to the downside. It would also weaken the intermediate uptrend. Volume picked up this past week as well. That’s not a particularly good sign. As we note next, the commercial COT remains weak, not favouring a rebound for silver.
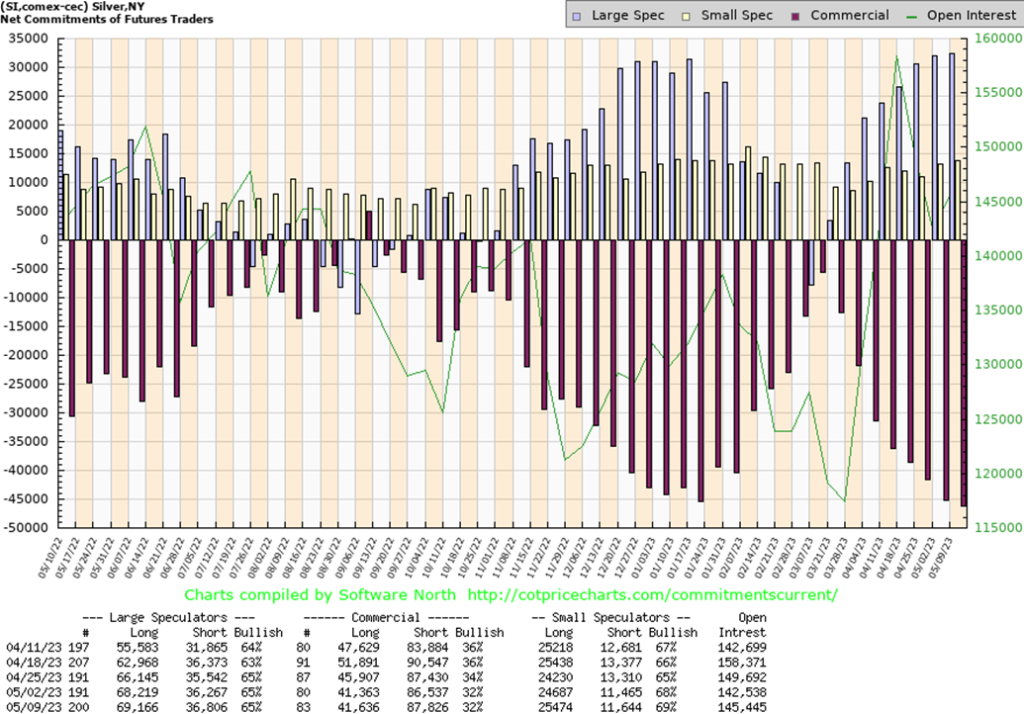
The commercial COT for silver was also unchanged at 32% this past week with little change in either longs or shorts, although the shorts were up roughly 1,000 contracts. The large speculators’ COT was also unchanged at 65%, but here they added about 1,000 longs while the shorts were only up about 600 contracts. Open interest gained about 3,000 contracts on a sharp down week. The silver COT is somewhat negative.
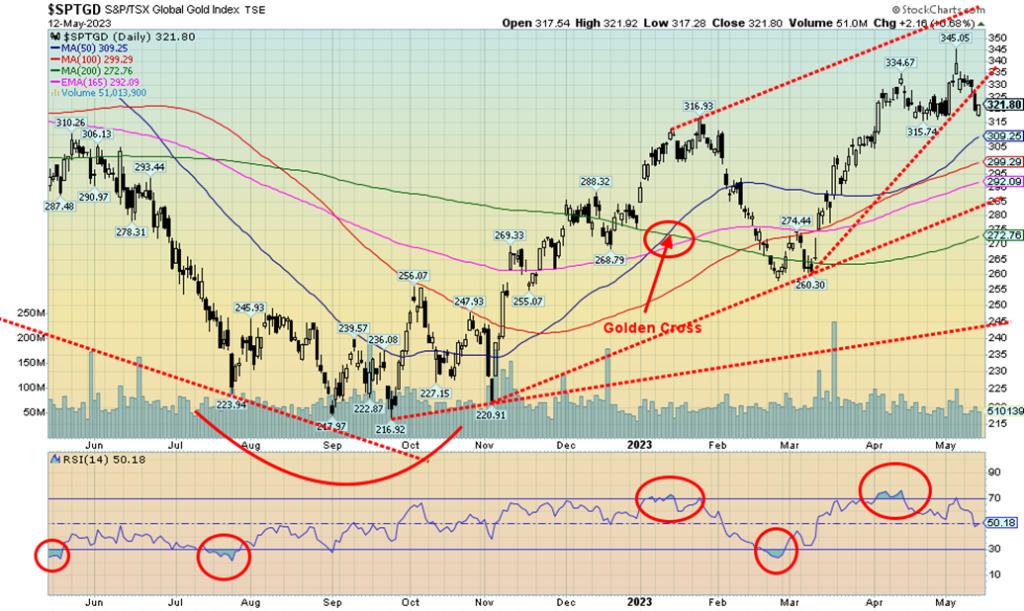
It was not a good week for the gold stocks. With both gold and silver down, especially silver, the TSX Gold Index (TGD) fell 3.3% while the Gold Bugs Index (HUI) lost 4.1%. The drop didn’t quite wipe out the previous week’s gains. We can’t say we liked the action. We did swing up to new highs the previous week, but this week’s drop finished just above the recent low of 315.74 (close 321.80). Only gains on Friday saved the week. We broke through an uptrend line and a move now below 315 could see us fall to stronger support near 300. Long-term uptrend support is down at 285. RSI is currently neutral, but there were negative divergences at the recent top as the TGD made higher highs but the indicators made lower highs. This week’s action turned the short-term trend to neutral from up. Another down week and the short-term trend is likely to turn down. With the technicals looking somewhat bearish, the odds are calling for further drops. The only savior might be if the high at 345 was the second thrust to a high and we might get a third thrust to a high. Those patterns tend to be bearish. A drop under 310 would, we suspect, end any thoughts of another upward thrust. The suspected wedge triangle pattern still has the upper channel near 360, so another upward thrust is not impossible.
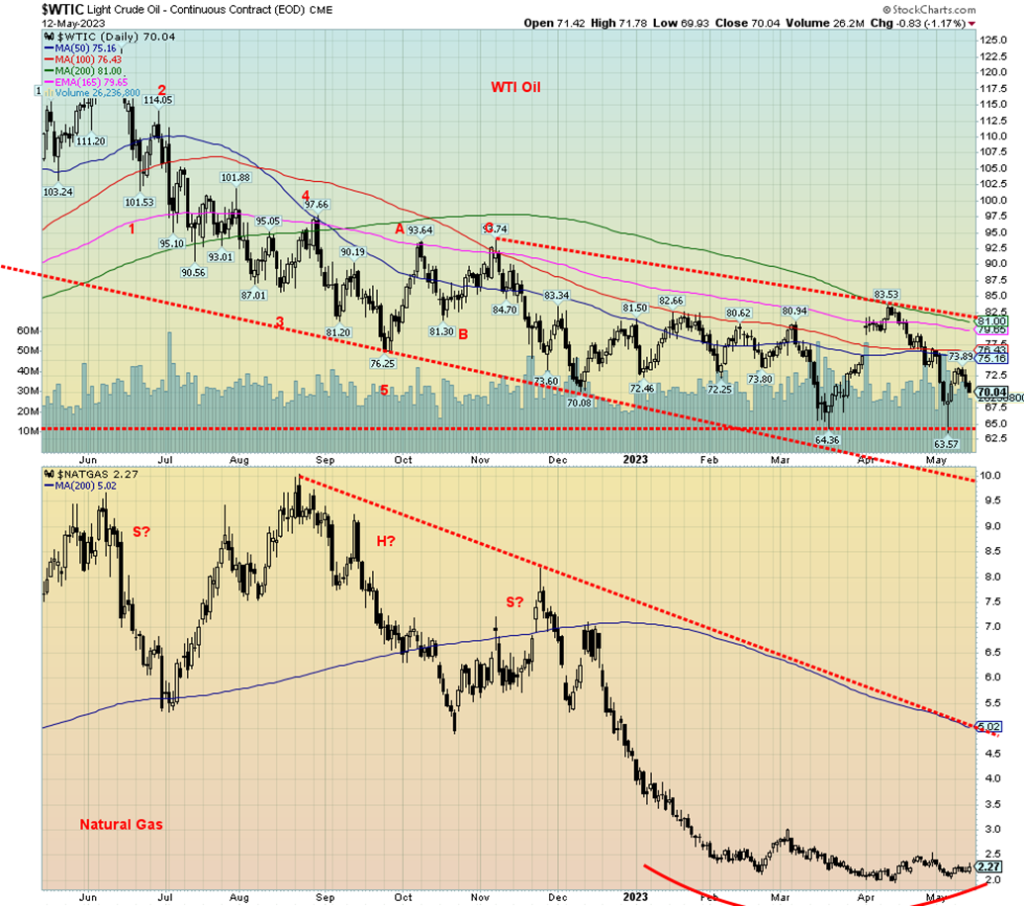
Oil prices cannot get out of the way of themselves. Bearish sentiment rules. So what, if Chinese demand rebounds? So what, if the U.S. decides to refill the Strategic Petroleum Reserves (SPR)? So what, if tensions still flair with Russia/Ukraine and in the Middle East against Iran? Maybe OPEC will cut production again.
This past week WTI oil fell back, losing 1.8%. However, in a surprise, Brent crude rose 4%. The mixed-up world continued with natural gas (NG). Henry Hub NG rose 6.1%, but the Dutch EU Hub fell 10.4%. Divergences?
When we see these our suspicion is something is amiss. One of them is wrong. The energy stocks didn’t know what to do so they sold off, but not by a lot. The ARCA Oil & Gas Index (XOI) fell 1.6% while the TSX Energy Index (TEN) was down 2.2%.
In one interesting move, Pakistan is buying Russian oil and paying for it in Chinese yuan. A continuation of what many are calling de-dollarization? Still, the bulk of the world prices oil in U.S. dollars.
Oil prices are falling, strictly because of fear of recession and the resulting lower demand. Not that anyone has gone into an official recession yet nor has unemployment jumped. Traffic congestion is severe in some cities (Toronto, where we live, is one of most congested in North America). Yet the freeways are parking lots plenty of times as everyone drives, it seems. But a reminder that on an inflation-adjusted basis WTI oil prices are less than where they were in November 1985 and less than half the price of where they were in June 2008. By many measurements oil is cheap. Today’s price at the pump is around 77 cents/litre in 1990 inflation-adjusted prices. In December 1990 gas at the pump was 71 cents/litre.
We suspect that this is a test of the recent low of $63.57. Recently, WTI made new lows but Brent did not. And then again, this past week WTI was down but Brent was up. The divergences continue and it would appear to point to higher prices ahead. Still, it is a long way to a break out above $81/$82. NG continues to make what we believe is a rounding bottom. But we won’t feel comfortable until we take out $3 to suggest higher prices. The trouble is, as well, the strong seasonal period for both oil and gas is December to June. The official driving season gets underway after the Victoria and Memorial Day weekends later in May.
__
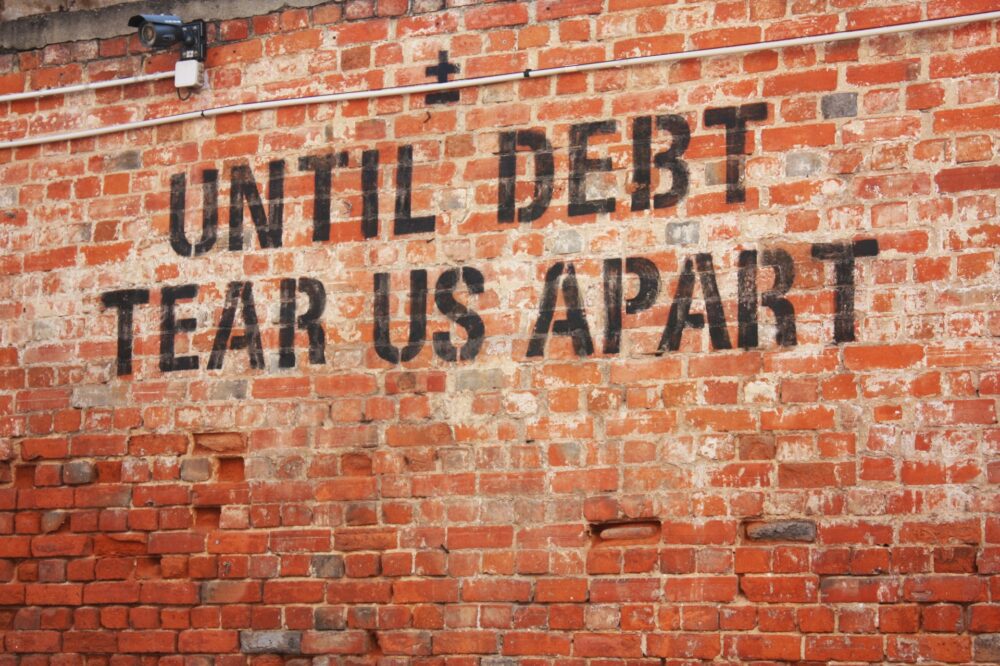
(Featured image by geralt via Pixabay)
DISCLAIMER: This article was written by a third-party contributor and does not reflect the opinion of Born2Invest, its management, staff, or its associates. Please review our disclaimer for more information.
This article may include forward-looking statements. These forward-looking statements generally are identified by the words “believe,” “project,” “estimate,” “become,” “plan,” “will,” and similar expressions. These forward-looking statements involve known and unknown risks as well as uncertainties, including those discussed in the following cautionary statements and elsewhere in this article and on this site. Although the Company may believe that its expectations are based on reasonable assumptions, the actual results that the Company may achieve may differ materially from any forward-looking statements, which reflect the opinions of the management of the Company only as of the date hereof. Additionally, please make sure to read these important disclosures.
Copyright David Chapman 2023
David Chapman is not a registered advisory service and is not an exempt market dealer (EMD) nor a licensed financial advisor. He does not and cannot give individualised market advice. David Chapman has worked in the financial industry for over 40 years including large financial corporations, banks, and investment dealers. The information in this newsletter is intended only for informational and educational purposes. It should not be construed as an offer, a solicitation of an offer or sale of any security. Every effort is made to provide accurate and complete information. However, we cannot guarantee that there will be no errors. We make no claims, promises or guarantees about the accuracy, completeness, or adequacy of the contents of this commentary and expressly disclaim liability for errors and omissions in the contents of this commentary. David Chapman will always use his best efforts to ensure the accuracy and timeliness of all information. The reader assumes all risk when trading in securities and David Chapman advises consulting a licensed professional financial advisor or portfolio manager such as Enriched Investing Incorporated before proceeding with any trade or idea presented in this newsletter. David Chapman may own shares in companies mentioned in this newsletter. Before making an investment, prospective investors should review each security’s offering documents which summarize the objectives, fees, expenses and associated risks. David Chapman shares his ideas and opinions for informational and educational purposes only and expects the reader to perform due diligence before considering a position in any security. That includes consulting with your own licensed professional financial advisor such as Enriched Investing Incorporated. Performance is not guaranteed, values change frequently, and past performance may not be repeated.


Ecobnb Turns Sustainable Tourism Into Measurable Impact
Ecobnb’s sustainable tourism platform generated significant environmental and social impact in 2025, avoiding 58,207 kg of CO₂ and adding 583...


Sugar Markets Balance Biofuel Demand and Global Supply
Sugar markets in New York and London were mostly unchanged as the Iran conflict renewed interest in biofuels. Drought concerns...


The $40 Trillion Trap: Disinflation Is Not Deliverance
U.S. debt has reached $40 trillion, with $24 billion weekly interest, while deficits accelerate. Despite disinflation in CPI, from cooling...


FinTech Matures as AI and Infrastructure Drive the Next Growth Phase
Fintech markets are entering a mature phase, shifting from rapid growth to consolidation, specialization, and sustainable business models. Zurich and...


Bitcoin, and Ethereum Rise, While Cardano Enters Transition
Bitcoin and Ethereum posted modest weekend gains, supported by ETF inflows. A new proposal may protect Bitcoin from quantum threats....
 |
|
 |  |
 |
|
-

 Fintech2 weeks ago
Revolut Updates Crypto Rules for Deposits and System Errors
-
 Business7 hours ago
The $40 Trillion Trap: Disinflation Is Not Deliverance
-

 Cannabis1 week ago
Germany Tightens Cannabis Reimbursement Rules: Approved Medicines Must Come First
-

 Crowdfunding2 weeks ago
Lemonaid Offers Shares to Consumers for the First Time